Contents of this page is copied directly from AWS blog sites to make it Kindle friendly. Some styles & sections from these pages are removed to render this properly in 'Article Mode' of Kindle e-Reader browser. All the contents of this page is property of AWS.
Page 1|Page 2|Page 3|Page 4
Understanding how AWS Lambda scales with Amazon SQS standard queues
=======================
Update Dec 8, 2021: AWS Lambda now supports partial batch responses for Amazon SQS as an event source. This is a native way to prevent successfully processed messages from being returned to the SQS queue. To learn more, read Using AWS Lambda with SQS.
This post is written by John Lee, Solutions Architect, and Isael Pelletier, Senior Solutions Architect.
Many architectures use Amazon SQS, a fully managed message queueing service, to decouple producers and consumers. SQS is a fundamental building block for building decoupled architectures. AWS Lambda is also fully managed by AWS and is a common choice as a consumer as it supports native integration with SQS. This combination of services allows you to write and maintain less code and unburden you from the heavy lifting of server management.
This blog post looks into optimizing the scaling behavior of Lambda functions when subscribed to an SQS standard queue. It discusses how Lambda’s scaling works in this configuration and reviews best practices for maximizing message throughput. The post provides insight into building your own scalable workload and guides you in building well-architected workloads.
Scaling Lambda functions
When a Lambda function subscribes to an SQS queue, Lambda polls the queue as it waits for messages to arrive. Lambda consumes messages in batches, starting at five concurrent batches with five functions at a time.
If there are more messages in the queue, Lambda adds up to 60 functions per minute, up to 1,000 functions, to consume those messages. This means that Lambda can scale up to 1,000 concurrent Lambda functions processing messages from the SQS queue.

Figure 1. The Lambda service polls the SQS queue and batches messages that are processed by automatic scaling Lambda functions. You start with five concurrent Lambda functions.
This scaling behavior is managed by AWS and cannot be modified. To process more messages, you can optimize your Lambda configuration for higher throughput. There are several strategies you can implement to do this.
Increase the allocated memory for your Lambda function
The simplest way to increase throughput is to increase the allocated memory of the Lambda function. While you do not have control over the scaling behavior of the Lambda functions subscribed to an SQS queue, you control the memory configuration.
Faster Lambda functions can process more messages and increase throughput. This works even if a Lambda function’s memory utilization is low. This is because increasing memory also increases vCPUs in proportion to the amount configured. Each function now supports up to 10 GB of memory and you can access up to six vCPUs per function.
You may need to modify code to take advantage of the extra vCPUs. This consists of implementing multithreading or parallel processing to use all the vCPUs. You can find a Python example in this blog post.
To see the average cost and execution speed for each memory configuration before making a decision, Lambda Power Tuning tool helps to visualize the tradeoffs.
Optimize batching behavior
Batching can increase message throughput. By default, Lambda batches up to 10 messages in a queue to process them during a single Lambda execution. You can increase this number up to 10,000 messages, or up to 6 MB of messages in a single batch for standard SQS queues.
If each payload size is 256 KB (the maximum message size for SQS), Lambda can only take 23 messages per batch, regardless of the batch size setting. Similar to increasing memory for a Lambda function, processing more messages per batch can increase throughput.
However, increasing the batch size does not always achieve this. It is important to understand how message batches are processed. All messages in a failed batch return to the queue. This means that if a Lambda function with five messages fails while processing the third message, all five messages are returned to the queue, including the successfully processed messages. The Lambda function code must be able to process the same message multiple times without side effects.

Figure 2. A Lambda function returning all five messages to the queue after failing to process the third message.
To prevent successfully processed messages from being returned to SQS, you can add code to delete the processed messages from the queue manually. You can also use existing open source libraries, such as Lambda Powertools for Python or Lambda Powertools for Java that provide this functionality.
Catch errors from the Lambda function
The Lambda service scales to process messages from the SQS queue when there are sufficient messages in the queue.
However, there is a case where Lambda scales down the number of functions, even when there are messages remaining in the queue. This is when a Lambda function throws errors. The Lambda function scales down to minimize erroneous invocations. To sustain or increase the number of concurrent Lambda functions, you must catch the errors so the function exits successfully.
To retain the failed messages, use an SQS dead-letter queue (DLQ). There are caveats to this approach. Catching errors without proper error handling and tracking mechanisms can result in errors being ignored instead of raising alerts. This may lead to silent failures while Lambda continues to scale and process messages in the queue.
Relevant Lambda configurations
There are several Lambda configuration settings to consider for optimizing Lambda’s scaling behavior. Paying attention to the following configurations can help prevent throttling and increase throughput of your Lambda function.
Reserved concurrency
If you use reserved concurrency for a Lambda function, set this value greater than five. This value sets the maximum number of concurrent Lambda functions that can run. Lambda allocates five functions to consume five batches at a time. If the reserved concurrency value is lower than five, the function is throttled when it tries to process more than this value concurrently.
Batching Window
For larger batch sizes, set the MaximumBatchingWindowInSeconds parameter to at least 1 second. This is the maximum amount of time that Lambda spends gathering records before invoking the function. If this value is too small, Lambda may invoke the function with a batch smaller than the batch size. If this value is too large, Lambda polls for a longer time before processing the messages in the batch. You can adjust this value to see how it affects your throughput.
Queue visibility timeout
All SQS messages have a visibility timeout that determines how long the message is hidden from the queue after being selected up by a consumer. If the message is not successfully processed or deleted, the message reappears in the queue when the visibility timeout ends.
Give your Lambda function enough time to process the message by setting the visibility timeout based on your function-specific metrics. You should set this value to six times the Lambda function timeout plus the value of MaximumBatchingWindowInSeconds. This prevents other functions from unnecessarily processing the messages while the message is already being processed.
Dead-letter queues (DLQs)
Failed messages are placed back in the queue to be retried by Lambda. To prevent failed messages from getting added to the queue multiple times, designate a DLQ and send failed messages there.
The number of times the messages should be retried is set by the Maximum receives value for the DLQ. Once the message is re-added to the queue more than the Maximum receives value, it is placed in the DLQ. You can then process this message at a later time.
This allows you to avoid situations where many failed messages are continuously placed back into the queue, consuming Lambda resources. Failed messages scale down the Lambda function and add the entire batch to the queue, which can worsen the situation. To ensure smooth scaling of the Lambda function, move repeatedly failing messages to the DLQ.
Conclusion
This post explores Lambda’s scaling behavior when subscribed to SQS standard queues. It walks through several ways to scale faster and maximize Lambda throughput when needed. This includes increasing the memory allocation for the Lambda function, increasing batch size, catching errors, and making configuration changes. Better understanding the levers available for SQS and Lambda interaction can help in meeting your scaling needs.
To learn more about building decoupled architectures, see these videos on Amazon SQS. For more serverless learning resources, visit https://serverlessland.com.
Implementing interruption tolerance in Amazon EC2 Spot with AWS Fault Injection Simulator
=======================
This post is written by Steve Cole, WW SA Leader for EC2 Spot, and David Bermeo, Senior Product Manager for EC2.
On October 20, 2021, AWS released new functionality to the Amazon Fault Injection Simulator that supports triggering the interruption of Amazon EC2 Spot Instances. This functionality lets you test the fault tolerance of your software by interrupting instances on command. The triggered interruption will be preceded with a Rebalance Recommendation (RBR) and Instance Termination Notification (ITN) so that you can fully test your applications as if an actual Spot interruption had occurred.
In this post, we’ll provide two examples of how easy it has now become to simulate Spot interruptions and validate the fault-tolerance of an application or service. We will demonstrate testing an application through the console and a service via CLI.
Engineering use-case (console)
Whether you are building a Spot-capable product or service from scratch or evaluating the Spot compatibility of existing software, the first step in testing is identifying whether or not the software is tolerant of being interrupted.
In the past, one way this was accomplished was with an AWS open-source tool called the Amazon EC2 Metadata Mock. This tool let customers simulate a Spot interruption as if it had been delivered through the Instance Metadata Service (IMDS), which then let customers test how their code responded to an RBR or an ITN. However, this model wasn’t a direct plug-and-play solution with how an actual Spot interruption would occur, since the signal wasn’t coming from AWS. In particular, the method didn’t provide the centralized notifications available through Amazon EventBridge or Amazon CloudWatch Events that enabled off-instance activities like launching AWS Lambda functions or other orchestration work when an RBR or ITN was received.
Now, Fault Injection Simulator has removed the need for custom logic, since it lets RBR and ITN signals be delivered via the standard IMDS and event services simultaneously.
Let’s walk through the process in the AWS Management Console. We’ll identify an instance that’s hosting a perpetually-running queue worker that checks the IMDS before pulling messages from Amazon Simple Queue Service (SQS). It will be part of a service stack that is scaled in and out based on the queue depth. Our goal is to make sure that the IMDS is being polled properly so that no new messages are pulled once an ITN is received. The typical processing time of a message with this example is 30 seconds, so we can wait for an ITN (which provides a two minute warning) and need not act on an RBR.
First, we go to the Fault Injection Simulator in the AWS Management Console to create an experiment.
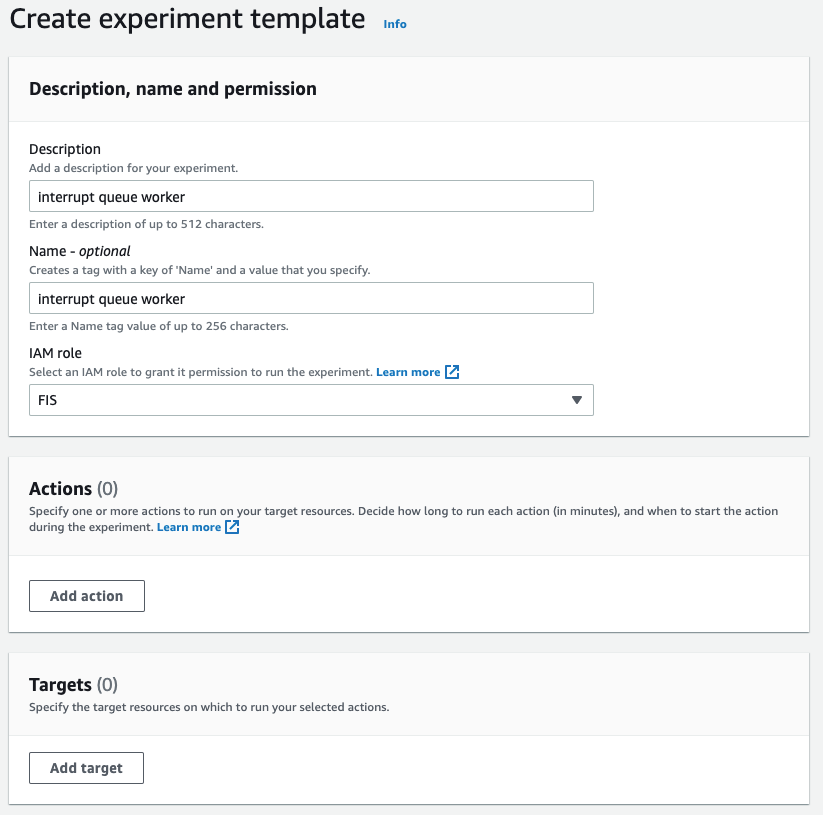
At the experiment creation screen, we start by creating an optional name (recommended for console use) and a description, and then selecting an IAM Role. If this is the first time that you’ve used Fault Injection Simulator, then you’ll need to create an IAM Role per the directions in the FIS IAM permissions documentation. I’ve named the role that we created ‘FIS.’ After that, I’ll select an action (interrupt) and identify a target (the instance).
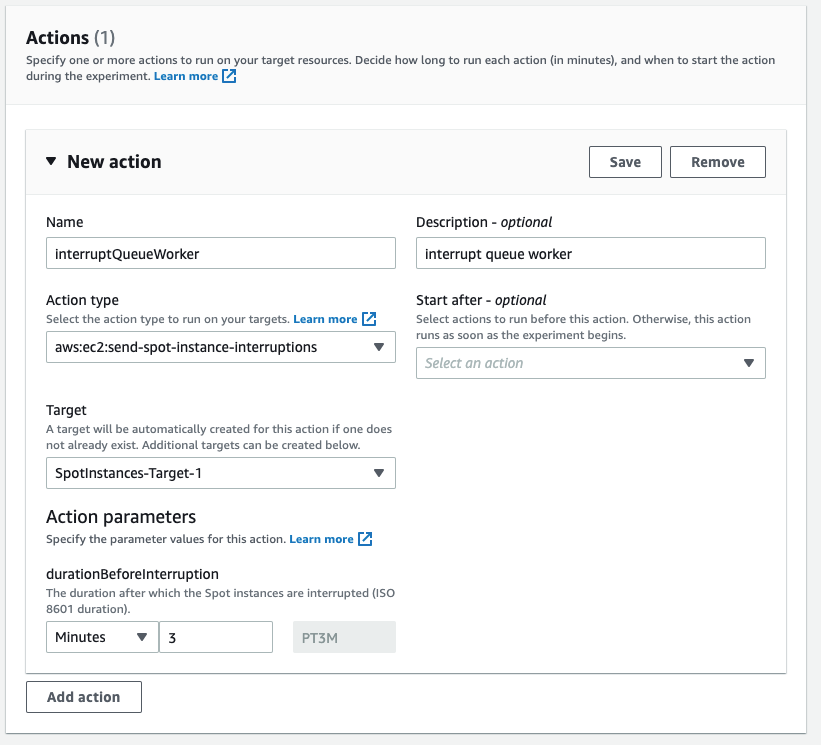
First, I name the action. The Action type I want is to interrupt the Spot Instance: aws:ec2:send-spot-instance-interruptions. In the Action parameters, we are given the option to set the duration. The minimum value here is two minutes, below which you will receive an error since Spot Instances will always receive a two minute warning. The advantage here is that, by setting the durationBeforeInterruption to a value above two minutes, you will get the RBR (an optional point for you to respond) and ITN (the actual two minute warning) at different points in time, and this lets you respond to one or both.
The target instance that we launched is depicted in the following screenshot. It is a Spot Instance that was launched as a persistent request with its interruption action set to ‘stop’ instead of ‘terminate.’ The option to stop a Spot Instance, introduced in 2020, will let us restart the instance, log in and retrieve logs, update code, and perform other work necessary to implement Spot interruption handling.
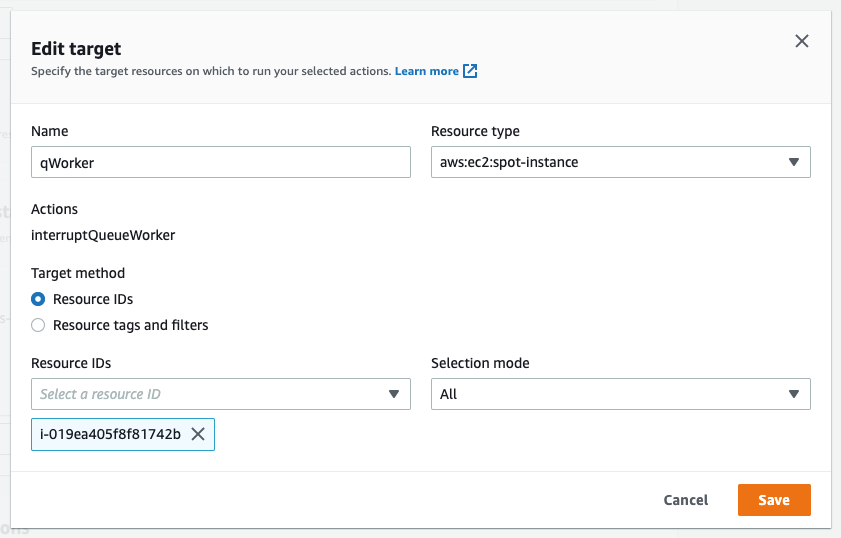
Now that an action has been defined, we configure the target. We have the option of naming the target, which we’ve done here to match the Name tagged on the EC2 instance ‘qWorker’. The target method we want to use here is Resource ID, and then we can either type or select the desired instance from a drop-down list. Selection mode will be ‘all’, as there is only one instance. If we were using tags, which we will in the next example, then we’d be able to select a count of instances, up to five, instead of just one.
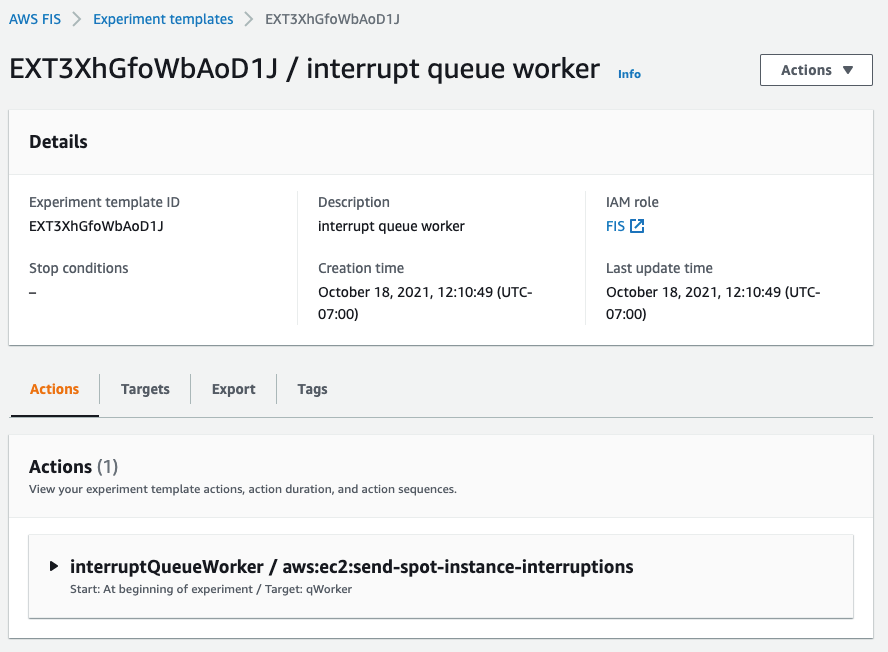
Once you’ve saved the Action, the Target, and the Experiment, then you’ll be able to begin the experiment by selecting the ‘Start from the Action’ menu at the top right of the screen.
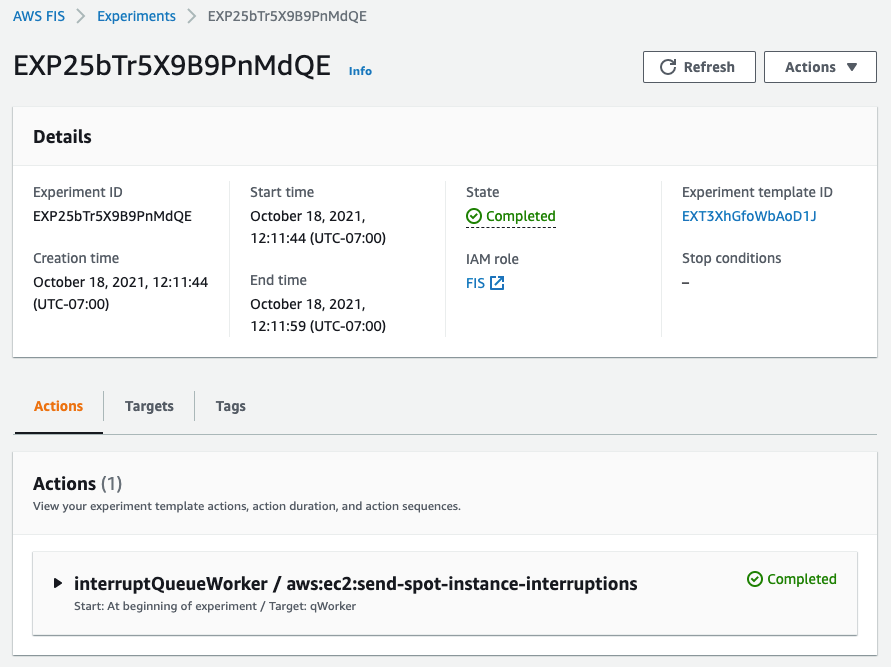
After the experiment starts, you’ll be able to observe its state by refreshing the screen. Generally, the process will take just seconds, and you should be greeted by the Completed state, as seen in the following screenshot.
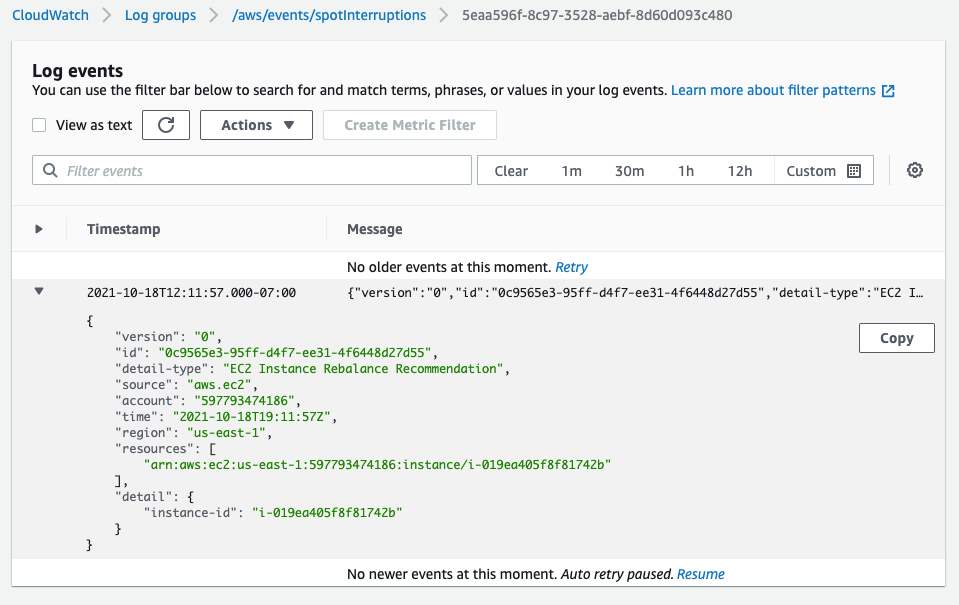
In the following screenshot, having opened an interruption log group created in CloudWatch Event Logs, we can see the JSON of the RBR.
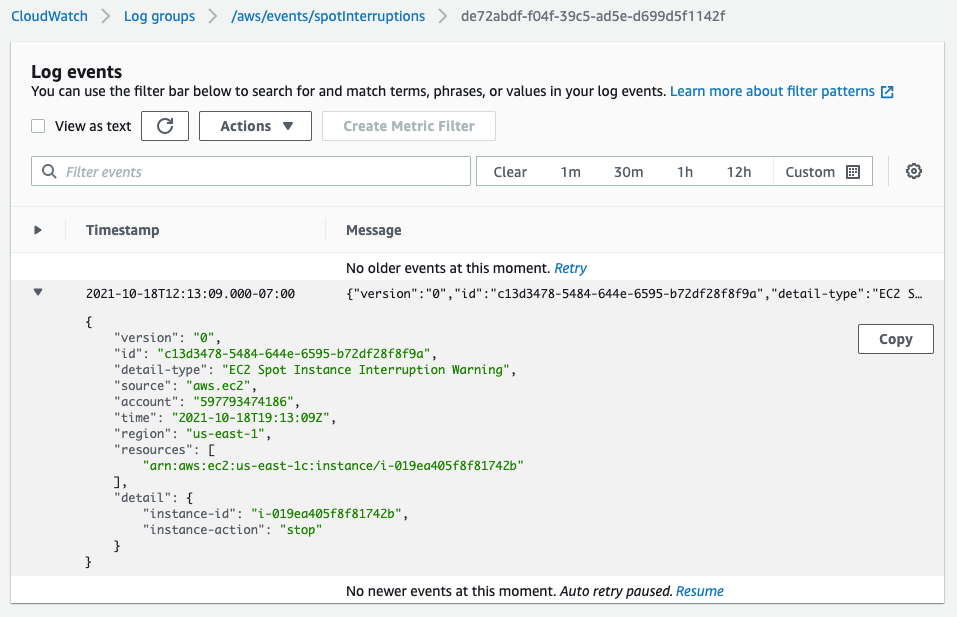
Two minutes later, we see the ITN in the same log group.
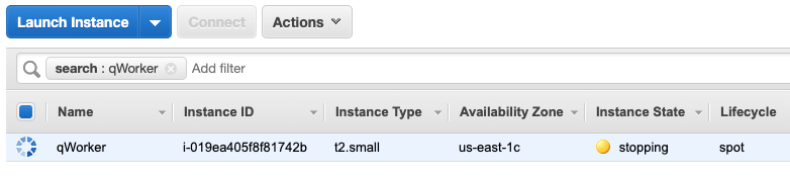
Another two minutes after the ITN, we can see the EC2 instance is in the process of stopping (or terminating, if you elect).
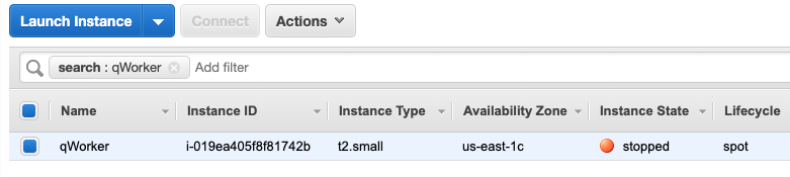
Shortly after the stop is issued by EC2, we can see the instance stopped. It would now be possible to restart the instance and view logs, make code changes, or do whatever you find necessary before testing again.
Now that our experiment succeeded in interrupting our Spot Instance, we can evaluate the performance of the code running on the instance. It should have completed the processing of any messages already retrieved at the ITN, and it should have not pulled any new messages afterward.
This experiment can be saved for later use, but it will require selecting the specific instance each time that it’s run. We can also re-use the experiment template by using tags instead of an instance ID, as we’ll show in the next example. This shouldn’t prove troublesome for infrequent experiments, and especially those run through the console. Or, as we did in our example, you can set the instance interruption behavior to stop (versus terminate) and re-use the experiment as long as that particular instance continues to exist. When the experiments get more frequent, it might be advantageous to automate the process, possibly as part of the test phase of a CI/CD pipeline. Doing this is programmatically possible through the AWS CLI or SDK.
Operations use-case (CLI)
Once the developers of our product validate the single-instance fault tolerance, indicating that the target workload is capable of running on Spot Instances, then the next logical step is to deploy the product as a service on multiple instances. This will allow for more comprehensive testing of the service as a whole, and it is a key process in collecting valuable information, such as performance data, response times, error rates, and other metrics to be used in the monitoring of the service. Once data has been collected on a non-interrupted deployment, it is then possible to use the Spot interruption action of the Fault Injection Simulator to observe how well the service can handle RBR and ITN while running, and to see how those events influence the metrics collected previously.
When testing a service, whether it is launched as instances in an Amazon EC2 Auto Scaling group, or it is part of one of the AWS container services, such as Amazon Elastic Container Service (Amazon ECS) or the Amazon Elastic Kubernetes Service (EKS), EC2 Fleet, Amazon EMR, or across any instances with descriptive tagging, you now have the ability to trigger Spot interruptions to as many as five instances in a single Fault Injection Simulator experiment.
We’ll use tags, as opposed to instance IDs, to identify candidates for interruption to interrupt multiple Spot Instances simultaneously. We can further refine the candidate targets with one or more filters in our experiment, for example targeting only running instances if you perform an action repeatedly.
In the following example, we will be interrupting three instances in an Auto Scaling group that is backing a self-managed EKS node group. We already know the software will behave as desired from our previous engineering tests. Our goal here is to see how quickly EKS can launch replacement tasks and identify how the service as a whole responds during the event. In our experiment, we will identify instances that contain the tag aws:autoscaling:groupName with a value of “spotEKS”.
The key benefit here is that we don’t need a list of instance IDs in our experiment. Therefore, this is a re-usable experiment that can be incorporated into test automation without needing to make specific selections from previous steps like collecting instance IDs from the target Auto Scaling group.
We start by creating a file that describes our experiment in JSON rather than through the console:
{
"description": "interrupt multiple random instances in ASG",
"targets": {
"spotEKS": {
"resourceType": "aws:ec2:spot-instance",
"resourceTags": {
"aws:autoscaling:groupName": "spotEKS"
},
"selectionMode": "COUNT(3)"
}
},
"actions": {
"interrupt": {
"actionId": "aws:ec2:send-spot-instance-interruptions",
"description": "interrupt multiple instances",
"parameters": {
"durationBeforeInterruption": "PT4M"
},
"targets": {
"SpotInstances": "spotEKS"
}
}
},
"stopConditions": [
{
"source": "none"
}
],
"roleArn": "arn:aws:iam::xxxxxxxxxxxx:role/FIS",
"tags": {
"Name": "multi-instance"
}
}
Then we upload the experiment template to Fault Injection Simulator from the command-line.
aws fis create-experiment-template --cli-input-json file://experiment.json
The response we receive returns our template along with an ID, which we’ll need to execute the experiment.
{
"experimentTemplate": {
"id": "EXT3SHtpk1N4qmsn",
...
}
}
We then execute the experiment from the command-line using the ID that we were given at template creation.
aws fis start-experiment --experiment-template-id EXT3SHtpk1N4qmsn
We then receive confirmation that the experiment has started.
{
"experiment": {
"id": "EXPaFhEaX8GusfztyY",
"experimentTemplateId": "EXT3SHtpk1N4qmsn",
"state": {
"status": "initiating",
"reason": "Experiment is initiating."
},
...
}
}
To check the status of the experiment as it runs, which for interrupting Spot Instances is quite fast, we can query the experiment ID for success or failure messages as follows:
aws fis get-experiment --id EXPaFhEaX8GusfztyY
And finally, we can confirm the results of our experiment by listing our instances through EC2. Here we use the following command-line before and after execution to generate pre- and post-experiment output:
aws ec2 describe-instances --filters\
Name='tag:aws:autoscaling:groupName',Values='spotEKS'\
Name='instance-state-name',Values='running'\
| jq .Reservations[].Instances[].InstanceId | sort
We can then compare this to identify which instances were interrupted and which were launched as replacements.
< "i-003c8d95c7b6e3c63"
< "i-03aa172262c16840a"
< "i-02572fa37a61dc319"
---
> "i-04a13406d11a38ca6"
> "i-02723d957dc243981"
> "i-05ced3f71736b5c95"
Summary
In the previous examples, we have demonstrated through the console and command-line how you can use the Spot interruption action in the Fault Injection Simulator to ascertain how your software and service will behave when encountering a Spot interruption. Simulating Spot interruptions will help assess the fault-tolerance of your software and can assess the impact of interruptions in a running service. The addition of events can enable more tooling, and being able to simulate both ITNs and RBRs, along with the Capacity Rebalance feature of Auto scaling groups, now matches the end-to-end experience of an actual AWS interruption. Get started on simulating Spot interruptions in the console.
Token-based authentication for iOS applications with Amazon SNS
=======================
This post is co-written by Karen Hong, Software Development Engineer, AWS Messaging.
To use Amazon SNS to send mobile push notifications, you must provide a set of credentials for connecting to the supported push notification service (see prerequisites for push). For the Apple Push Notification service (APNs), SNS now supports using token-based authentication (.p8), in addition to the existing certificate-based method.
You can now use a .p8 file to create or update a platform application resource through the SNS console or programmatically. You can publish messages (directly or from a topic) to platform application endpoints configured for token-based authentication.
In this tutorial, you set up an example iOS application. You retrieve information from your Apple developer account and learn how to register a new signing key. Next, you use the SNS console to set up a platform application and a platform endpoint. Finally, you test the setup and watch a push notification arrive on your device.
Advantages of token-based authentication
Token-based authentication has several benefits compared to using certificates. The first is that you can use the same signing key from multiple provider servers (iOS,VoIP, and MacOS), and you can use one signing key to distribute notifications for all of your company’s application environments (sandbox, production). In contrast, a certificate is only associated with a particular subset of these channels.
A pain point for customers using certificate-based authentication is the need to renew certificates annually, an inconvenient procedure which can lead to production issues when forgotten. Your signing key for token-based authentication, on the other hand, does not expire.
Token-based authentication improves the security of your certificates. Unlike certificate-based authentication, the credential does not transfer. Hence, it is less likely to be compromised. You establish trust through encrypted tokens that are frequently regenerated. SNS manages the creation and management of these tokens.
You configure APNs platform applications for use with both .p8 and .p12 certificates, but only 1 authentication method is active at any given time.
Setting up your iOS application
To use token-based authentication, you must set up your application.
Prerequisites: An Apple developer account
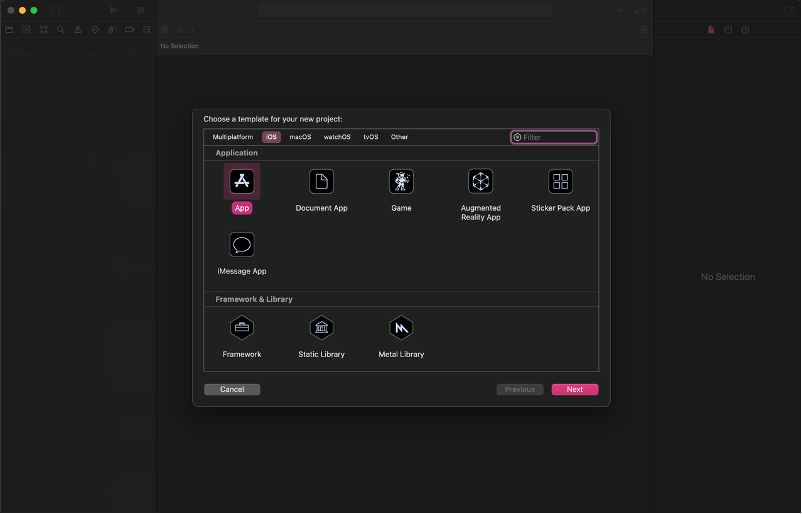
- Create a new XCode project. Select iOS as the platform and use the App template.
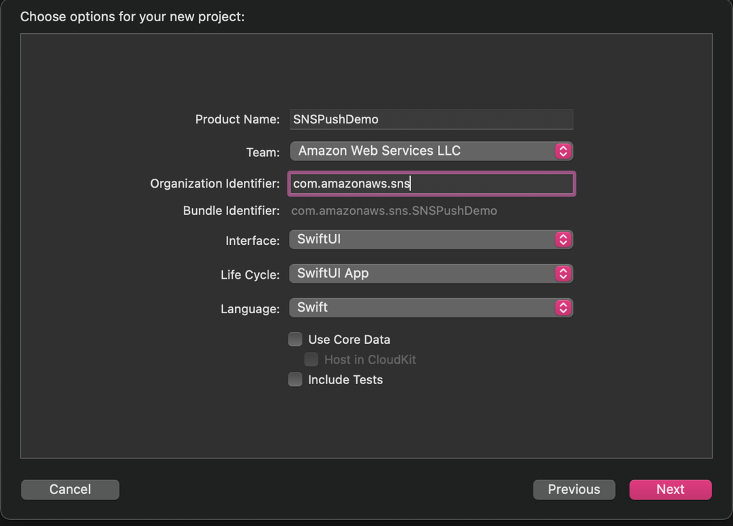
- Select your Apple Developer Account team and your organization identifier.
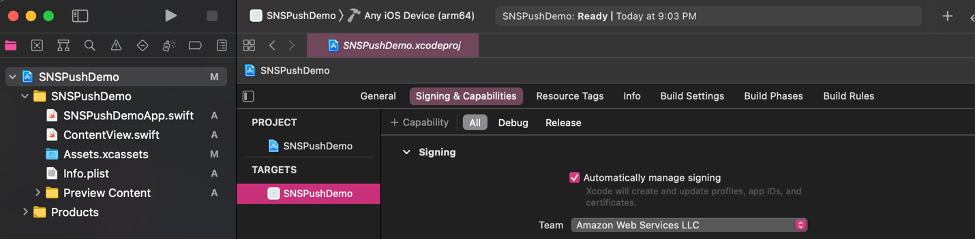
- Go to Signing & Capabilities and select + Capability. This step creates resources on your Apple Developer Account.
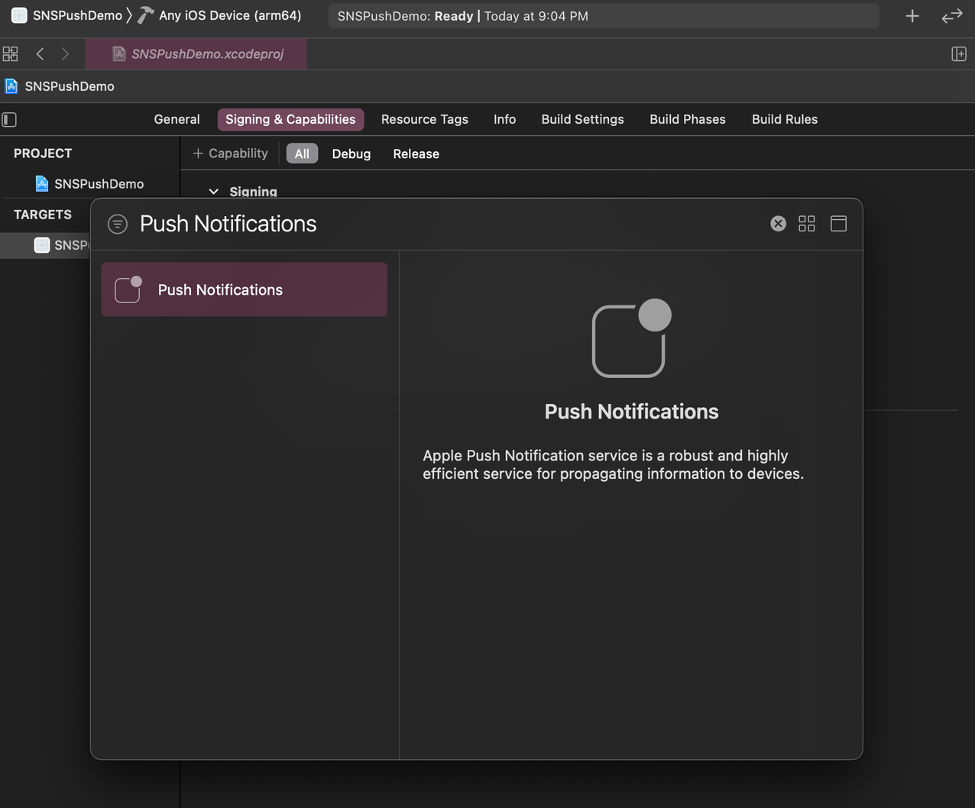
- Add the Push Notification Capability.
- In
SNSPushDemoApp.swift , add the following code to print the device token and receive push notifications. import SwiftUI
@main
struct SNSPushDemoApp: App {
@UIApplicationDelegateAdaptor private var appDelegate: AppDelegate
var body: some Scene {
WindowGroup {
ContentView()
}
}
}
class AppDelegate: NSObject, UIApplicationDelegate, UNUserNotificationCenterDelegate {
func application(_ application: UIApplication,
didFinishLaunchingWithOptions launchOptions: [UIApplication.LaunchOptionsKey : Any]? = nil) -> Bool {
UNUserNotificationCenter.current().delegate = self
return true
}
func application(_ application: UIApplication,
didRegisterForRemoteNotificationsWithDeviceToken deviceToken: Data) {
let tokenParts = deviceToken.map { data in String(format: "%02.2hhx", data) }
let token = tokenParts.joined()
print("Device Token: \(token)")
};
func application(_ application: UIApplication, didFailToRegisterForRemoteNotificationsWithError error: Error) {
print(error.localizedDescription)
}
func userNotificationCenter(_ center: UNUserNotificationCenter, willPresent notification: UNNotification, withCompletionHandler completionHandler: @escaping (UNNotificationPresentationOptions) -> Void) {
completionHandler([.banner, .badge, .sound])
}
}
- In
ContentView.swift, add the code to request authorization for push notifications and register for notifications. import SwiftUI
struct ContentView: View {
init() {
requestPushAuthorization();
}
var body: some View {
Button("Register") {
registerForNotifications();
}
}
}
struct ContentView_Previews: PreviewProvider {
static var previews: some View {
ContentView()
}
}
func requestPushAuthorization() {
UNUserNotificationCenter.current().requestAuthorization(options: [.alert, .badge, .sound]) { success, error in
if success {
print("Push notifications allowed")
} else if let error = error {
print(error.localizedDescription)
}
}
}
func registerForNotifications() {
UIApplication.shared.registerForRemoteNotifications()
}
- Build and run the app on an iPhone. The push notification feature does not work with a simulator.
- On your phone, select allow notifications when the prompt appears. The debugger prints out “Push notifications allowed” if it is successful.
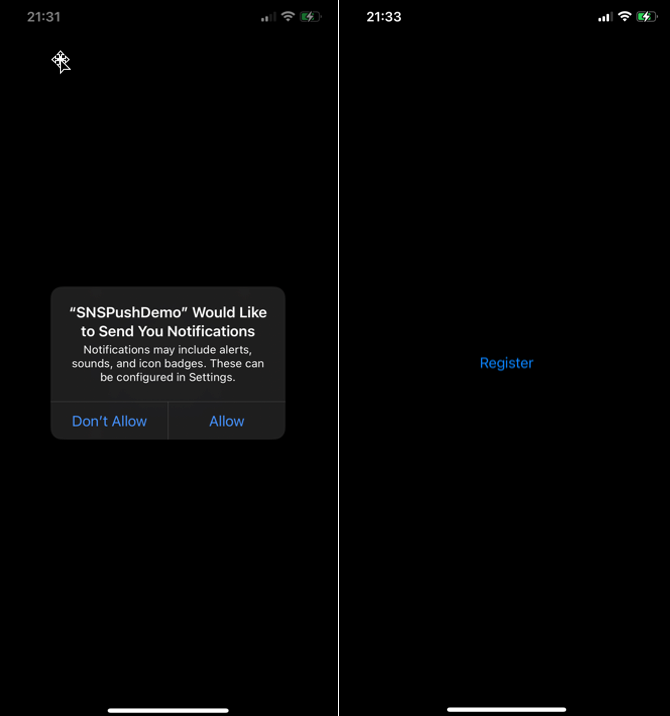
- On your phone, choose the Register button. The debugger prints out the device token.
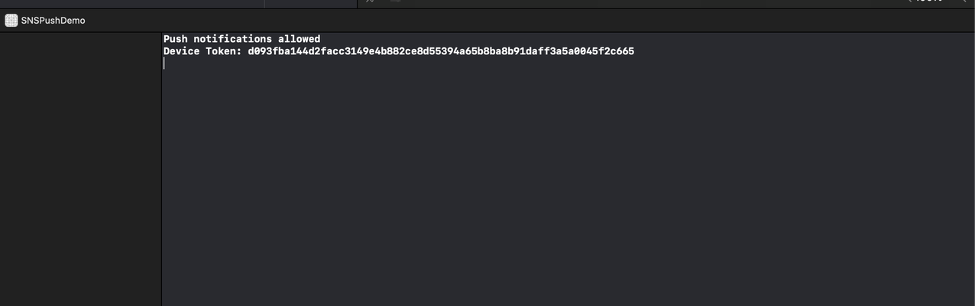
- You have set up an iOS application that can receive push notifications and prints the device token. We can now use this app to test sending push notifications with SNS configured for token-based authentication.
Retrieving your Apple resources
After setting up your application, you retrieve your Apple resources from your Apple developer account. There are four pieces of information you need from your Apple Developer Account: Bundle ID, Team ID, Signing Key, and Signing Key ID.
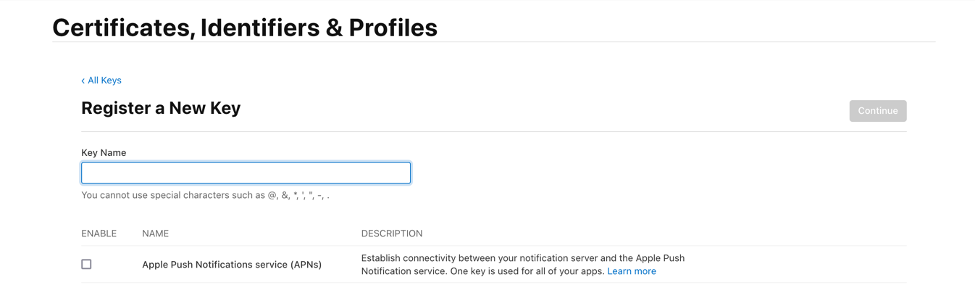
The signing key and signing key ID are credentials that you manage through your Apple Developer Account. You can register a new key by selecting the Keys tab under the Certificates, Identifiers & Profiles menu. Your Apple developer account provides the signing key in the form of a text file with a .p8 extension.
Find the team ID under Membership Details. The bundle ID is the unique identifier that you set up when creating your application. Find this value in the Identifiers section under the Certificates, Identifiers & Profiles menu.
Amazon SNS uses a token constructed from the team ID, signing key, and signing key ID to authenticate with APNs for every push notification that you send. Amazon SNS manages tokens on your behalf and renews them when necessary (within an hour). The request header includes the bundle ID and helps identify where the notification goes.
Creating a new platform application using APNs token-based authentication
Prerequisites
In order to implement APNs token-based authentication, you must have:
An Apple Developer Account
A mobile application
To create a new platform application:
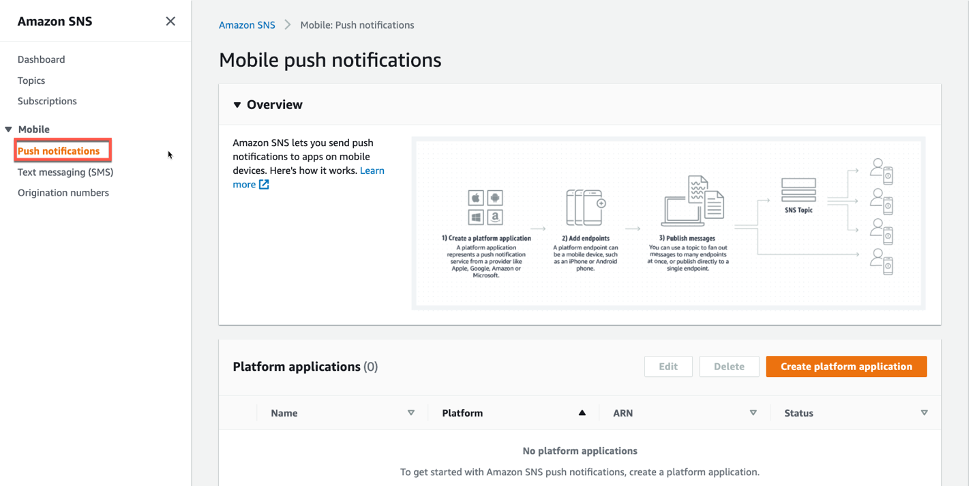
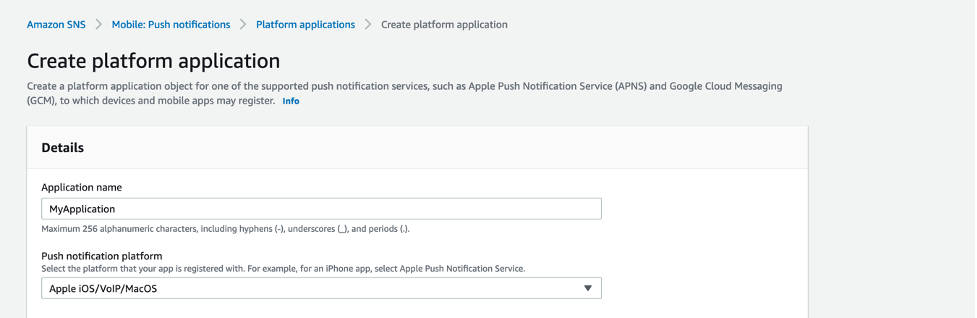
- Navigate to the Amazon SNS console and choose Push notifications. Then choose Create platform application.
- Enter a name for your application. In the Push notification platform dropdown, choose Apple iOS/VoIP/Mac.
- For the Push service, choose iOS, and for the Authentication method, choose Token. Select the check box labeled Used for development in sandbox. Then, input the fields from your Apple Developer Account.
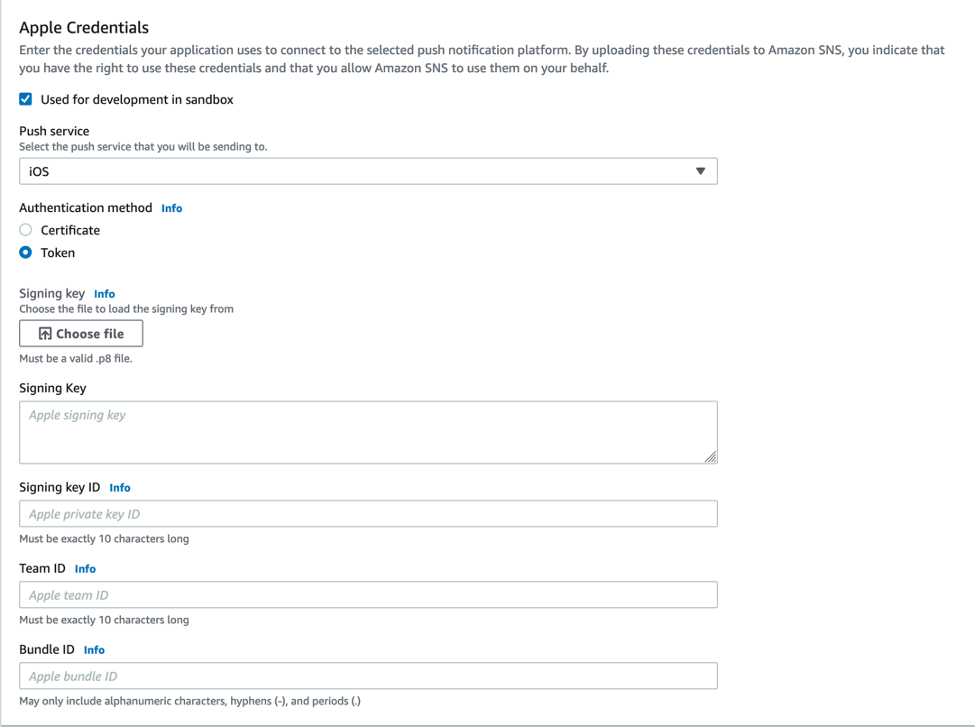
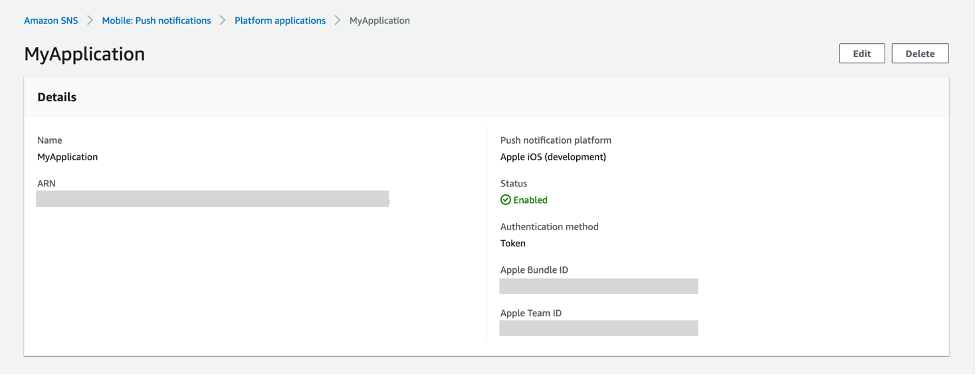
- You have successfully created a platform application using APNs token-based authentication.
Creating a new platform endpoint using APNs token-based authentication
A platform application stores credentials, sending configuration, and other settings but does not contain an exact sending destination. Create a platform endpoint resource to store the information to allow SNS to target push notifications to the proper application on the correct mobile device.
Any iOS application that is capable of receiving push notifications must register with APNs. Upon successful registration, APNs returns a device token that uniquely identifies an instance of an app. SNS needs this device token in order to send to that app. Each platform endpoint belongs to a specific platform application and uses the credentials and settings set in the platform application to complete the sending.
In this tutorial, you create the platform endpoint manually through the SNS console. In a real system, upon receiving the device token, you programmatically call SNS from your application server to create or update your platform endpoints.
These are the steps to create a new platform endpoint:
- From the details page of the platform application in the SNS console, choose Create application endpoint.
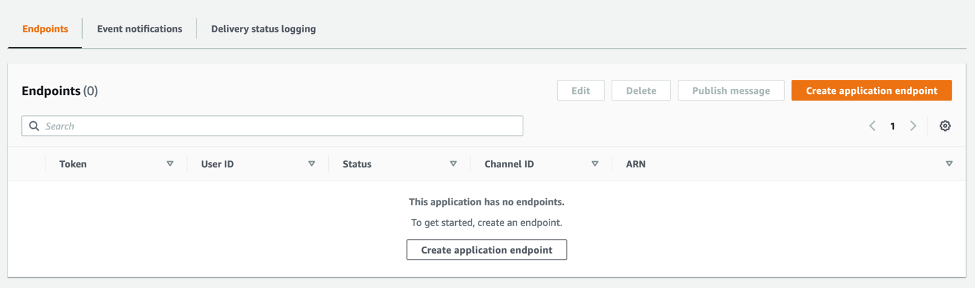
- From the iOS app that you set up previously, find the device token in the application logs. Enter the device token and choose Create application endpoint.
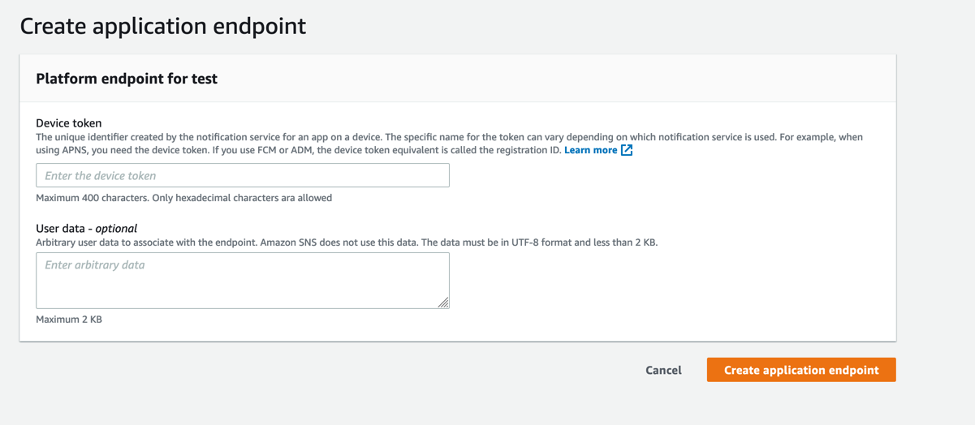
- You have successfully created a platform application endpoint.
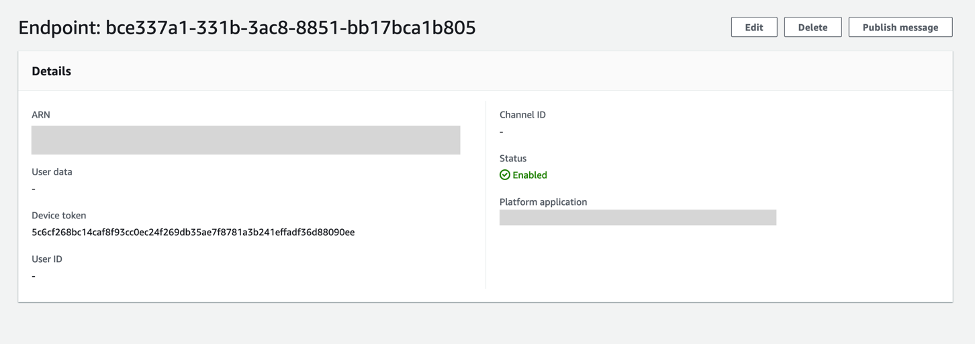
Testing a push notification from your device
In this section, you test a push notification from your device.
- From the details page of the application endpoint you just created, (this is the page you end up at immediately after creating the endpoint), choose Publish message.
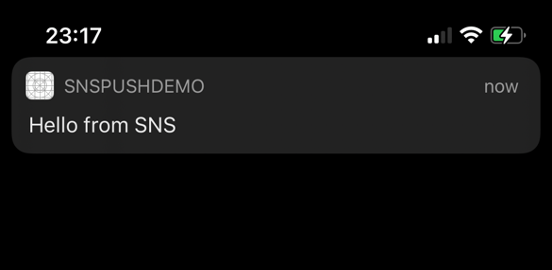
- Enter a message to send and choose Publish message.
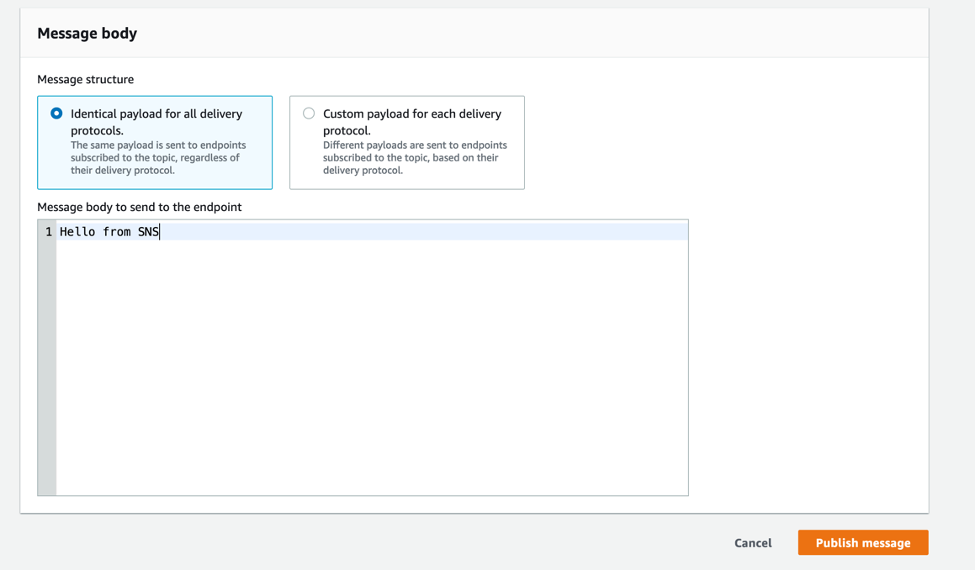
- The notification arrives on your iOS app.
Conclusion
Developers sending mobile push notifications can now use a .p8 key to authenticate an Apple device endpoint. Token-based authentication is more secure, and reduces operational burden of renewing the certificates every year. In this post, you learn how to set up your iOS application for mobile push using token-based authentication, by creating and configuring a new platform endpoint in the Amazon SNS console.
To learn more about APNs token-based authentication with Amazon SNS, visit the Amazon SNS Developer Guide. For more serverless content, visit Serverless Land.
Creating static custom domain endpoints with Amazon MQ for RabbitMQ
=======================
This post is written by Nate Bachmeier, Senior Solutions Architect, Wallace Printz, Senior Solutions Architect, Christian Mueller, Principal Solutions Architect.
Many cloud-native application architectures take advantage of the point-to-point and publish-subscribe, or “pub-sub”, model of message-based communication between application components. Not only is this architecture generally more resilient to failure because of the loose coupling and because message processing failures can be retried, it is also more efficient because individual application components can independently scale up or down to maintain message processing SLAs, compared to monolithic application architectures.
Synchronous (REST-based) systems are tightly coupled. A problem in a synchronous downstream dependency has immediate impact on the upstream callers. Retries from upstream callers can fan out and amplify problems.
For applications requiring messaging protocols including JMS, NMS, AMQP, STOMP, MQTT, and WebSocket, Amazon provides Amazon MQ. This is a managed message broker service for Apache ActiveMQ and RabbitMQ that makes it easier to set up and operate message brokers in the cloud.
Amazon MQ provides two managed broker deployment connection options: public brokers and private brokers. Public brokers receive internet-accessible IP addresses while private brokers receive only private IP addresses from the corresponding CIDR range in their VPC subnet. In some cases, for security purposes, customers may prefer to place brokers in a private subnet, but also allow access to the brokers through a persistent public endpoint, such as a subdomain of their corporate domain like ‘mq.example.com’.
This blog explains how to provision private Amazon MQ brokers behind a secure public load balancer endpoint using an example subdomain.
AmazonMQ also supports ActiveMQ – to learn more, read Creating static custom domain endpoints with Amazon MQ to simplify broker modification and scaling.
Overview
There are several reasons one might want to deploy this architecture beyond the security aspects. First, human-readable URLs are easier for people to parse when reviewing operations and troubleshooting, such as deploying updates to ‘mq-dev.example.com’ before ‘mq-prod.example.com’. Additionally, maintaining static URLs for your brokers helps reduce the necessity of modifying client code when performing maintenance on the brokers.
The following diagram shows the solutions architecture. This blog post assumes some familiarity with AWS networking fundamentals, such as VPCs, subnets, load balancers, and Amazon Route 53. For additional information on these topics, see the Elastic Load Balancing documentation.
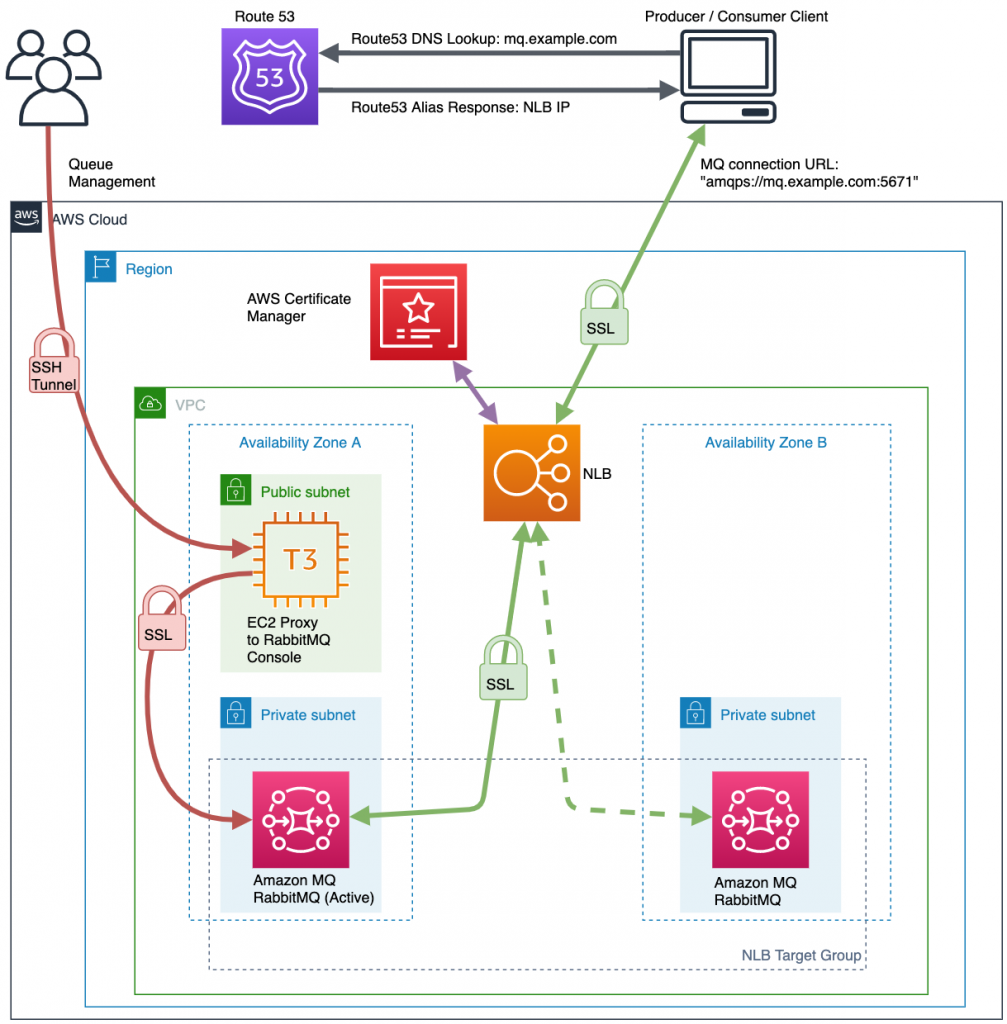
- The client service tries to connect with a RabbitMQ connection string to the domain endpoint setup in Route 53.
- The client looks up the domain name from Route 53, which returns the IP address of the Network Load Balancer (NLB).
- The client creates a Transport Layer Security (TLS) connection to the NLB with a secure socket layer (SSL) certificate provided from AWS Certificate Manager (ACM).
- The NLB chooses a healthy endpoint from the target group and creates a separate SSL connection. This provides secure, end-to-end SSL encrypted messaging between client and brokers.
To build this architecture, you build the network segmentation first, then add the Amazon MQ brokers, and finally the network routing. You need a VPC, one private subnet per Availability Zone, and one public subnet for your bastion host (if desired).
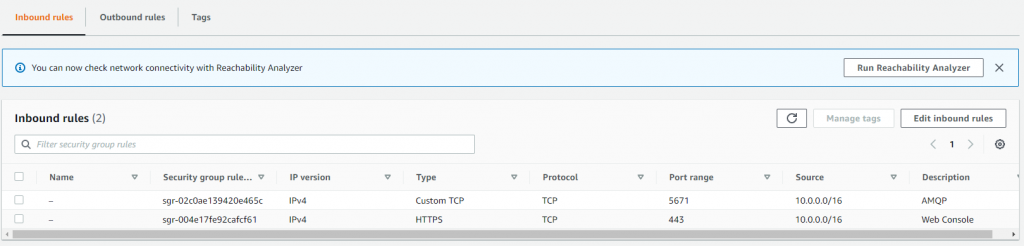
This demonstration VPC uses the 10.0.0.0/16 CIDR range. Additionally, you must create a custom security group for your brokers. You must set up this security group to allow traffic from your Network Load Balancer to the RabbitMQ brokers.
This example does not use this VPC for other workloads so it allows all incoming traffic that originates within the VPC (which includes the NLB) through to the brokers on the AMQP port of 5671 and the web console port of 443.
Adding the Amazon MQ brokers
With the network segmentation set up, add the Amazon MQ brokers:
- Choose Create brokers on the Active Amazon MQ home page.
- Toggle the radio button next to RabbitMQ and choose Next.
- Choose a deployment mode of either single-instance broker (for development environments), or cluster deployment (for production environments).
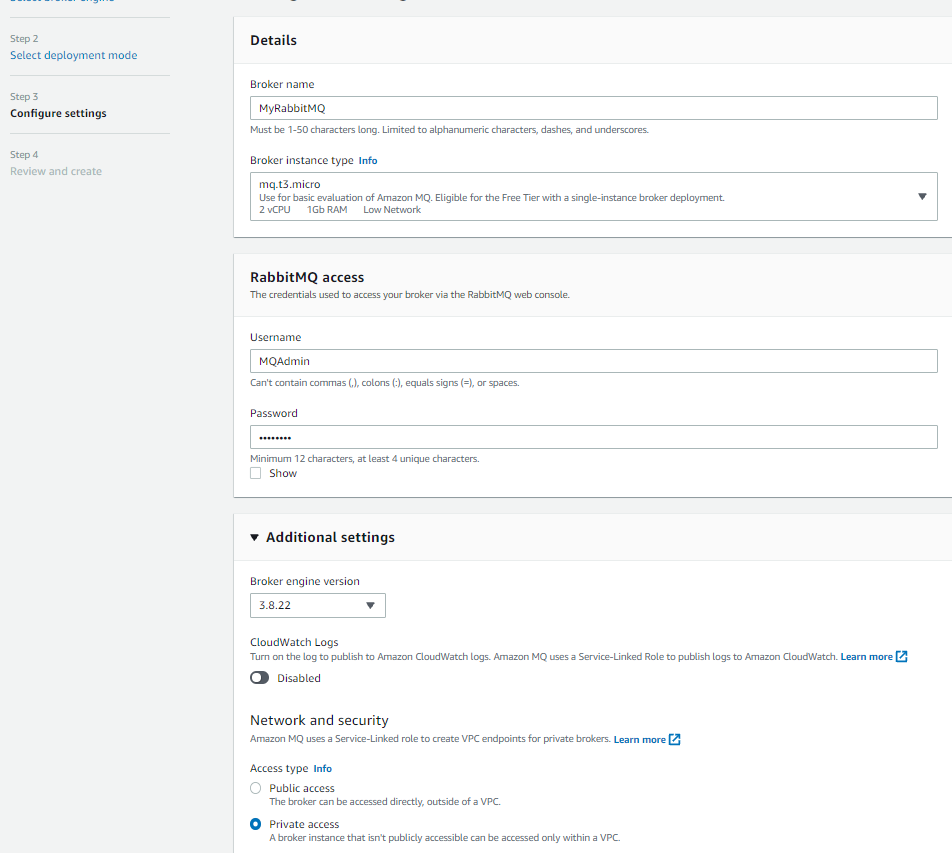
- In Configure settings, specify the broker name and instance type.
- Confirm that the broker engine version is 3.8.22 or higher and set Access type to Private access.
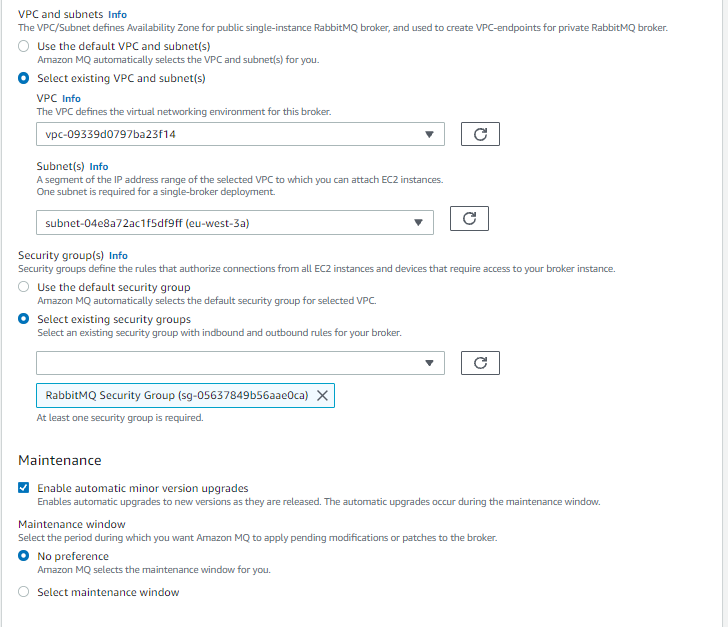
- Specify the VPC, private subnets, and security groups before choosing Next.
Finding the broker’s IP address
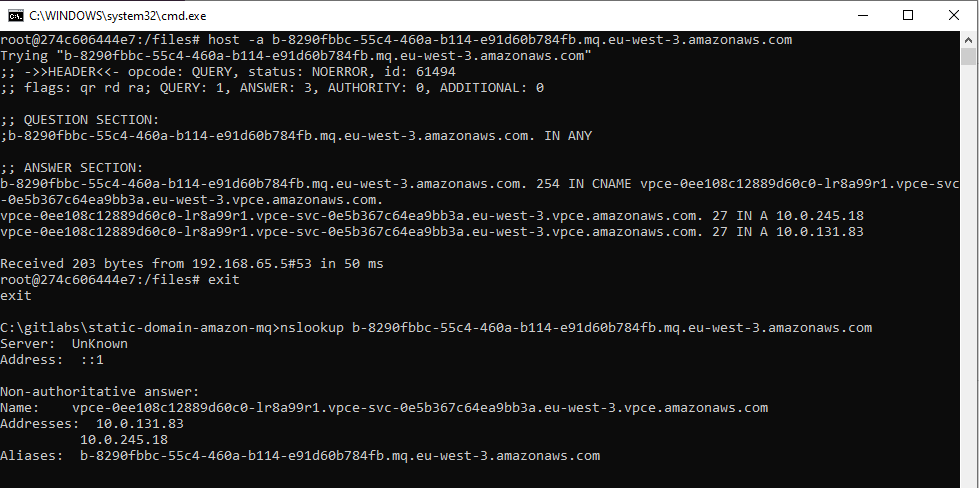
Before configuring the NLB’s target groups, you must look up the broker’s IP address. Unlike Amazon MQ for Apache ActiveMQ, RabbitMQ does not show its private IP addresses, though you can reliably find its VPC endpoints using DNS. Amazon MQ creates one VPC endpoint in each subnet with a static address that won’t change until you delete the broker.
- Navigate to the broker’s details page and scroll to the Connections panel.
- Find the endpoint’s fully qualified domain name. It is formatted like broker-id.mq.region.amazonaws.com.
- Open a command terminal on your local workstation.
- Retrieve the ‘A’ record values using the host (Linux) or nslookup (Windows) command.
- Record these values for the NLB configuration steps later.
Configure the load balancer’s target group
The next step in the build process is to configure the load balancer’s target group. You use the private IP addresses of the brokers as targets for the NLB. Create a Target Group, select the target type as IP, and make sure to choose the TLS protocol and for each required port, as well as the VPC your brokers reside in.
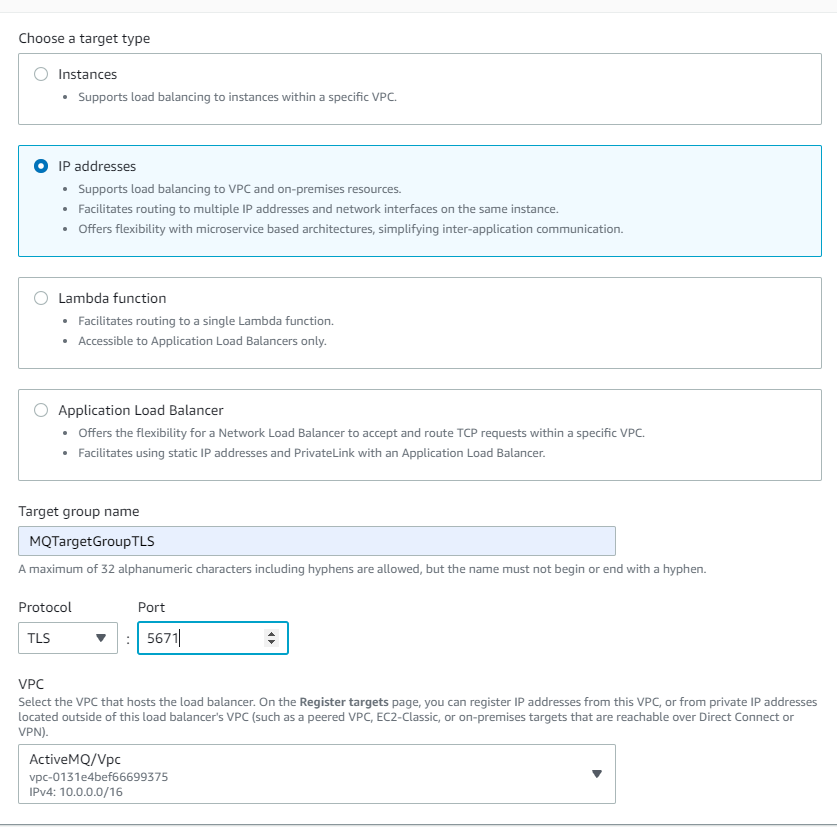
It is important to configure the health check settings so traffic is only routed to active brokers. Select the TCP protocol and override the health check port to 443 Rabbit MQ’s console port. Also, configure the healthy threshold to 2 with a 10-second check interval so the NLB detects faulty hosts within 20 seconds.
Be sure not to use RabbitMQ’s AMQP port as the target group health check port. The NLB may not be able to recognize the host as healthy on that port. It is better to use the broker’s web console port.

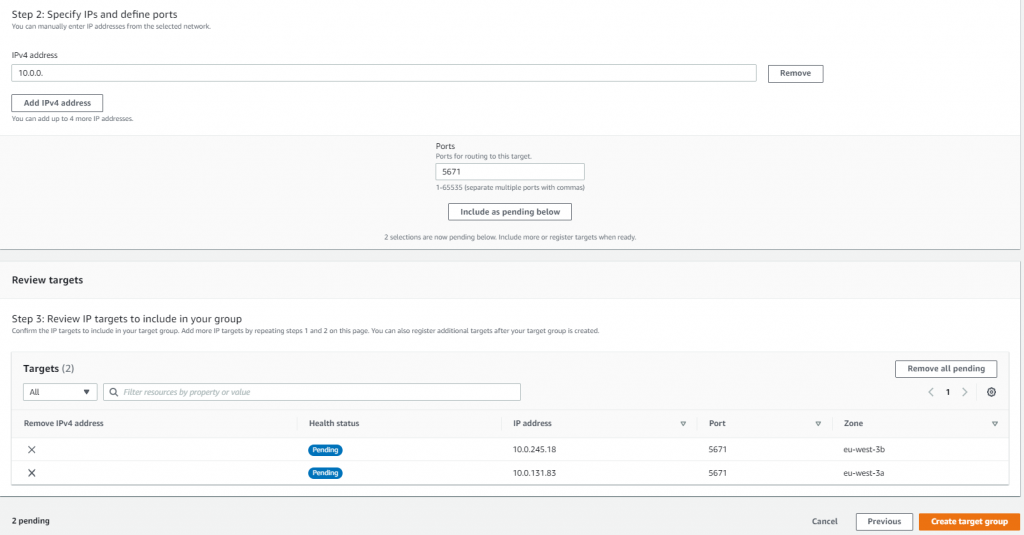
Add the VPC endpoint addresses as NLB targets. The NLB routes traffic across the endpoints and provides networking reliability if an AZ is offline. Finally, configure the health checks to use the web console (TCP port 443).
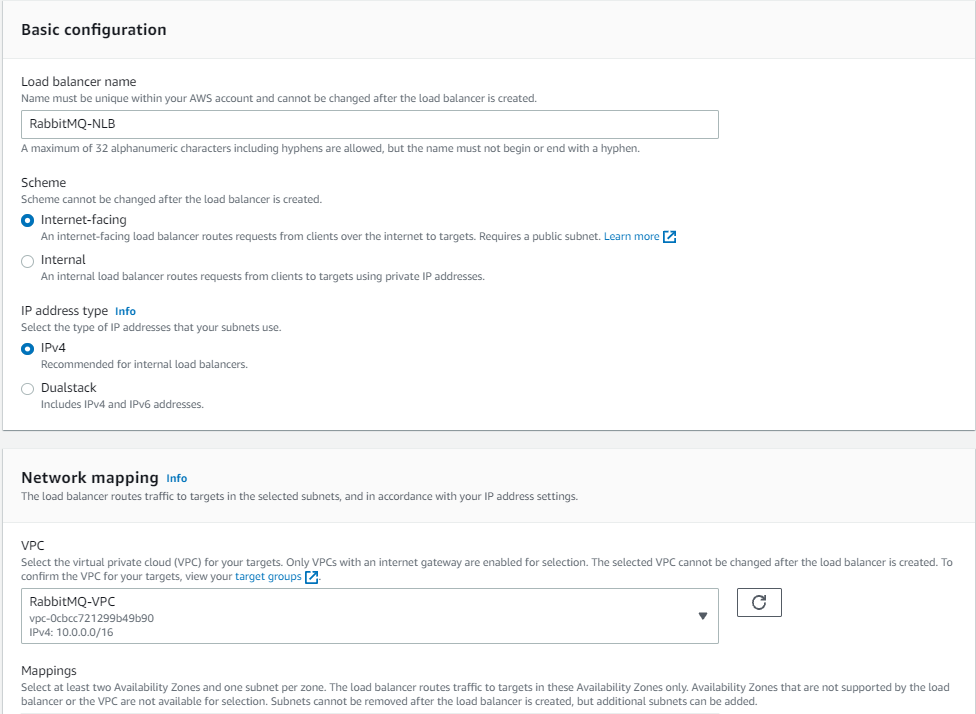
Creating a Network Load Balancer
Next, you create a Network Load Balancer. This is an internet-facing load balancer with TLS listeners on port 5671 (AMQP), routing traffic to the brokers’ VPC and private subnets. You select the target group you created, selecting TLS for the connection between the NLB and the brokers. To allow clients to connect to the NLB securely, select an ACM certificate for the subdomain registered in Route 53 (for example ‘mq.example.com’).
To learn about ACM certificate provisioning, read more about the process here. Make sure that the ACM certificate is provisioned in the same Region as the NLB or the certificate is not shown in the dropdown menu.
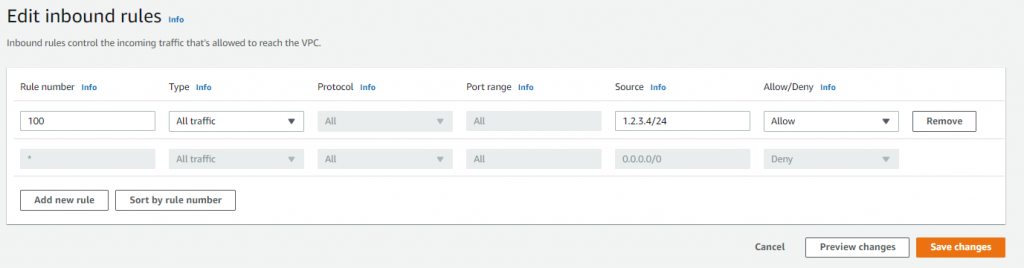
Optionally configure IP filtering
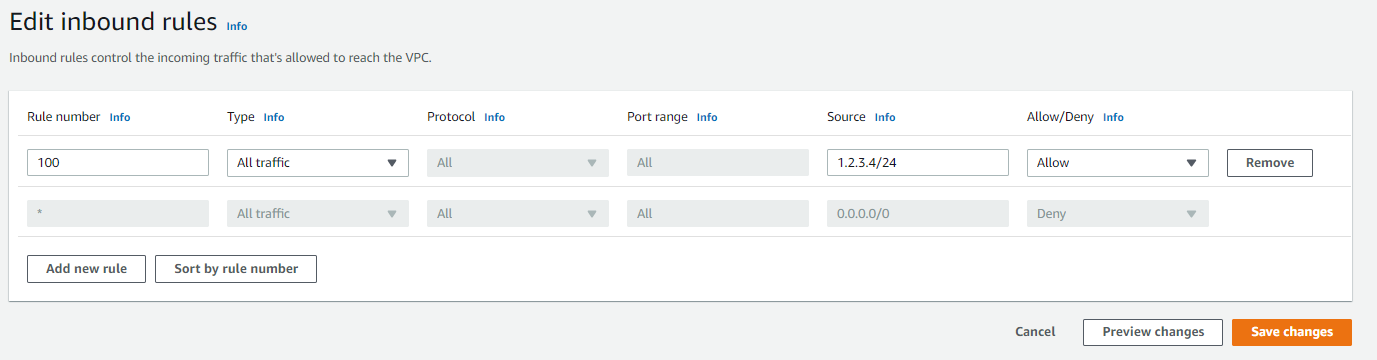
The NLB is globally accessible and this may be overly permissive for some workloads. You can restrict incoming traffic to specific IP ranges on the NLB’s public subnet by using network access control list (NACL) configuration:
- Navigate to the AWS Management Console to the VPC service and choose Subnets.
- Select your public subnet and then switch to the Network ACL tab.
- Select the link to the associated network ACL (e.g., acl-0d6fxxxxxxxx) details.
- Activate this item and choose Edit inbound rules in the Action menu.
- Specify the desired IP range and then choose Save changes.
Configuring Route 53
Finally, configure Route 53 to serve traffic at the subdomain of your choice to the NLB:
- Go to the Route 53 hosted zone and create a new subdomain record set, such as mq.example.com, that matches the ACM certificate that you previously created.
- In the “type” field, select “A – IPv4 address”, then select “Yes” for alias. This allows you to select the NLB as the alias target.
- Select from the alias target menu the NLB you just created and save the record set.
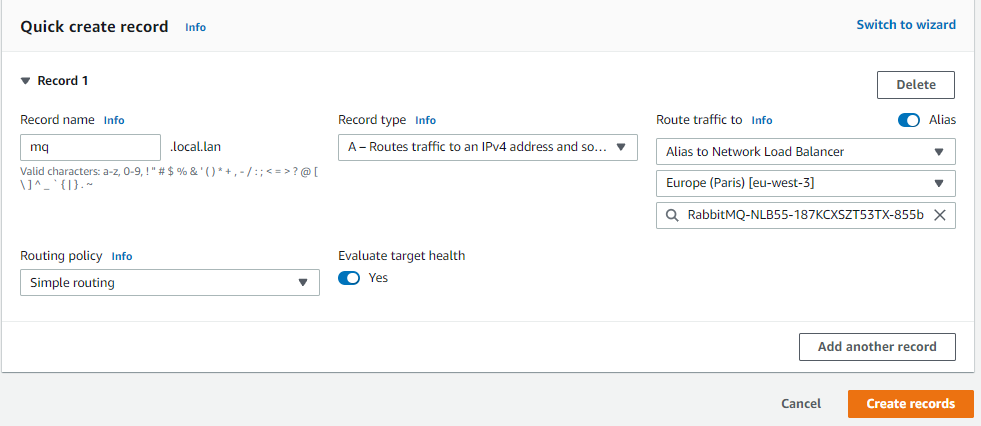
Now callers can use the friendly name in the RabbitMQ connection string. This capability improves the developer experience and reduces operational cost when rebuilding the cluster. Since you added multiple VPC endpoints (one per subnet) into the NLB’s target group, the solution has Multi-AZ redundancy.
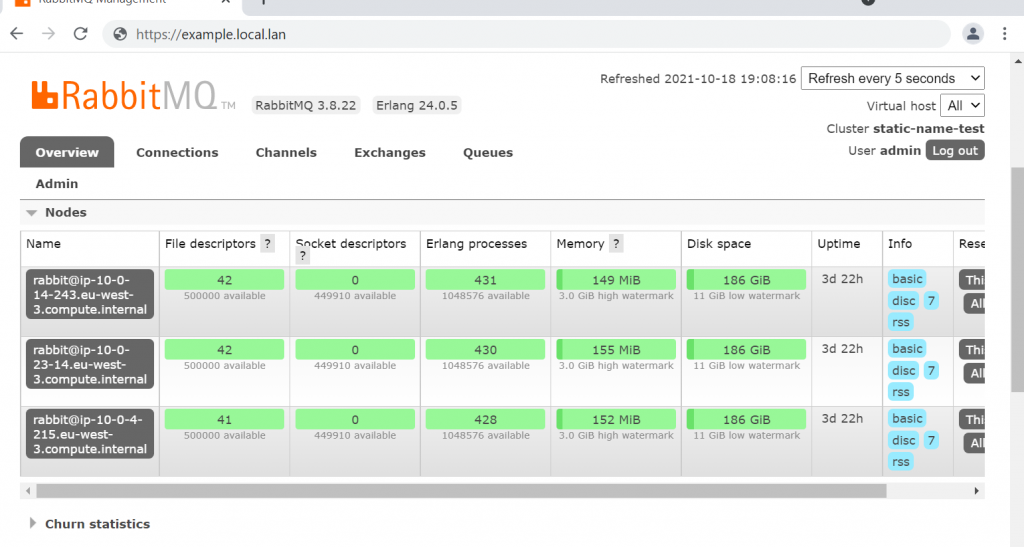
Testing with a RabbitMQ client process
The entire process can be tested using any RabbitMQ client process. One approach is to launch the official Docker image and connect with the native client. The service documentation also provides sample code for authenticating, publishing, and subscribing to RabbitMQ channels.
To log in to the broker’s RabbitMQ web console, there are three options. Due to the security group rules, only traffic originating from inside the VPC is allowed to the brokers:
- Use a VPN connection from your corporate network to the VPC. Many customers use this option but for rapid testing, there is a simpler and more cost-effective method.
- Connect to the brokers’ web console through your Route 53 subdomain, which requires creating a separate web console port listener (443) on the existing NLB and creating a separate TLS target group for the brokers.
- Use a bastion host to proxy traffic to the web console.
Conclusion
In this post, you build a highly available Amazon MQ broker in a private subnet. You layer security by placing the brokers behind a highly scalable Network Load Balancer. You configure routing from a single custom subdomain URL to multiple brokers with a built-in health check.
For more serverless learning resources, visit Serverless Land.
Implementing header-based API Gateway versioning with Amazon CloudFront
=======================
This post is written by Amir Khairalomoum, Sr. Solutions Architect.
In this blog post, I show you how to use Lambda@Edge feature of Amazon CloudFront to implement a header-based API versioning solution for Amazon API Gateway.
Amazon API Gateway is a fully managed service that makes it easier for developers to create, publish, maintain, monitor, and secure APIs at any scale. Amazon CloudFront is a global content delivery network (CDN) service built for high-speed, low-latency performance, security, and developer ease-of-use. Lambda@Edge is a feature of Amazon CloudFront, a compute service that lets you run functions that customize the content that CloudFront delivers.
The example uses the AWS SAM CLI to build, deploy, and test the solution on AWS. The AWS Serverless Application Model (AWS SAM) is an open-source framework that you can use to build serverless applications on AWS. The AWS SAM CLI lets you locally build, test, and debug your applications defined by AWS SAM templates. You can also use the AWS SAM CLI to deploy your applications to AWS, or create secure continuous integration and deployment (CI/CD) pipelines.
After an API becomes publicly available, it is used by customers. As a service evolves, its contract also evolves to reflect new changes and capabilities. It’s safe to evolve a public API by adding new features but it’s not safe to change or remove existing features.
Any breaking changes may impact consumer’s applications and break them at runtime. API versioning is important to avoid breaking backward compatibility and breaking a contract. You need a clear strategy for API versioning to help consumers adopt them.
Versioning APIs
Two of the most commonly used API versioning strategies are URI versioning and header-based versioning.
URI versioning
This strategy is the most straightforward and the most commonly used approach. In this type of versioning, versions are explicitly defined as part of API URIs. These example URLs show how domain name, path, or query string parameters can be used to specify a version:
https://api.example.com/v1/myservice
https://apiv1.example.com/myservice
https://api.example.com/myservice?v=1
To deploy an API in API Gateway, the deployment is associated with a stage. A stage is a logical reference to a lifecycle state of your API (for example, dev, prod, beta, v2). As your API evolves, you can continue to deploy it to different stages as different versions of the API.
Header-based versioning
This strategy is another commonly used versioning approach. It uses HTTP headers to specify the desired version. It uses the “Accept” header for content negotiation or uses a custom header (for example, “APIVER” to indicate a version):
Accept:application/vnd.example.v1+json
APIVER:v1
This approach allows you to preserve URIs between versions. As a result, you have a cleaner and more understandable set of URLs. It is also easier to add versioning after design. However, you may need to deal with complexity of returning different versions of your resources.
Overview of solution
The target architecture for the solution uses Lambda@Edge. It dynamically routes a request to the relevant API version, based on the provided header:
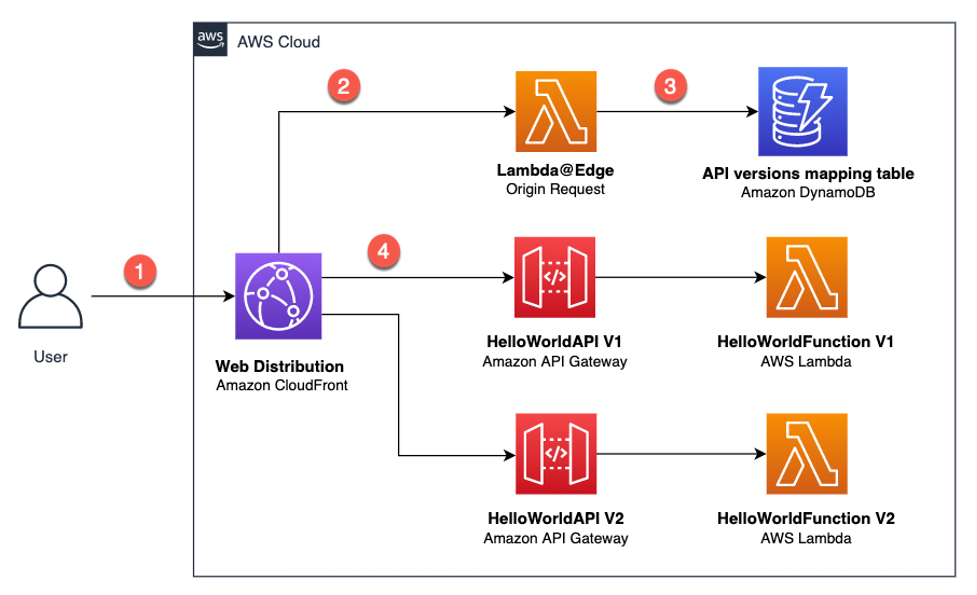
Architecture overview
In this architecture:
- The user sends a request with a relevant header, which can be either “Accept” or another custom header.
- This request reaches the CloudFront distribution and triggers the Lambda@Edge Origin Request.
- The Lambda@Edge function uses the provided header value and fetches data from an Amazon DynamoDB table. This table contains mappings for API versions. The function then modifies the Origin and the Host header of the request and returns it back to CloudFront.
- CloudFront sends the request to the relevant Amazon API Gateway URL.
In the next sections, I walk you through setting up the development environment and deploying and testing this solution.
Setting up the development environment
To deploy this solution on AWS, you use the AWS Cloud9 development environment.
- Go to the AWS Cloud9 web console. In the Region dropdown, make sure you’re using N. Virginia (us-east-1) Region.
- Select Create environment.
- On Step 1 – Name environment, enter a name for the environment, and choose Next step.
- On Step 2 – Configure settings, keep the existing environment settings.

Console view of configuration settings
- Choose Next step. Choose Create environment.
Deploying the solution
Now that the development environment is ready, you can proceed with the solution deployment. In this section, you download, build, and deploy a sample serverless application for the solution using AWS SAM.
Download the sample serverless application
The solution sample code is available on GitHub. Clone the repository and download the sample source code to your Cloud9 IDE environment by running the following command in the Cloud9 terminal window:
git clone https://github.com/aws-samples/amazon-api-gateway-header-based-versioning.git ./api-gateway-header-based-versioning
This sample includes:
template.yaml: Contains the AWS SAM template that defines your application’s AWS resources.
hello-world/: Contains the Lambda handler logic behind the API Gateway endpoints to return the hello world message.
edge-origin-request/: Contains the Lambda@Edge handler logic to query the API version mapping and modify the Origin and the Host header of the request.
init-db/: Contains the Lambda handler logic for a custom resource to populate sample DynamoDB table
Build your application
Run the following commands in order to first, change into the project directory, where the template.yaml file for the sample application is located then build your application:
cd ~/environment/api-gateway-header-based-versioning/
sam build
Output:
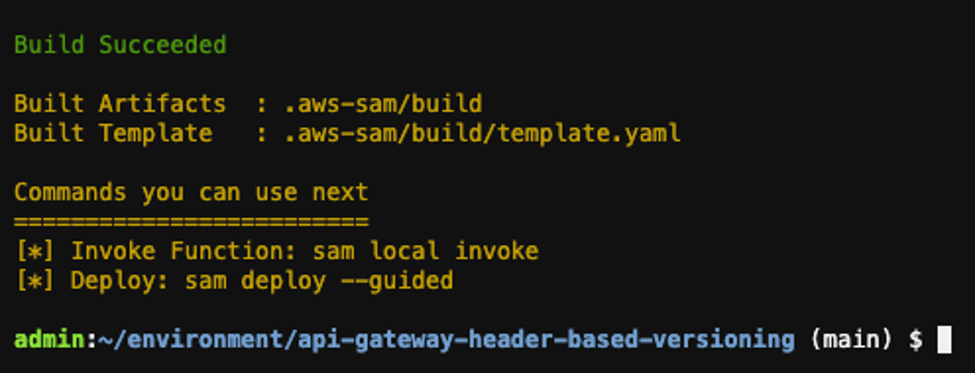
Build output
Deploy your application
Run the following command to deploy the application in guided mode for the first time then follow the on-screen prompts:
sam deploy --guided
Output:
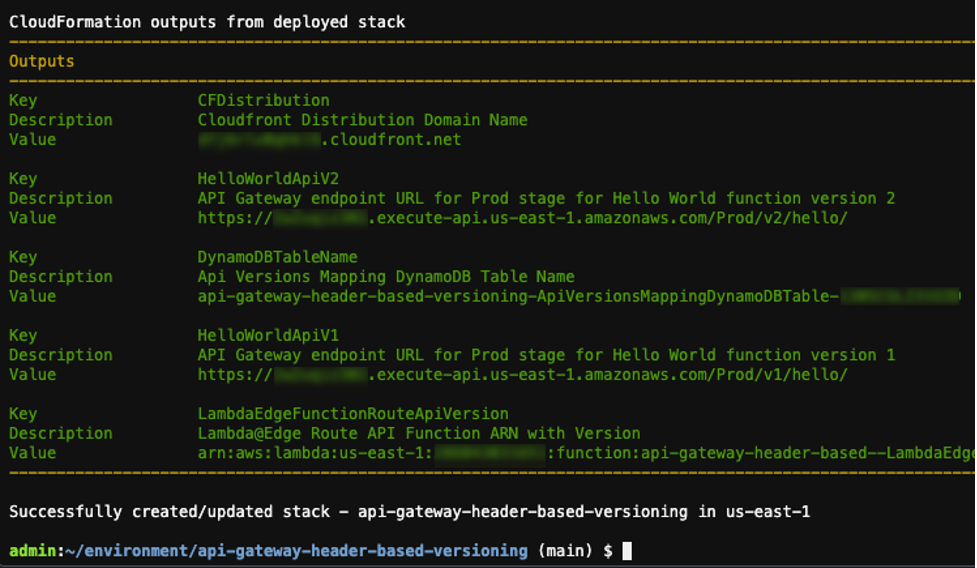
Deploy output
The output shows the deployment of the AWS CloudFormation stack.
Testing the solution
This application implements all required components for the solution. It consists of two Amazon API Gateway endpoints backed by AWS Lambda functions. The deployment process also initializes the API Version Mapping DynamoDB table with the values provided earlier in the deployment process.
Run the following commands to see the created mappings:
STACK_NAME=$(grep stack_name ~/environment/api-gateway-header-based-versioning/samconfig.toml | awk -F\= '{gsub(/"/, "", $2); gsub(/ /, "", $2); print $2}')
DDB_TBL_NAME=$(aws cloudformation describe-stacks --region us-east-1 --stack-name $STACK_NAME --query 'Stacks[0].Outputs[?OutputKey==`DynamoDBTableName`].OutputValue' --output text) && echo $DDB_TBL_NAME
aws dynamodb scan --table-name $DDB_TBL_NAME
Output:
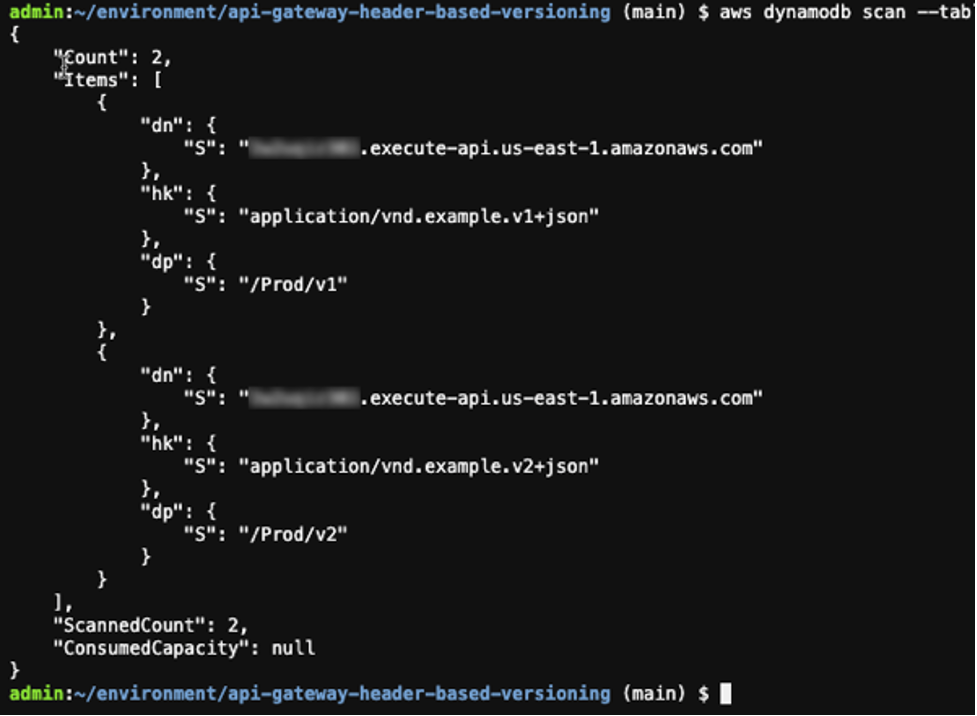
Table scan results
When a user sends a GET request to CloudFront, it routes the request to the relevant API Gateway endpoint version according to the provided header value. The Lambda function behind that API Gateway endpoint is invoked and returns a “hello world” message.
To send a request to the CloudFront distribution, which is created as part of the deployment process, first get its domain name from the deployed AWS CloudFormation stack:
CF_DISTRIBUTION=$(aws cloudformation describe-stacks --region us-east-1 --stack-name $STACK_NAME --query 'Stacks[0].Outputs[?OutputKey==`CFDistribution`].OutputValue' --output text) && echo $CF_DISTRIBUTION
Output:

Domain name results
You can now send a GET request along with the relevant header you specified during the deployment process to the CloudFront to test the application.
Run the following command to test the application for API version one. Note that if you entered a different value other than the default value provided during the deployment process, change the --header parameter to match your inputs:
curl -i -o - --silent -X GET "https://${CF_DISTRIBUTION}/hello" --header "Accept:application/vnd.example.v1+json" && echo
Output:

Curl results
The response shows that CloudFront successfully routed the request to the API Gateway v1 endpoint as defined in the mapping Amazon DynamoDB table. API Gateway v1 endpoint received the request. The Lambda function behind the API Gateway v1 was invoked and returned a “hello world” message.
Now you can change the header value to v2 and run the command again this time to test the API version two:
curl -i -o - --silent -X GET "https://${CF_DISTRIBUTION}/hello" --header "Accept:application/vnd.example.v2+json" && echo
Output:

Curl results after header change
The response shows that CloudFront routed the request to the API Gateway v2 endpoint as defined in the mapping DynamoDB table. API Gateway v2 endpoint received the request. The Lambda function behind the API Gateway v2 was invoked and returned a “hello world” message.
This solution requires valid a header value on each individual request, so the application checks and raises an error if the header is missing or the header value is not valid.
You can remove the header parameter and run the command to test this scenario:
curl -i -o - --silent -X GET "https://${CF_DISTRIBUTION}/hello" && echo
Output:
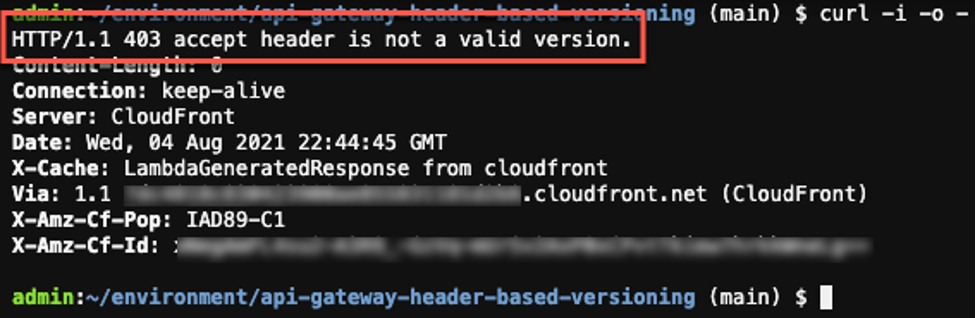
No header causes a 403 error
The response shows that Lambda@Edge validated the request and raised an error to inform us that the request did not have a valid header.
Mitigating latency
In this solution, Lambda@Edge reads the API version mappings data from the DynamoDB table. Accessing external data at the edge can cause additional latency to the request. In order to mitigate the latency, solution uses following methods:
- Cache data in Lambda@Edge memory: As data is unlikely to change across many Lambda@Edge invocations, Lambda@Edge caches API version mappings data in the memory for a certain period of time. It reduces latency by avoiding an external network call for each individual request.
- Use Amazon DynamoDB global table: It brings data closer to the CloudFront distribution and reduces external network call latency.
Cleaning up
To clean up the resources provisioned as part of the solution:
- Run following command to delete the deployed application:
sam delete
- Go to the AWS Cloud9 web console. Select the environment you created then choose Delete.
Conclusion
Header-based API versioning is a commonly used versioning strategy. This post shows how to use CloudFront to implement a header-based API versioning solution for API Gateway. It uses the AWS SAM CLI to build and deploy a sample serverless application to test the solution in the AWS Cloud.
To learn more about API Gateway, visit the API Gateway developer guide documentation, and for CloudFront, refer to Amazon CloudFront developer guide documentation.
For more serverless learning resources, visit Serverless Land.
Introducing cross-account Amazon ECR access for AWS Lambda
=======================
This post is written by Brian Zambrano, Enterprise Solutions Architect and Indranil Banerjee, Senior Solution Architect.
In December 2020, AWS announced support for packaging AWS Lambda functions using container images. Customers use the container image packaging format for workloads like machine learning inference made possible by the 10 GB container size increase and familiar container tooling.
Many customers use multiple AWS accounts for application development but centralize Amazon Elastic Container Registry (ECR) images to a single account. Until today, a Lambda function had to reside in the same AWS account as the ECR repository that owned the container image. Cross-account ECR access with AWS Lambda functions has been one of the most requested features since launch.
From today, you can now deploy Lambda functions that reference container images from an ECR repository in a different account within the same AWS Region.
Overview
The example demonstrates how to use the cross-account capability using two AWS example accounts:
- ECR repository owner: Account ID 111111111111
- Lambda function owner: Account ID 222222222222
The high-level process consists of the following steps:
- Create an ECR repository using Account 111111111111 that grants Account 222222222222 appropriate permissions to use the image
- Build a Lambda-compatible container image and push it to the ECR repository
- Deploy a Lambda function in account 222222222222 and reference the container image in the ECR repository from account 111111111111
This example uses the AWS Serverless Application Model (AWS SAM) to create the ECR repository and its repository permissions policy. AWS SAM provides an easier way to manage AWS resources with CloudFormation.
To build the container image and upload it to ECR, use Docker and the AWS Command Line Interface (CLI). To build and deploy a new Lambda function that references the ECR image, use AWS SAM. Find the example code for this project in the GitHub repository.
Create an ECR repository with a cross-account access policy
Using AWS SAM, I create a new ECR repository named cross-account-function in the us-east-1 Region with account 111111111111. In the template.yaml file, RepositoryPolicyText defines the permissions for the ECR Repository. This template grants account 222222222222 access so that a Lambda function in that account can reference images in the ECR repository:
AWSTemplateFormatVersion: '2010-09-09'
Transform: AWS::Serverless-2016-10-31
Description: SAM Template for cross-account-function ECR Repo
Resources:
HelloWorldRepo:
Type: AWS::ECR::Repository
Properties:
RepositoryName: cross-account-function
RepositoryPolicyText:
Version: "2012-10-17"
Statement:
- Sid: CrossAccountPermission
Effect: Allow
Action:
- ecr:BatchGetImage
- ecr:GetDownloadUrlForLayer
Principal:
AWS:
- arn:aws:iam::222222222222:root
- Sid: LambdaECRImageCrossAccountRetrievalPolicy
Effect: Allow
Action:
- ecr:BatchGetImage
- ecr:GetDownloadUrlForLayer
Principal:
Service: lambda.amazonaws.com
Condition:
StringLike:
aws:sourceArn:
- arn:aws:lambda:us-east-1:222222222222:function:*
Outputs:
ERCRepositoryUri:
Description: "ECR RepositoryUri which may be referenced by Lambda functions"
Value: !GetAtt HelloWorldRepo.RepositoryUri
The RepositoryPolicyText has two statements that are required for Lambda functions to work as expected:
- CrossAccountPermission – Allows account 222222222222 to create and update Lambda functions that reference this ECR repository
- LambdaECRImageCrossAccountRetrievalPolicy – Lambda eventually marks a function as INACTIVE when not invoked for an extended period. This statement is necessary so that Lambda service in account 222222222222 can pull the image again for optimization and caching.
To deploy this stack, run the following commands:
git clone https://github.com/aws-samples/lambda-cross-account-ecr.git
cd sam-ecr-repo
sam build

AWS SAM build results
sam deploy --guided

AWS SAM deploy results
Once AWS SAM deploys the stack, a new ECR repository named cross-account-function exists. The repository has a permissions policy that allows Lambda functions in account 222222222222 to access the container images. You can verify this in the ECR console for this repository:
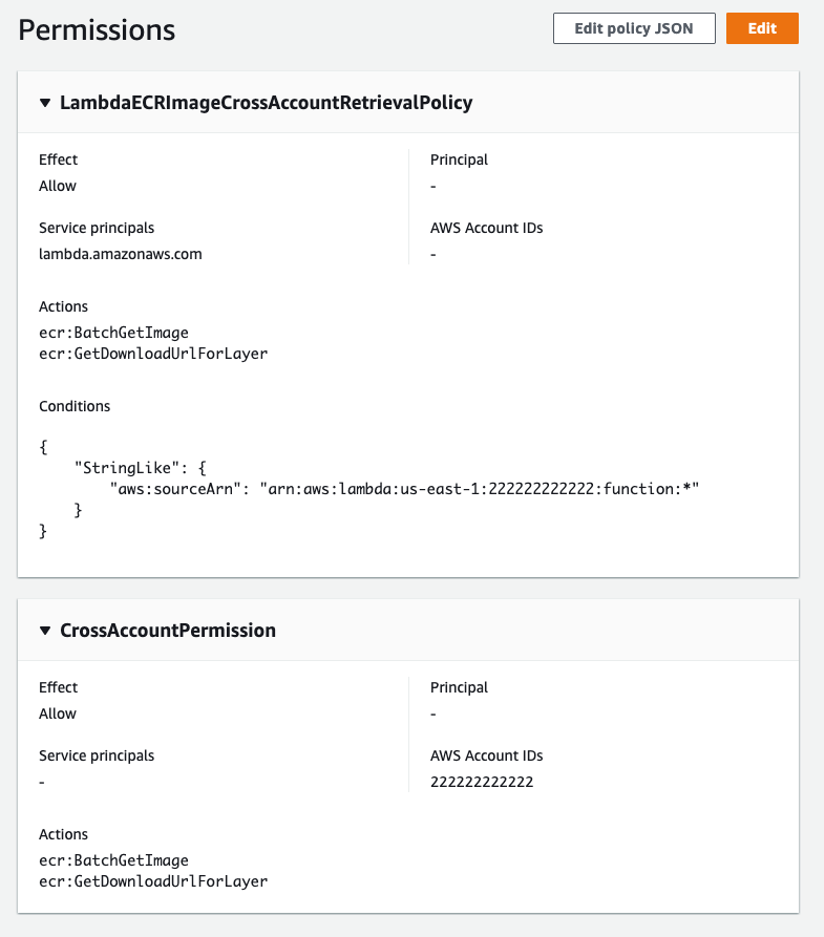
Permissions displayed in the console
You can also extend this policy to enable multiple accounts by adding additional account IDs to the Principal and Condition evaluations lists in the CrossAccountPermission and LambdaECRImageCrossAccountRetrievalPolicy permissions policy. Narrowing the ECR permission policy is a best practice. With this launch, if you are working with multiple accounts in an AWS Organization we recommend enumerating your account IDs in the ECR permissions policy.
Amazon ECR repository policies use a subset of IAM policies to control access to individual ECR repositories. Refer to the ECR repository policies documentation to learn more.
Build a Lambda-compatible container image
Next, you build a container image using Docker and the AWS CLI. For this step, you need Docker, a Dockerfile, and Python code that responds to Lambda invocations.
- Use the AWS-maintained Python 3.9 container image as the basis for the Dockerfile:
FROM public.ecr.aws/lambda/python:3.9
COPY app.py ${LAMBDA_TASK_ROOT}
CMD ["app.handler"]
The code for this example, in app.py, is a Hello World application.
import json
def handler(event, context):
return {
"statusCode": 200,
"body": json.dumps({"message": "hello world!"}),
}
- To build and tag the image and push it to ECR using the same name as the repository (cross-account-function) for the image name and 01 as the tag, run:
$ docker build -t cross-account-function:01 .
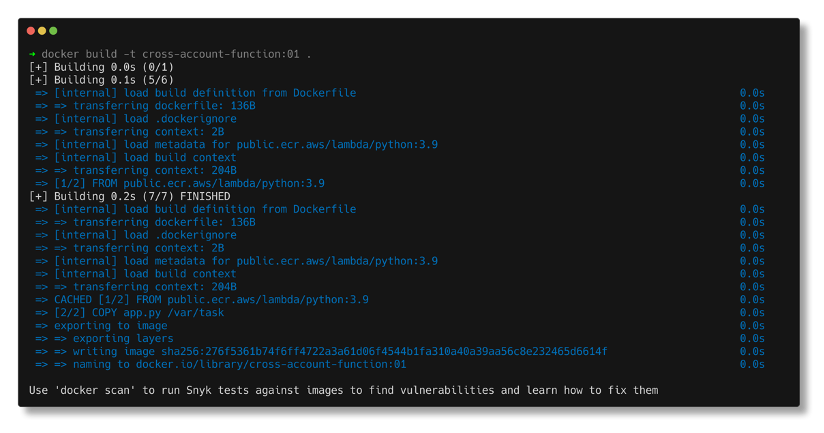
Docker build results
- Tag the image for upload to the ECR. The command parameters vary depending on the account id and Region. If you’re unfamiliar with the tagging steps for ECR, view the exact commands for your repository using the View push commands button from the ECR repository console page:
$ docker tag cross-account-function:01 111111111111.dkr.ecr.us-east-1.amazonaws.com/cross-account-function:01
- Log in to ECR and push the image:
$ aws ecr get-login-password --region us-east-1 | docker login --username AWS --password-stdin 111111111111.dkr.ecr.us-east-1.amazonaws.com
$ docker push 111111111111.dkr.ecr.us-east-1.amazonaws.com/cross-account-function:01
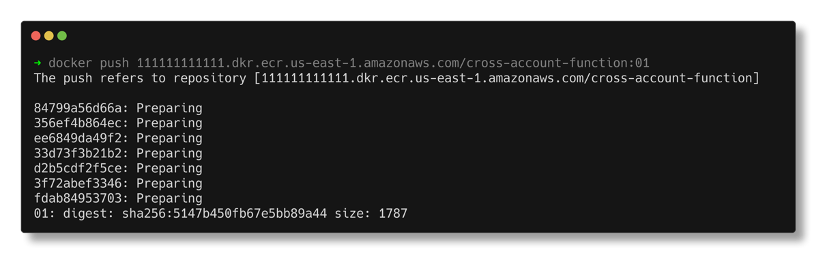
Docker push results
Deploying a Lambda Function
The last step is to build and deploy a new Lambda function in account 222222222222. The AWS SAM template below, saved to a file named template.yaml, references the ECR image for the Lambda function’s ImageUri. This template also instructs AWS SAM to create an Amazon API Gateway REST endpoint integrating the Lambda function.
AWSTemplateFormatVersion: '2010-09-09'
Transform: AWS::Serverless-2016-10-31
Description: Sample SAM Template for sam-ecr-cross-account-demo
Globals:
Function:
Timeout: 3
Resources:
HelloWorldFunction:
Type: AWS::Serverless::Function
Properties:
PackageType: Image
ImageUri: 111111111111.dkr.ecr.us-east-1.amazonaws.com/cross-account-function:01
Architectures:
- x86_64
Events:
HelloWorld:
Type: Api
Properties:
Path: /hello
Method: get
Outputs:
HelloWorldApi:
Description: "API Gateway endpoint URL for Prod stage for Hello World function"
Value: !Sub "https://${ServerlessRestApi}.execute-api.${AWS::Region}.amazonaws.com/Prod/hello/"
Use AWS SAM to deploy this template:
cd ../sam-cross-account-lambda
sam build
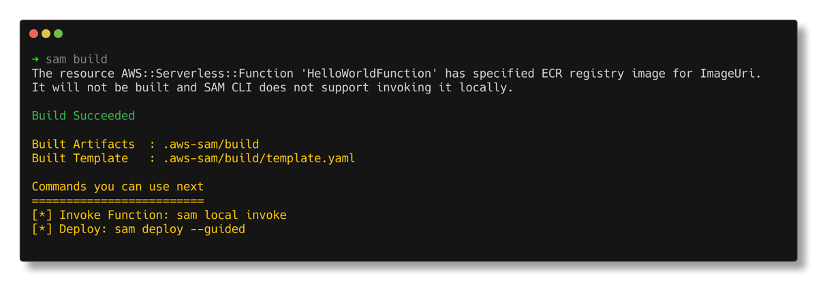
AWS SAM build results
sam deploy --guided

SAM deploy results
Now that the Lambda function is deployed, test using the API Gateway endpoint that AWS SAM created:

Testing the endpoint
Because it references a container image with the ImageUri parameter in the AWS SAM template, subsequent deployments must use the –resolve-image-repos parameter:
sam deploy --resolve-image-repos
Conclusion
This post demonstrates how to create a Lambda-compatible container image in one account and reference it from a Lambda function in another account. It shows an example of an ECR policy to enable cross-account functionality. It also shows how to use AWS SAM to deploy container-based functions using the ImageUri parameter.
To learn more about serverless and AWS SAM, visit the Sessions with SAM series and find more resources at Serverless Land.
#ServerlessForEveryone
Choosing between storage mechanisms for ML inferencing with AWS Lambda
=======================
This post is written by Veda Raman, SA Serverless, Casey Gerena, Sr Lab Engineer, Dan Fox, Principal Serverless SA.
For real-time machine learning inferencing, customers often have several machine learning models trained for specific use-cases. For each inference request, the model must be chosen dynamically based on the input parameters.
This blog post walks through the architecture of hosting multiple machine learning models using AWS Lambda as the compute platform. There is a CDK application that allows you to try these different architectures in your own account. Finally, it then discusses the different storage options for hosting the models and the benefits of each.
Overview
The serverless architecture for inferencing uses AWS Lambda and API Gateway. The machine learning models are stored either in Amazon S3 or Amazon EFS. Alternatively, they are part of the Lambda function deployed as a container image and stored in Amazon ECR.
All three approaches package and deploy the machine learning inference code as Lambda function along with the dependencies as a container image. More information on how to deploy Lambda functions as container images can be found here.
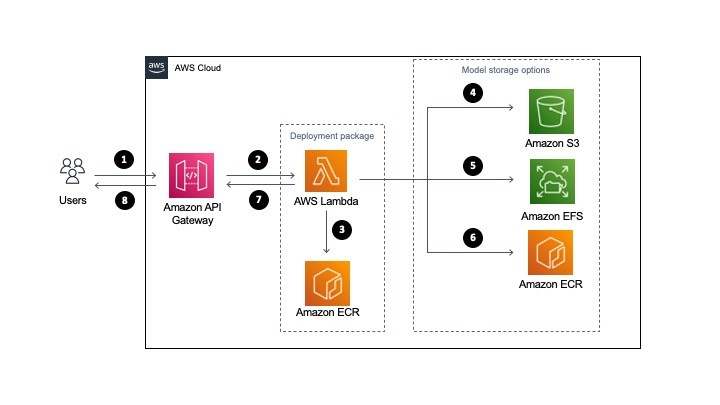
- A user sends a request to Amazon API Gateway requesting a machine learning inference.
- API Gateway receives the request and triggers Lambda function with the necessary data.
- Lambda loads the container image from Amazon ECR. This container image contains the inference code and business logic to run the machine learning model. However, it does not store the machine learning model (unless using the container hosted option, see step 6).
- Model storage option: For S3, when the Lambda function is triggered, it downloads the model files from S3 dynamically and performs the inference.
- Model storage option: For EFS, when the Lambda function is triggered, it accesses the models via the local mount path set in the Lambda file system configuration and performs the inference.
- Model storage option: If using the container hosted option, you must package the model in Amazon ECR with the application code defined for the Lambda function in step 3. The model runs in the same container as the application code. In this case, choosing the model happens at build-time as opposed to runtime.
- Lambda returns the inference prediction to API Gateway and then to the user.
The storage option you choose, either Amazon S3, Amazon EFS, or Amazon ECR via Lambda OCI deployment, to host the models influences the inference latency, cost of the infrastructure and DevOps deployment strategies.
Comparing single and multi-model inference architectures
There are two types of ML inferencing architectures, single model and multi-model. In single model architecture, you have a single ML inference model that performs the inference for all incoming requests. The model is stored either in S3, ECR (via OCI deployment with Lambda), or EFS and is then used by a compute service such as Lambda.
The key characteristic of a single model is that each has its own compute. This means that for every Lambda function there is a single model associated with it. It is a one-to-one relationship.
Multi-model inferencing architecture is where there are multiple models to be deployed and the model to perform the inference should be selected dynamically based on the type of request. So you may have four different models for a single application and you want a Lambda function to choose the appropriate model at invocation time. It is a many-to-one relationship.
Regardless of whether you use single or multi-model, the models must be stored in S3, EFS, or ECR via Lambda OCI deployments.
Should I load a model outside the Lambda handler or inside?
It is a general best practice in Lambda to load models and anything else that may take a longer time to process outside of the Lambda handler. For example, loading a third-party package dependency. This is due to cold start invocation times – for more information on performance, read this blog.
However, if you are running a multi-model inference, you may want to load inside the handler so you can load a model dynamically. This means you could potentially store 100 models in EFS and determine which model to load at the time of invocation of the Lambda function.
In these instances, it makes sense to load the model in the Lambda handler. This can increase the processing time of your function, since you are loading the model at the time of request.
Deploying the solution
The example application is open-sourced. It performs NLP question/answer inferencing using the HuggingFace BERT model using the PyTorch framework (expanding upon previous work found here). The inference code and the PyTorch framework are packaged as a container image and then uploaded to ECR and the Lambda service.
The solution has three stacks to deploy:
MlEfsStack – Stores the inference models inside of EFS and loads two models inside the Lambda handler, the model is chosen at invocation time.
MlS3Stack – Stores the inference model inside of S3 and loads a single model outside of the Lambda handler.
MlOciStack – Stores the inference models inside of the OCI container loads two models outside of the Lambda handler, the model is chosen at invocation time.
To deploy the solution, follow along the README file on GitHub.
Testing the solution
To test the solution, you can either send an inference request through API Gateway or invoke the Lambda function through the CLI. To send a request to the API, run the following command in a terminal (be sure to replace with your API endpoint and Region):
curl --location --request POST 'https://asdf.execute-api.us-east-1.amazonaws.com/develop/' --header 'Content-Type: application/json' --data-raw '{"model_type": "nlp1","question": "When was the car invented?","context": "Cars came into global use during the 20th century, and developed economies depend on them. The year 1886 is regarded as the birth year of the modern car when German inventor Karl Benz patented his Benz Patent-Motorwagen. Cars became widely available in the early 20th century. One of the first cars accessible to the masses was the 1908 Model T, an American car manufactured by the Ford Motor Company. Cars were rapidly adopted in the US, where they replaced animal-drawn carriages and carts, but took much longer to be accepted in Western Europe and other parts of the world."}'
General recommendations for model storage
For single model architectures, you should always load the ML model outside of the Lambda handler for increased performance on subsequent invocations after the initial cold start, this is true regardless of the model storage architecture that is chosen.
For multi-model architectures, if possible, load your model outside of the Lambda handler; however, if you have too many models to load in advance then load them inside of the Lambda handler. This means that a model will be loaded at every invocation of Lambda, increasing the duration of the Lambda function.
Recommendations for model hosting on S3
S3 is a good option if you need a simpler, low-cost storage option to store models. S3 is recommended when you cannot predict your application traffic volume for inference.
Additionally, if you must retrain the model, you can upload the retrained model to the S3 bucket without redeploying the Lambda function.
Recommendations for model hosting on EFS
EFS is a good option if you have a latency-sensitive workload for inference or you are already using EFS in your environment for other machine learning related activities (for example, training or data preparation).
With EFS, you must VPC-enable the Lambda function to mount the EFS filesystem, which requires an additional configuration.
For EFS, it’s recommended that you perform throughput testing with both EFS burst mode and provisioned throughput modes. Depending on inference request traffic volume, if the burst mode is not able to provide the desired performance, you must provision throughput for EFS. See the EFS burst throughput documentation for more information.
Recommendations for container hosted models
This is the simplest approach since all the models are available in the container image uploaded to Lambda. This also has the lowest latency since you are not downloading models from external storage.
However, it requires that all the models are packaged into the container image. If you have too many models that cannot fit into the 10 GB of storage space in the container image, then this is not a viable option.
One drawback of this approach is that anytime a model changes, you must re-package the models with the inference Lambda function code.
This approach is recommended if your models can fit in the 10 GB limit for container images and you are not re-training models frequently.
Cleaning up
To clean up resources created by the CDK templates, run “cdk destroy <StackName>”
Conclusion
Using a serverless architecture for real-time inference can scale your application for any volume of traffic while removing the operational burden of managing your own infrastructure.
In this post, we looked at the serverless architecture that can be used to perform real-time machine learning inference. We then discussed single and multi-model architectures and how to load the models in the Lambda function. We then looked at the different storage mechanisms available to host the machine learning models. We compared S3, EFS, and container hosting for storing models and provided our recommendations of when to use each.
For more learning resources on serverless, visit Serverless Land.
Deep Dive on Amazon EC2 VT1 Instances
=======================
This post is written by: Amr Ragab, Senior Solutions Architect; Bryan Samis, Principal Elemental SSA; Leif Reinert, Senior Product Manager
Introduction
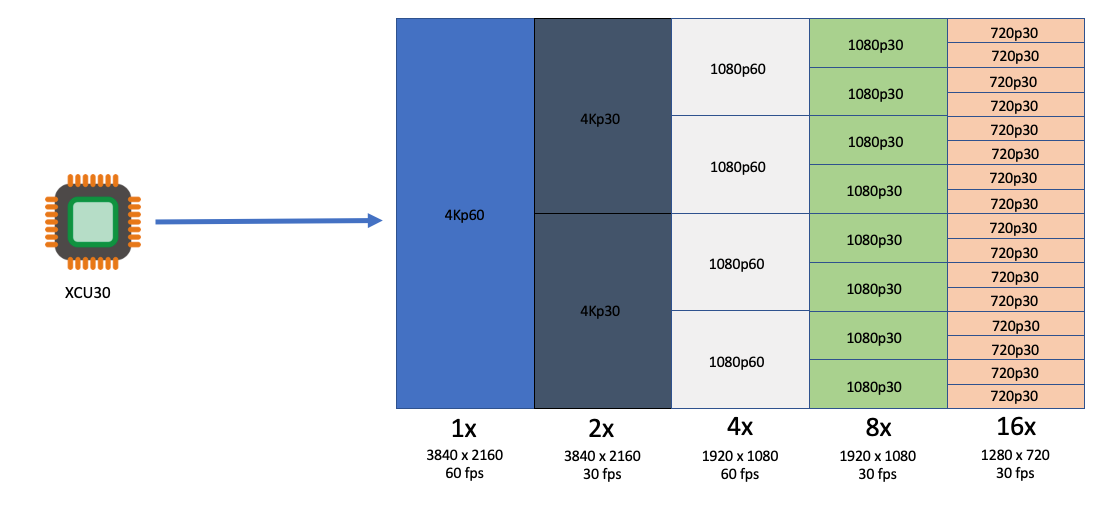
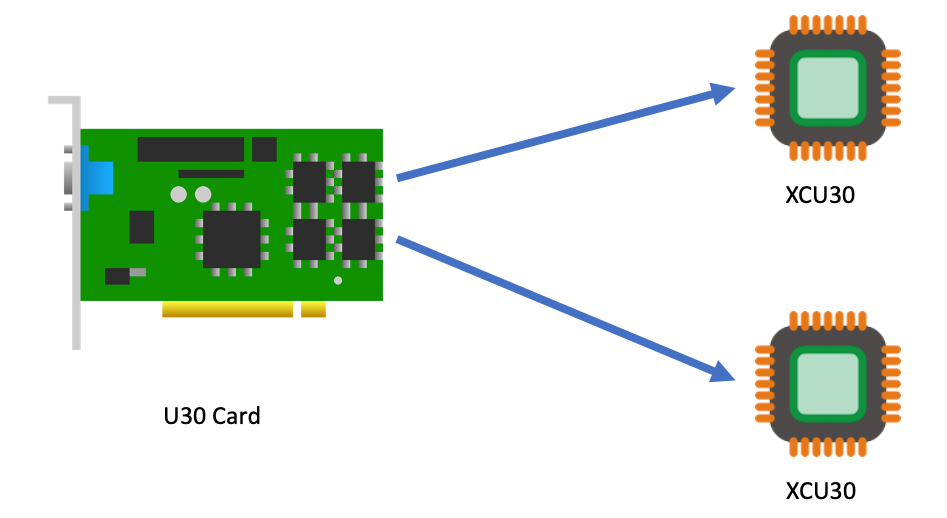
We at AWS are excited to announce that new Amazon Elastic Compute Cloud (Amazon EC2) VT1 instances are now generally available in the US-East (N. Virginia), US-West (Oregon), Europe (Ireland), and Asia Pacific (Tokyo) Regions. This instance family provides dedicated video transcoding hardware in Amazon EC2 and offers up to 30% lower cost per stream as compared to G4dn GPU based instances or 60% lower cost per stream as compared to C5 CPU based instances. These instances are powered by Xilinx Alveo U30 media accelerators with up to eight U30 media accelerators per instance in the vt1.24xlarge. Each U30 accelerator comes with two XCU30 Zynq UltraScale+ SoCs, totaling 16 addressable devices in the vt1.24xlarge instance with H.264/H.265 Video Codec Units (VCU) cores.
Currently, the VT1 family consists of three sizes, as summarized in the following:
| Instance Type |
vCPUs |
RAM |
U30 accelerator cards |
Addressable XCU30 SoCs |
| vt1.3xlarge |
12 |
24 |
1 |
2 |
| vt1.6xlarge |
24 |
48 |
2 |
8 |
| vt1.24xlarge |
96 |
182 |
8 |
16 |
Each addressable XCU30 SoC device supports:
Codec: MPEG4 Part 10 H.264, MPEG-H Part 2 HEVC H.265
Resolutions: 128×128 to 3840×2160
Flexible rate control: Constant Bitrate (CBR), Variable Bitrate(VBR), and Constant Quantization Parameter(QP)
Frame Scan Types: Progressive H.264/H.265
Input Color Space: YCbCr 4:2:0, 8-bit per color channel.
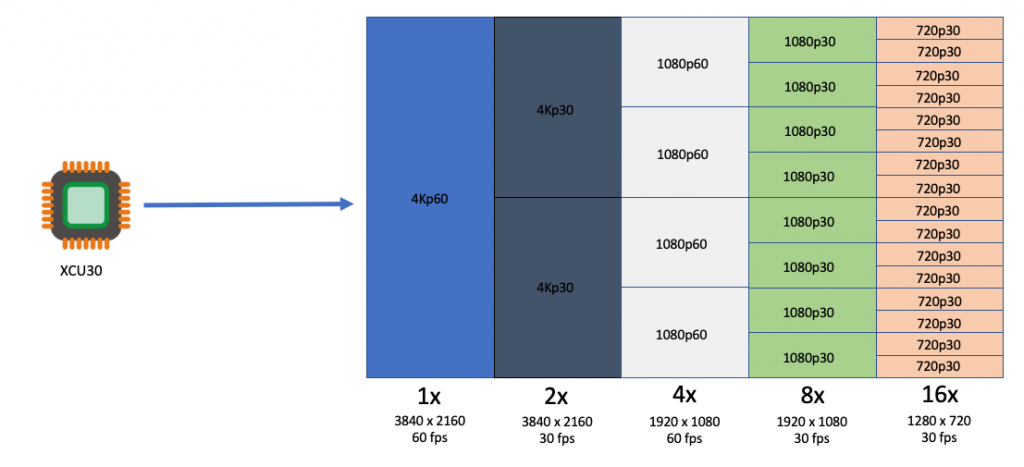
The following table outlines the number of transcoding streams per addressable device and instance type:
| Transcoding |
Each XCU30 SoC |
vt1.3xlarge |
vt1.6xlarge |
vt1.24xlarge |
| 3840x2160p60 |
1 |
2 |
4 |
16 |
| 3840x2160p30 |
2 |
4 |
8 |
32 |
| 1920x1080p60 |
4 |
8 |
16 |
64 |
| 1920x1080p30 |
8 |
16 |
32 |
128 |
| 1280x720p30 |
16 |
32 |
64 |
256 |
| 960x540p30 |
24 |
48 |
92 |
384 |
Customers with applications such as live broadcast, video conferencing and just-in-time transcoding can now benefit from a dedicated instance family devoted to video encoding and decoding with rescaling optimizations at the lowest cost per stream. This dedicated instance family lets customers run batch, real-time, and faster than real-time transcoding workloads.
Deployment and Quick Start
To get started, you launch a VT1 instance with prebuilt VT1 Amazon Machine Images (AMIs), available on the AWS Marketplace. However, if you have AMI hardening requirements or other requirements that require you to install the Xilinx software stack, you can reference the Xilinx Video SDK documentation for VT1.
The software stack utilizes a driver suite that is a combination of the driver stack as well as management and client tools. The following terminology will be used in this instance family:
XRT – Xilinx Runtime Library
XRM – Xilinx Runtime Management Library
XCDR – Xilinx Video Transcoding SDK
XMA – Xilinx Media Accelerator API and Samples
XOCL – Xilinx driver (xocl)
To run workloads directly on Amazon EC2 instances, you must load both the XRT and XRM stack. These are conveniently provided by loading the XCDR environment. To load the devices, run the following:
source /opt/xilinx/xcdr/setup.sh
With the output:
-----Source Xilinx U30 setup files-----
XILINX_XRT : /opt/xilinx/xrt
PATH : /opt/xilinx/xrt/bin:/usr/local/sbin:/sbin:/bin:/usr/sbin:/usr/bin:/root/bin
LD_LIBRARY_PATH : /opt/xilinx/xrt/lib:
PYTHONPATH : /opt/xilinx/xrt/python:
XILINX_XRM : /opt/xilinx/xrm
PATH : /opt/xilinx/xrm/bin:/opt/xilinx/xrt/bin:/usr/local/sbin:/sbin:/bin:/usr/sbin:/usr/bin:/root/bin
LD_LIBRARY_PATH : /opt/xilinx/xrm/lib:/opt/xilinx/xrt/lib:
Number of U30 devices found : 16
Running Containerized Workloads on Amazon ECS and Amazon EKS
To help build AMIs for Amazon Linux2, Ubuntu 18/20, Amazon ECS and Amazon Elastic Kubernetes Service (Amazon EKS), we have provided a Github project in order to simplify the build process utilizing Packer:
https://github.com/aws-samples/aws-vt-baseami-pipeline
At the time of writing, Xilinx does not have an officially supported container runtime. However, it is possible to pass the specific devices in the docker run ... stanza, and in order to set this environment download this specific script. The following example is the output for vt1.24xlarge:
[ec2-user@ip-10-0-254-236 ~]$ source xilinx_aws_docker_setup.sh
XILINX_XRT : /opt/xilinx/xrt
PATH : /opt/xilinx/xrt/bin:/usr/local/bin:/usr/bin:/usr/local/sbin:/usr/sbin:/home/ec2-user/.local/bin:/home/ec2-user/bin
LD_LIBRARY_PATH : /opt/xilinx/xrt/lib:
PYTHONPATH : /opt/xilinx/xrt/python:
XILINX_AWS_DOCKER_DEVICES : --device=/dev/dri/renderD128:/dev/dri/renderD128
--device=/dev/dri/renderD129:/dev/dri/renderD129
--device=/dev/dri/renderD130:/dev/dri/renderD130
--device=/dev/dri/renderD131:/dev/dri/renderD131
--device=/dev/dri/renderD132:/dev/dri/renderD132
--device=/dev/dri/renderD133:/dev/dri/renderD133
--device=/dev/dri/renderD134:/dev/dri/renderD134
--device=/dev/dri/renderD135:/dev/dri/renderD135
--device=/dev/dri/renderD136:/dev/dri/renderD136
--device=/dev/dri/renderD137:/dev/dri/renderD137
--device=/dev/dri/renderD138:/dev/dri/renderD138
--device=/dev/dri/renderD139:/dev/dri/renderD139
--device=/dev/dri/renderD140:/dev/dri/renderD140
--device=/dev/dri/renderD141:/dev/dri/renderD141
--device=/dev/dri/renderD142:/dev/dri/renderD142
--device=/dev/dri/renderD143:/dev/dri/renderD143
--mount type=bind,source=/sys/bus/pci/devices/0000:00:1d.0,target=/sys/bus/pci/devices/0000:00:1d.0 --mount type=bind,source=/sys/bus/pci/devices/0000:00:1e.0,target=/sys/bus/pci/devices/0000:00:1e.0
Once the devices have been enumerated, start the workload by running:
docker run -it $XILINX_AWS_DOCKER_DEVICES <image:tag>
Amazon EKS Setup
To launch an EKS cluster with VT1 instances, create the AMI from the scripts provided in the repo earlier.
https://github.com/aws-samples/aws-vt-baseami-pipeline
Once the AMI is created, launch an EKS cluster:
eksctl create cluster --region us-east-1 --without-nodegroup --version 1.19 \
--zones us-east-1c,us-east-1d
Once the cluster is created, substitute the values for the cluster name, subnets, and AMI IDs in the following template.
apiVersion: eksctl.io/v1alpha5
kind: ClusterConfig
metadata:
name: <cluster-name>
region: us-east-1
vpc:
id: vpc-285eb355
subnets:
public:
endpoint-one:
id: subnet-5163b237
endpoint-two:
id: subnet-baff22e5
managedNodeGroups:
- name: vt1-ng-1d
instanceType: vt1.3xlarge
volumeSize: 200
instancePrefix: vt1-ng-1d-worker
ami: <ami-id>
iam:
withAddonPolicies:
imageBuilder: true
autoScaler: true
ebs: true
fsx: true
cloudWatch: true
ssh:
allow: true
publicKeyName: amrragab-aws
subnets:
- endpoint-one
minSize: 1
desiredCapacity: 1
maxSize: 4
overrideBootstrapCommand: |
#!/bin/bash
/etc/eks/bootstrap.sh <cluster-name>
Save this file, and then deploy the nodegroup.
eksctl create nodegroup -f vt1-managed-ng.yaml
Once deployed, apply the FPGA U30 device plugin. The daemonset container is available on the Amazon Elastic Container Registry (ECR) public gallery. You can also access the daemonset deployment file.
kubectl apply -f xilinx-device-plugin.yml
Confirm that the Xilinx U30 device(s) are seen by K8s API server and can be allocatable in your job.
Capacity:
attachable-volumes-aws-ebs: 39
cpu: 12
ephemeral-storage: 209702892Ki
hugepages-1Gi: 0
hugepages-2Mi: 0
memory: 23079768Ki
pods: 15
xilinx.com/fpga-xilinx_u30_gen3x4_base_1-0: 1
Allocatable:
attachable-volumes-aws-ebs: 39
cpu: 11900m
ephemeral-storage: 192188443124
hugepages-1Gi: 0
hugepages-2Mi: 0
memory: 22547288Ki
pods: 15
xilinx.com/fpga-xilinx_u30_gen3x4_base_1-0: 1
Video Quality Analysis
The video quality produced by the U30 is roughly equivalent to the “faster” profile in the x264 and x265 codecs, or the “p4” preset using the nvenc codec on G4dn. For example, in the following test we encoded the same UHD (4K) video at multiple bitrates into H264, and then compared Video Multimethod Assessment Fusion (VMAF) scores:
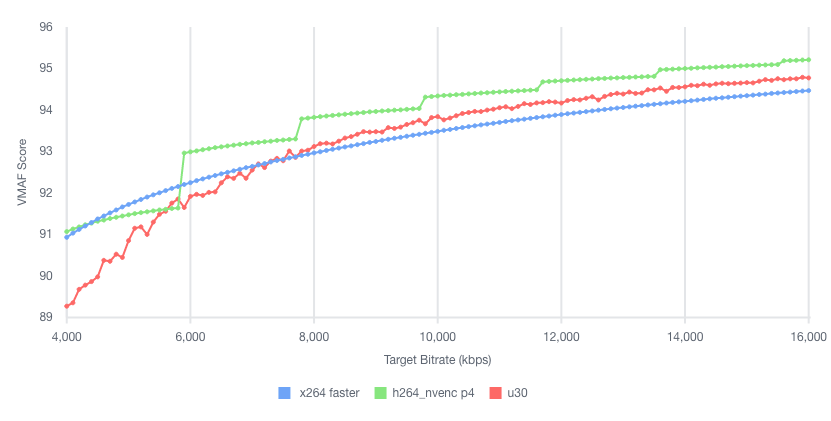
Stream Density and Encoding Performance
To illustrate the VT1 instance family stream density and encoding performance, let’s look at the smallest instance, the vt1.3xlarge, which can encode up to eight simultaneous 1080p60 streams into H.264. We chose a set of similar instances at a close price point, and then compared how many 1080p60 H264 streams they could encode simultaneously to an equivalent quality:
| Column 1 |
Column 2 |
Column 3 |
Column 4 |
Column 5 |
| Instance |
Codec |
us-east-1 Hourly Price* |
1080p60 Streams / Instance |
Hourly Cost / Stream |
| c5.4xlarge |
x264 |
$0.680 |
2 |
$0.340 |
| c6g.4xlarge |
x264 |
$0.544 |
2 |
$0.272 |
| c5a.4xlarge |
x264 |
$0.616 |
3 |
$0.205 |
| g4dn.xlarge |
nvenc |
$0.526 |
4 |
$0.132 |
| vt1.3xlarge |
xma |
$0.650 |
8 |
$0.081 |
* Prices accurate as of the publishing date of this article.
As you can see, the vt1.3xlarge instance can encode four times as many streams as the c5.4xlarge, and at a lower hourly cost. It can also encode two times the number of streams as a g4dn.xlarge instance. Thus, yielding in this example a cost per stream reduction of up to 76% over c5.4xlarge, and up to 39% compared to g4dn.xlarge.
Faster than Real-time Transcoding
In addition to encoding multiple live streams in parallel, VT1 instances can also be utilized to encode file-based content at faster-than-real-time performance. This can be done by over-provisioning resources on a single XCU30 device so that more resources are dedicated to transcoding than are necessary to maintain real-time.
For example, running the following command (specifying -cores 4) will utilize all resources on a single XCU30 device, and yield an encode speed of approximately 177 FPS, or 2.95 times faster than real-time for a 60 FPS source:
$ ffmpeg -c:v mpsoc_vcu_b64 -i input_1920x1080p60_H264_8Mbps_AAC_Stereo.mp4 -f mp4 -b:v 5M -c:v mpsoc_vcu_b64 -cores 4 -slices 4 -y /tmp/out.mp4
frame=43092 fps=177 q=-0.0 Lsize= 402721kB time=00:11:58.92 bitrate=4588.9kbits/s speed=2.95x
To maximize FPS further, utilize the “split and stitch” operation to break the input file into segments, and then transcode those in parallel across multiple XCU30 chips or even multiple U30 cards in an instance. Then, recombine the file at the output. For more information, see the Xilinx Video SDK documentation on Faster than Real-time transcoding.
Using the provided example script on the same 12-minute source file as the preceding example on a vt1.3xlarge, we can utilize both addressable devices on the U30 card at once in order to yield an effective encode speed of 512 fps, or 8.5 times faster than real-time.
$ python3 13_ffmpeg_transcode_only_split_stitch.py -s input_1920x1080p60_H264_8Mbps_AAC_Stereo.mp4 -d /tmp/out.mp4 -i b64 -o b64 -b 5.0
There are 1 cards, 2 chips in the system
...
Time from start to completion : 84 seconds (1 minute and 24 seconds)
This clip was processed 8.5 times faster than realtime
This clip was effectively processed at 512.34 FPS
Conclusion
We are excited to launch VT1, our first EC2 instance with dedicated hardware acceleration for video transcoding, which provides up to 30% lower cost per stream as compared to G4dn or 60% lower cost per stream as compared to C5. With up to eight Xilinx Alveo U30 media accelerators, you can parallelize up to 16 4K UHD streams, for batch, real-time, and faster than real-time transcoding. If you have any questions, reach out to your account team. Now, go power up your video transcoding workloads with Amazon EC2 VT1 instances.
Building ARM64 applications on AWS Graviton2 using the AWS CDK and Self-Hosted Runners for GitHub Actions
=======================
This post is written by Frank Dallezotte, Sr. Technical Account Manager, and Maxwell Moon, Sr. Solutions Architect
AWS Graviton2 processors are custom built by AWS using the 64-bit Arm Neoverse cores to deliver great price performance for workloads running in Amazon Elastic Compute Cloud (Amazon EC2). These instances are powered by 64 physical core AWS Graviton2 processors utilizing 64-bit Arm Neoverse N1 cores and custom silicon designed by AWS, built using advanced 7-nanometer manufacturing technology.
Customers are migrating their applications to AWS Graviton2 based instance families in order to take advantage of up to 40% better price performance over comparable current generation x86-based instances for a broad spectrum of workloads. This migration includes updating continuous integration and continuous deployment (CI/CD) pipelines in order to build applications for ARM64.
One option for running CI/CD workflows is GitHub Actions, a GitHub product that lets you automate tasks within your software development lifecycle. Customers utilizing GitHub Actions today can host their own runners and customize the environment used to run jobs in GitHub Actions workflows, allowing you to build ARM64 applications. GitHub recommends that you only use self-hosted runners with private repositories.
This post will teach you to set up an AWS Graviton2 instance as a self-hosted runner for GitHub Actions. We will verify the runner is added to the default runner group for a GitHub Organization, which can only be used by private repositories by default. Then, we’ll walk through setting up a continuous integration workflow in GitHub Actions that runs on the self-hosted Graviton2 runner and hosted x86 runners.
Overview
This post will cover the following:
Network configurations for deploying a self-hosted runner on EC2.
Generating a GitHub token for a GitHub organization, and then storing the token and organization URL in AWS Systems Manager Parameter Store.
Configuring a self-hosted GitHub runner on EC2.
Deploying the network and EC2 resources by using the AWS Cloud Development Kit (AWS CDK).
Adding Graviton2 self-hosted runners to a workflow for GitHub Actions to an example Python application.
Running the workflow.
Prerequisites
- An AWS account with permissions to create the necessary resources.
- A GitHub account: This post assumes that you have the required permissions as a GitHub organization admin to configure your GitHub organization, as well as create workflows.
- Familiarity with the AWS Command Line Interface (AWS CLI).
- Access to AWS CloudShell.
- Access to an AWS account with administrator or PowerUser (or equivalent) AWS Identity and Access Management (IAM) role policies attached.
- Account capacity for two Elastic IPs for the NAT gateways.
- An IPv4 CIDR block for a new Virtual Private Cloud (VPC) that is created as part of the AWS CDK stack.
Security
We’ll be adding the self-hosted runner at the GitHub organization level. This makes the runner available for use by the private repositories belonging to the GitHub organization. When new runners are created for an organization, they are automatically assigned to the default self-hosted runner group, which, by default, cannot be utilized by public repositories.
You can verify that your self-hosted runner group is only available to private repositories by navigating to the Actions section of your GitHub Organization’s settings. Select the “Runner Groups” submenu then the Default runner group and confirm that “Allow public repositories” is not checked.
GitHub recommends only utilizing self-hosted runners with private repositories. Allowing self-hosted runners on public repositories and allowing workflows on public forks introduces a significant security risk. More information about the risks can be found in self-hosted runner security with public repositories.
In this post, we verified that for the default runner group, allowing public repositories is not enabled.
AWS CDK
To model and deploy our architecture, we use the AWS CDK. The AWS CDK lets us design components for a self-hosted runner that are customizable and shareable in several popular programming languages.
Our AWS CDK application is defined by two stacks (VPC and EC2) that we’ll use to create the networking resources and our self-hosted runner on EC2.
Network Configuration
This section will walk through the networking resources that the CDK stack will create in order to support this architecture. We are deploying our self-hosted runner in a private subnet. A NAT gateway in a public subnet lets the runner make requests to GitHub, but not direct access to the instance from the internet.
Virtual Private Cloud – Defines a VPC across two Availability Zones with an IPv4 CIDR block that you set.
Public Subnet – A NAT Gateway will be created in each public subnet for outbound traffic through the VPC’s internet gateway.
Private Subnet – Contains the EC2 instance for the self-hosted runner that routes internet bound traffic through a NAT gateway in the public subnet.
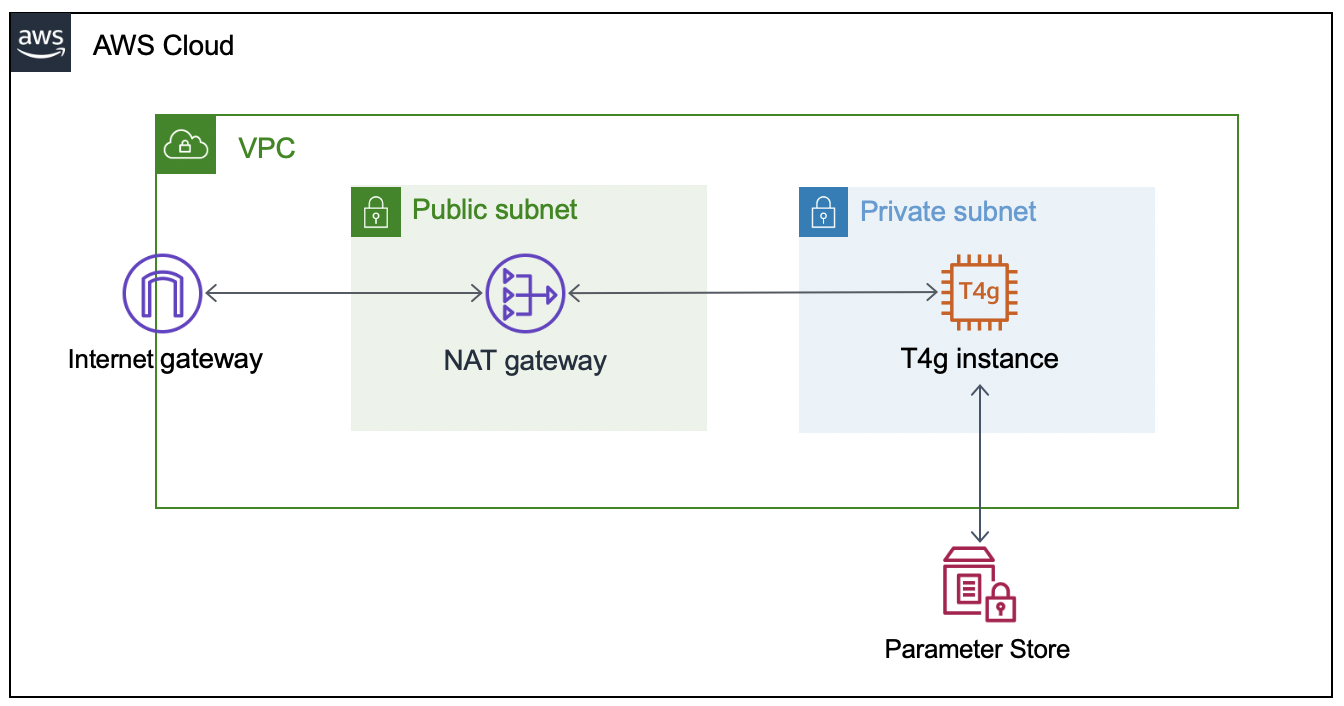
Configuring the GitHub Runner on EC2
To successfully provision the instance, we must supply the GitHub organization URL and token. To accomplish this, we’ll create two AWS Systems Manager Parameter Store values (gh-url and gh-token), which will be accessed via the EC2 instance user data script when the CDK application deploys the EC2 stack. The EC2 instance will only be accessible through AWS Systems Manager Session Manager.
Get a Token From GitHub
The following steps are based on these instructions for adding self-hosted runners – GitHub Docs.
- Navigate to the private GitHub organization where you’d like to configure a custom GitHub Action Runner.
- Under your repository name, organization, or enterprise, click Settings.
- In the left sidebar, click Actions, then click Runners.
- Under “Runners”, click Add runner.
- Copy the token value under the “Configure” section.
NOTE: this is an automatically generated time-limited token for authenticating the request.
Create the AWS Systems Manager Parameter Store Values
Next, launch an AWS CloudShell environment, and then create the following AWS Systems Manager Parameter Store values in the AWS account where you’ll be deploying the AWS CDK stack.
The names gh-url and gh-token, and types String and SecureString, respectively, are required for this integration:
#!/bin/bash
aws ssm put-parameter --name gh-token --type SecureString --value ABCDEFGHIJKLMNOPQRSTUVWXYZABC
aws ssm put-parameter --name gh-url --type String --value https://github.com/your-url
Self-Hosted Runner Configuration
The EC2 instance user data script will install all required packages, and it will register the GitHub Runner application using the gh-url and gh-token parameters from the AWS Systems Manager Parameter Store. These parameters are stored as variables (TOKEN and REPO) in order to configure the runner.
This script runs automatically when the EC2 instance is launched, and it is included in the GitHub repository. We’ll utilize Amazon Linux 2 for the operating system on the runner instance.
#!/bin/bash
yum update -y
# Download and build a recent version of International Components for Unicode.
# https://github.com/actions/runner/issues/629
# https://github.com/dotnet/core/blob/main/Documentation/linux-prereqs.md
# Install jq for parsing parameter store
yum install -y libicu60 jq
# Get the latest runner version
VERSION_FULL=$(curl -s https://api.github.com/repos/actions/runner/releases/latest | jq -r .tag_name)
RUNNER_VERSION="${VERSION_FULL:1}"
# Create a folder
mkdir /home/ec2-user/actions-runner && cd /home/ec2-user/actions-runner || exit
# Download the latest runner package
curl -o actions-runner-linux-arm64-${RUNNER_VERSION}.tar.gz -L https://GitHub.com/actions/runner/releases/download/v${RUNNER_VERSION}/actions-runner-linux-arm64-${RUNNER_VERSION}.tar.gz
# Extract the installer
tar xzf ./actions-runner-linux-arm64-${RUNNER_VERSION}.tar.gz
chown -R ec2-user /home/ec2-user/actions-runner
REGION=$(curl -s http://169.254.169.254/latest/meta-data/placement/region)
INSTANCE_ID=$(curl -s http://169.254.169.254/latest/meta-data/instance-id)
TOKEN=$(aws ssm get-parameter --region "${REGION}" --name gh-token --with-decryption | jq -r '.Parameter.Value')
REPO=$(aws ssm get-parameter --region "${REGION}" --name gh-url | jq -r '.Parameter.Value')
sudo -i -u ec2-user bash << EOF
/home/ec2-user/actions-runner/config.sh --url "${REPO}" --token "${TOKEN}" --name gh-g2-runner-"${INSTANCE_ID}" --work /home/ec2-user/actions-runner --unattended
EOF
./svc.sh install
./svc.sh start
Deploying the Network Resources and Self-Hosted Runner
In this section, we’ll deploy the network resources and EC2 instance for the self-hosted GitHub runner using the AWS CDK.
From the same CloudShell environment, run the following commands in order to deploy the AWS CDK application:
#!/bin/bash
sudo npm install aws-cdk -g
git clone https://github.com/aws-samples/cdk-graviton2-gh-sh-runner.git
cd cdk-graviton2-gh-sh-runner
python3 -m venv .venv
source .venv/bin/activate
python -m pip install -r requirements.txt
export VPC_CIDR="192.168.0.0/24" # Set your CIDR here.
export AWS_ACCOUNT=`aws sts get-caller-identity | jq -r '.Account'`
cdk bootstrap aws://$AWS_ACCOUNT/$AWS_REGION
cdk deploy --all
# Note: Before the EC2 stack deploys you will be prompted for approval
# The message states 'This deployment will make potentially sensitive changes according to your current security approval level (--require-approval broadening).' and prompts for y/n
These steps will deploy an EC2 instance self-hosted runner that is added to your GitHub organization (as previously specified by the gh-url parameter). Confirm the self-hosted runner has been successfully added to your organization by navigating to the Settings tab for your GitHub organization, selecting the Actions options from the left-hand panel, and then selecting Runners.
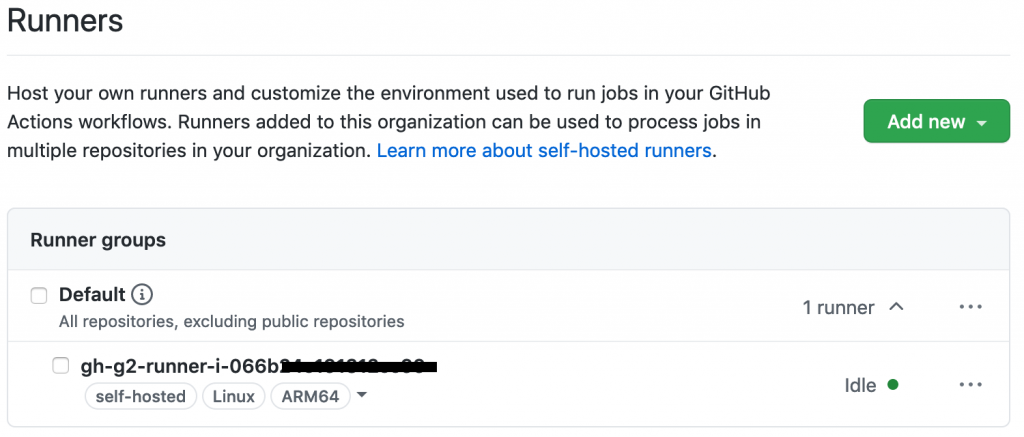
Extending a Workflow to use the self-hosted Runner
This section will walk through setting up a GitHub Actions workflow to extend a test pipeline for an example application. We’ll define a workflow that runs a series of static code checks and unit tests on both x86 and ARM.
Our example application is an online bookstore where users can find books, add them to their cart, and create orders. The application is written in Python using the Flask framework, and it uses Amazon DynamoDB for data storage.
Actions expect the workflow to be defined in the folder .github/workflows and the extension of either .yaml or .yml. We’ll create the directory, as well as an empty file inside the directory called main.yml.
#!/bin/bash
mkdir -p .github/workflows
touch .github/workflows/main.yml
First, we must define when our workflow will run. We’ll define the workflow to run when pull requests are created, synchronized (new commits are pushed), or re-opened, and then on push to the main branch.
# main.yml
on:
pull_request:
types: [opened, synchronize, reopened]
push:
branches:
- main
Next, define the workflow by adding jobs. Each job can have one or more steps to run. A step defines a command, set up task, or action that will be run. You can also create custom Actions with user-defined steps and repeatable modules.
Next, we’ll define a single job test to include every step of our workflow, as well as a strategy for the job to run the workflow on both x86 and the Graviton2 self-hosted runner. We’ll specify both ubuntu-latest, a hosted runner, and self-hosted for our Graviton2 runner. This lets our workflow run in parallel on two different CPUs, and it is not disruptive of existing processes.
# main.yml
jobs:
test:
runs-on: ${{ matrix.os }}
strategy:
fail-fast: false
matrix:
os: [ubuntu-latest, self-hosted]
Now we can add steps that each runner will run. We’ll be using custom Actions that we create for each step, as well as the pre-built action checkout for pulling down the latest changes to each runner.
GitHub Actions expects all custom actions to be defined in .github/actions/<name of action>/action.yml. We’ll define four custom Actions – check_system_deps, check_and_install_app_deps, run_static_checks, and run_unit_tests.
#!/bin/bash
for action in check_system_deps check_and_install_app_deps run_static_checks run_unit_tests; do \
mkdir -p .github/actions/${action} && \
touch .github/actions/${action}/action.yml; \
done
We define an Action with a series of steps to ensure that the runner is prepared to run our tests and checks:
- Check that Python3 is installed
- Check that pipenv is installed
Our using statement specifies “composite” to run all steps as a single action.
# .github/actions/check_system_deps/action.yml
name: "Check System Deps"
description: "Check for Python 3.x, list version, Install pipenv if it is not installed"
runs:
using: "composite"
steps:
- name: Check For Python3.x
run: |
which python3
VERSION=$(python3 --version | cut -d ' ' -f 2)
VERSION_PATCH=$(echo ${VERSION} | cut -d '.' -f 2)
[ $VERSION_PATCH -ge 8 ]
shell: bash
- name: Install Pipenv
run: python3 -m pip install pipenv --user
shell: bash
Now that we have the correct version of Python and a package manager installed, we’ll create an action to install our application dependencies:
# .github/actions/check_and_install_app_deps/action.yml
name: "Install deps"
description: "Install application dependencies"
runs:
using: "composite"
steps:
- name: Install deps
run: python3 -m pipenv install --dev
shell: bash
Next, we’ll create an action to run all of our static checks. For our example application, we want to perform the following checks:
- Check for security vulnerabilities using Bandit
- Check the cyclomatic complexity using McCabe
- Check for code that has no references using Vulture
- Perform a static type check using MyPy
- Check for open CVEs in dependencies using Safety
# .github/actions/run_static_checks/action.yml
name: "Run Static Checks"
description: "Run static checks for the python app"
runs:
using: "composite"
steps:
- name: Check common sense security issues
run: python3 -m pipenv run bandit -r graviton2_gh_runner_flask_app/
shell: bash
- name: Check Cyclomatic Complexity
run: python3 -m pipenv run flake8 --max-complexity 10 graviton2_gh_runner_flask_app
shell: bash
- name: Check for dead code
run: python3 -m pipenv run vulture graviton2_gh_runner_flask_app --min-confidence 100
shell: bash
- name: Check static types
run: python3 -m pipenv run mypy graviton2_gh_runner_flask_app
shell: bash
- name: Check for CVEs
run: python3 -m pipenv check
shell: bash
We’ll create an action to run the unit tests using PyTest.
# .github/actions/run_unit_tests/action.yml
name: "Run Unit Tests"
description: "Run unit tests for python app"
runs:
using: "composite"
steps:
- name: Run PyTest
run: python3 -m pipenv run pytest -sv tests
shell: bash
Finally, we’ll bring all of these actions into our steps in main.yml in order to define every step that will be run on each runner any time that our workflow is run.
# main.yml
steps:
- name: Checkout Code
uses: actions/checkout@v2
- name: Check System Deps
uses: ./.github/actions/check_system_deps
- name: Install deps
uses: ./.github/actions/check_and_install_app_deps
- name: Run Static Checks
uses: ./.github/actions/run_static_checks
- name: Run PyTest
uses: ./.github/actions/run_unit_tests
Save the file.
Running the Workflow
The workflow will run on the runners when you commit and push your changes. To demonstrate, we’ll create a PR to update the README of our example app in order to kick off the workflow.
After the change is pushed, see the status of your workflow by navigating to your repository in the browser. Select the Actions tab. Select your workflow run from the list of All Workflows. This opens the Summary page for the workflow run.
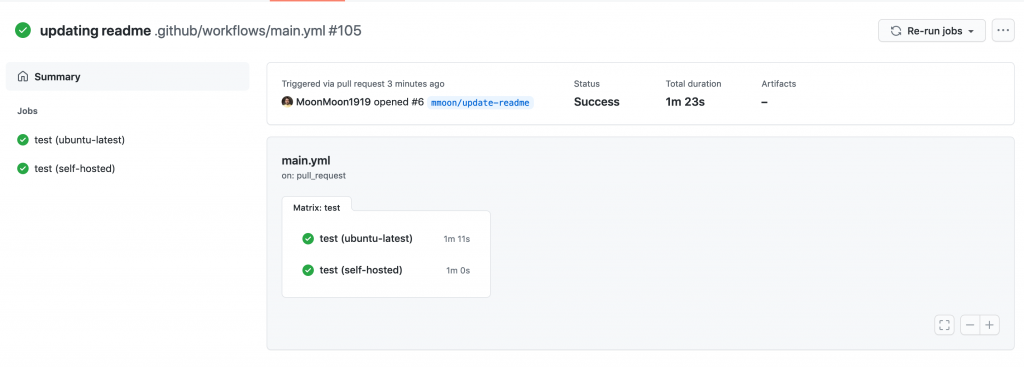
As each step defined in the workflow job runs, view their details by clicking the job name on the left-hand panel or on the graph representation. The following images are screenshots of the jobs, and example outputs of each step. First, we have check_system_deps.
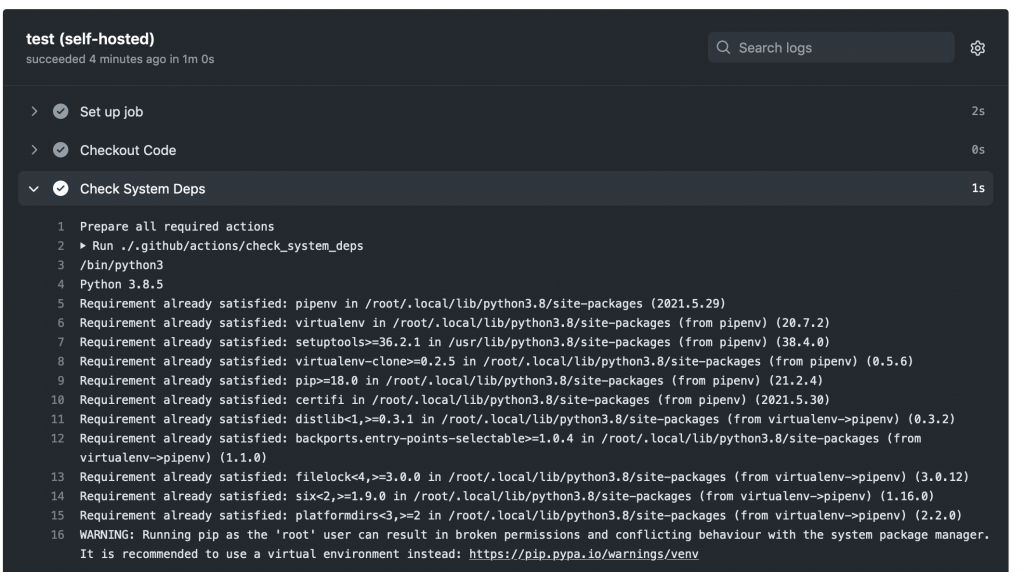
We’ve excluded a screenshot of check_and_install_app_deps that shows the output of pipenv install. Next, we can see that our change passes for our run_static_checks Action (first), and unit tests for our run_unit_tests Action (second).
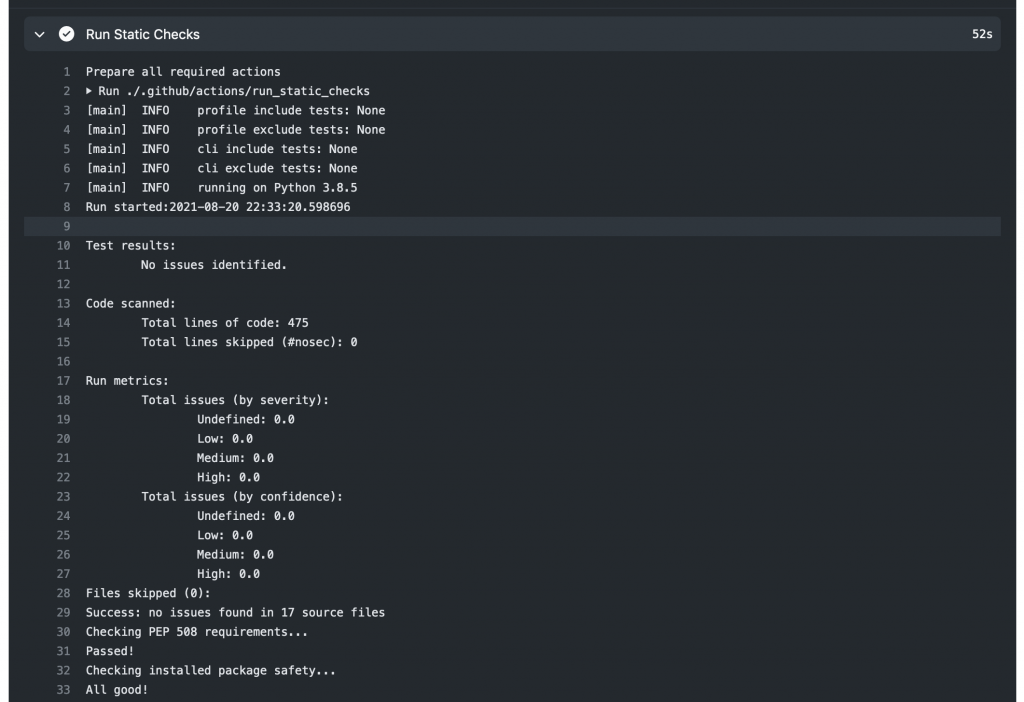
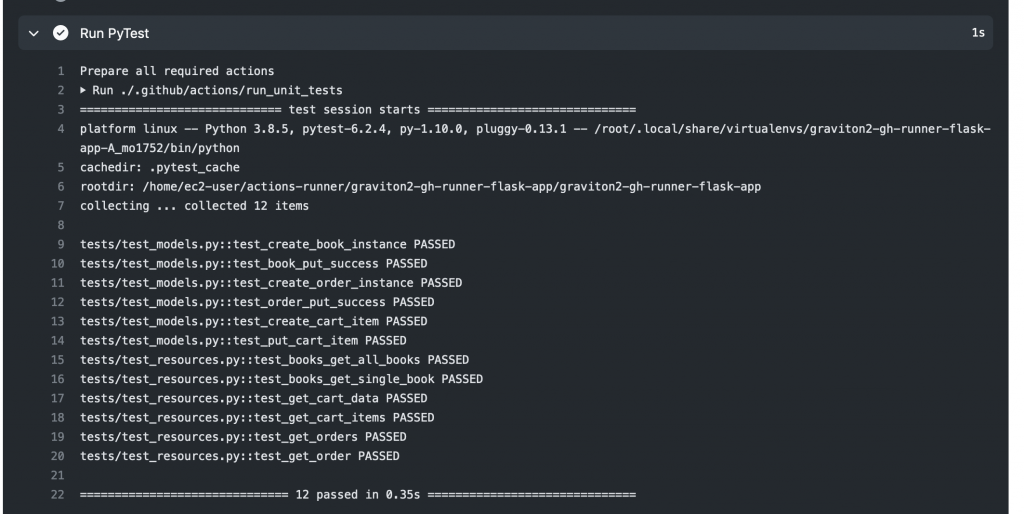
Finally, our workflow completes successfully!
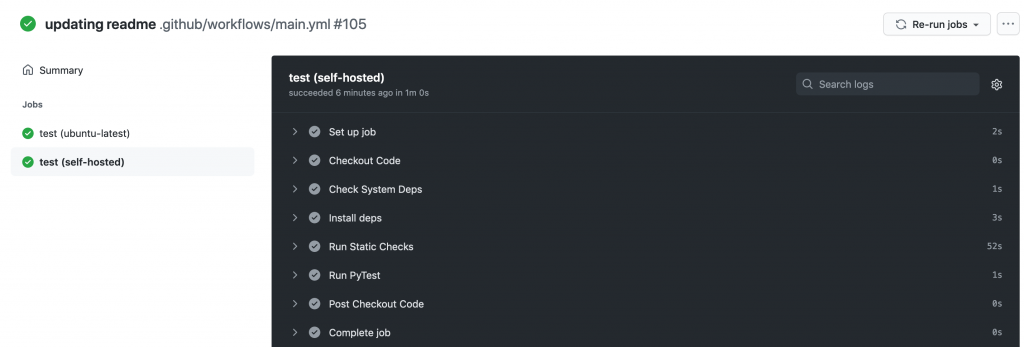
Clean up
To delete the AWS CDK stacks, launch CloudShell and enter the following commands:
#!/bin/bash
cd cdk-graviton2-gh-sh-runner
source .venv/bin/activate
# Re-set the environment variables again if required
# export VPC_CIDR="192.168.0.0/24" # Set your CIDR here.
cdk destroy --all
Conclusion
This post covered the configuring of a self-hosted GitHub Runner on an EC2 instance with a Graviton2 processor, the required network resources, and a workflow that will run on the Runner on each repository push or pull request for the example application. The Runner is configured at the Organization level, which by default only allows access by private repositories. Lastly, we showed an example run of the workflow after creating a pull request for our example app.
Self-hosted runners on Graviton2 for GitHub Actions lets you add ARM64 to your CICD workflows, accelerating migrations to take advantage of the price and performance of Graviton2. In this blog we’ve utilized a strategy to create a build matrix to run jobs on hosted and self-hosted runners.
We could further extend this workflow by automating deployment with AWS CodeDeploy or sending a build status notification to Slack. To reduce the cost of idle resources during periods without builds, you can set up an Amazon CloudWatch Event to schedule a stop and start of the instance during business hours.
Github Actions also supports ephemeral self-hosted runners, which automatically unregister runners from the service. Ephemeral runners are a good choice for self-managed environments where you need each job to run on a clean image.
For more examples of how to create development environments using AWS Graviton2 and AWS CDK, reference Building an ARM64 Rust development environment using AWS Graviton2 and AWS CDK.
Build workflows for Amazon Forecast with AWS Step Functions
=======================
This post is written by Péter Molnár, Data Scientist, ML ProServe and Sachin Doshi, Senior Application Architect, ProServe.
This blog builds a full lifecycle workflow for Amazon Forecast to predict household electricity consumption from historic data. Previously, developers used AWS Lambda function to build workflows for Amazon Forecast. You can now use AWS Step Functions with AWS SDK integrations to reduce cost and complexity.
Step Functions recently expanded the number of supported AWS service integrations from 17 to over 200 with AWS API actions from 46 to over 9,000 with AWS SDK service integrations.
Step Functions is a low-code visual workflow service used for workflow automation and service orchestration. Developers use Step Functions with managed services such as artificial intelligence services, Amazon S3, and AWS Glue.
You can create state machines that use AWS SDK Service Integrations with Amazon States Language (ASL), AWS Cloud Development Kit (AWS CDK), AWS Serverless Application Model (AWS SAM), or visually using AWS Step Function Workflow Studio.
To create workflows for AWS AI services like Forecast, you can use Step Functions AWS SDK service integrations. This approach can be simpler because it allows users to build solutions without writing JavaScript or Python code.
Workflow for Amazon Forecast
The solution includes four components:
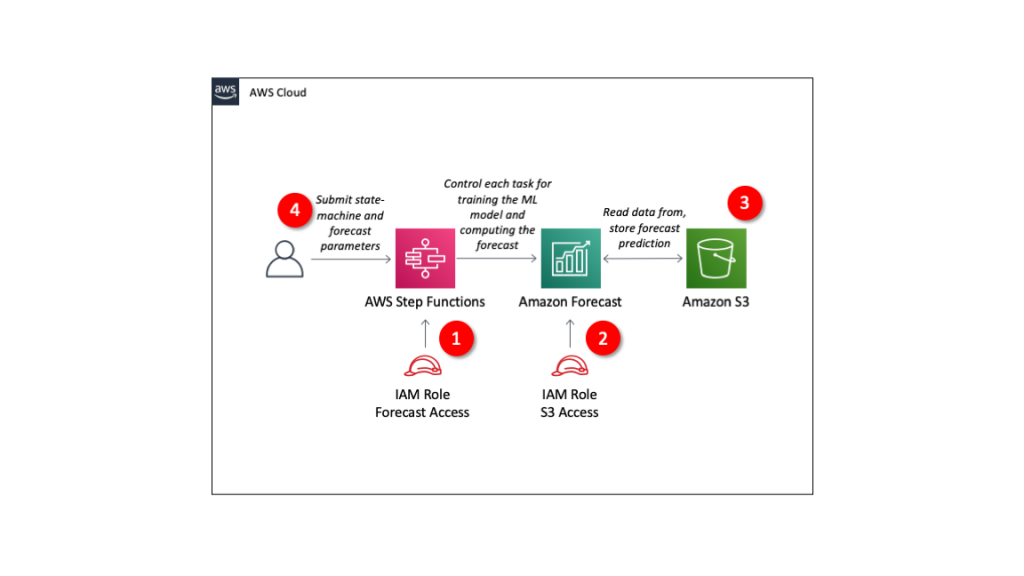
- IAM role granting Step Functions control over Forecast.
- IAM role granting Forecast access to S3 storage locations.
- S3 bucket with input data
- Define Step Functions state machine and parameters for Forecast.
The repo provides an AWS SAM template to deploy these resources in your AWS account.
Understanding Amazon Forecast
Amazon Forecast is a fully managed service for time series forecasting. Forecast uses machine learning to combine time series data with additional variables to build forecasts.
Using Amazon Forecast involves steps that may take from minutes to hours. Instead of executing each step and waiting for its completion, you use Step Functions to define the steps of the forecasting process.
These are the individual steps of the Step Functions workflow:
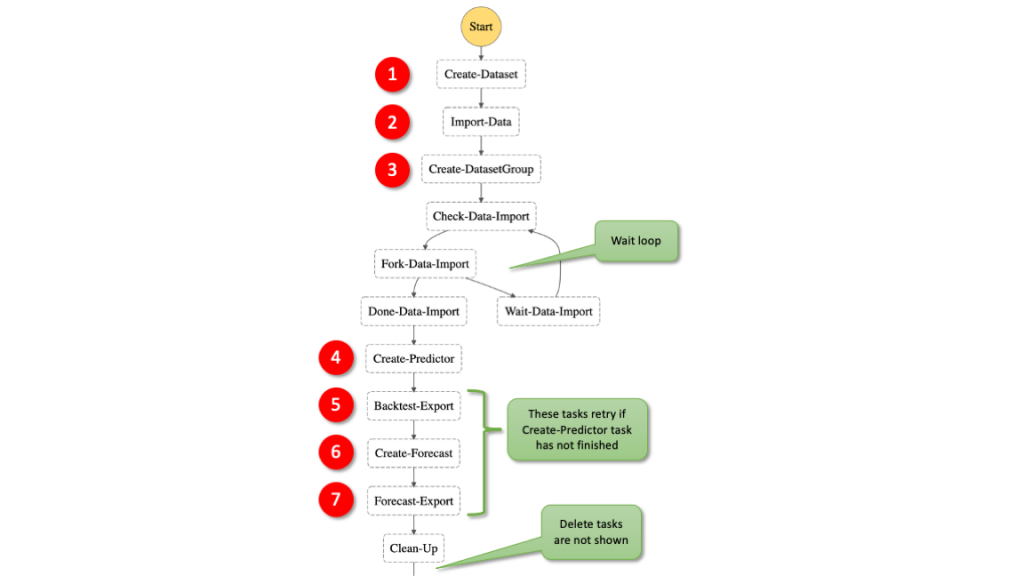
- Create a dataset: In Forecast, there are three types of datasets, target time series, related time series, and item metadata. The target time series is required and the others provide additional context with certain algorithms.
- Import data: This moves the information from S3 into a storage volume where the data is used for training and validation.
- Create a dataset group: This is the large box that isolates models and the data they are trained on from each other.
- Train a model: Forecast automates this process for you but you can also select algorithms. You can provide your own hyper parameters or use hyperparameter optimization (HPO) to determine the most performant values.
- Export back-test results: this creates a detailed table of the model performance.
- Deploy a predictor to deploy the model to use it to generate a forecast.
- Export forecast to create future predictions.
For more details, read the documentation of the Forecast APIs.
Example dataset
This example uses the individual household electric power consumption dataset. This dataset is available from the UCI Machine Learning Repository. We have aggregated the usage data to hourly intervals.
The dataset has three columns: the timestamp, value, and item ID. These are the minimum required to generate a forecast with Amazon Forecast.
Read more about the data and parameters in https://github.com/aws-samples/amazon-forecast-samples/tree/master/notebooks/basic/Tutorial.
Step Functions AWS SDK integrations
The AWS SDK integrations of Step Functions reduce the need for Lambda functions that call the Forecast APIs. You can call any AWS SDK-compatible service directly from the ASL. Use the following syntax in the resource field of a Step Functions task:
arn:aws:states:::aws-sdk:serviceName:apiAction.[serviceIntegrationPattern]
The following example compares using Step Functions AWS SDK service integrations with calling the boto3 Python method to create a dataset with a corresponding resource in the state machine definition. This is the ASL of a Step Functions state machine:
"States": {
"Create-Dataset": {
"Resource": "arn:aws:states:::aws-sdk:forecast:createDataset",
"Parameters": {
"DatasetName": "blog_example",
"DataFrequency": "H",
"Domain": "CUSTOM",
"DatasetType": "TARGET_TIME_SERIES",
"Schema": {
"Attributes": [
{
"AttributeName": "timestamp",
"AttributeType": "timestamp"
},
{
"AttributeName": "target_value",
"AttributeType": "float"
},
{
"AttributeName": "item_id",
"AttributeType": "string"
}
]
}
},
"ResultPath": "$.createDatasetResult",
"Next": "Import-Data"
}
The structure is similar to the corresponding boto3 methods. Compare the Python code with the state machine code – it uses the same parameters as calling the Python API:
forecast = boto3.client('forecast')
response = forecast.create_dataset(
Domain='CUSTOM',
DatasetType='TARGET_TIME_SERIES',
DatasetName='blog_example',
DataFrequency='H',
Schema={
'Attributes': [
{
'AttributeName': 'timestamp',
'AttributeType': 'timestamp'
},
{
'AttributeName': 'target_value',
'AttributeType': 'float'
},
{
'AttributeName': 'item_id',
'AttributeType': 'string'
}
]
}
)
Handling asynchronous API calls
Several Forecast APIs run asynchronously, such as createDatasetImportJob and createPredictor. This means that your workflow must wait until the import job is completed.
You can use one of two methods in the state machine: create a wait loop, or allow any following task that depends on the completion of the previous task to retry.
In general, it is good practice to allow any task to retry for a few times. For simplicity this example does not include general error handling. Read the blog Handling Errors, Retries, and adding Alerting to Step Function State Machine Executions to learn more about writing robust state machines.
1. State machine wait loop
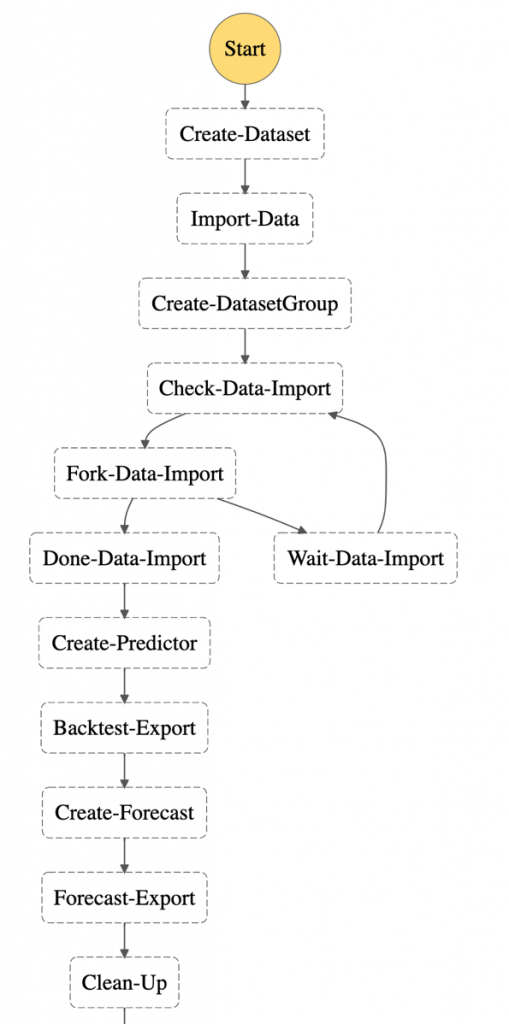
To wait for an asynchronous task to complete, use the services’ Describe* API methods to get the status of current job. You can implement the wait loop with the native Step Function tasks Choice and Wait.
Here, the task “Check-Data-Import” calls the describeDatasetImportJob API to receive a status value of the running job:
"Check-Data-Import": {
"Type": "Task",
"Resource": "arn:aws:states:::aws-sdk:forecast:describeDatasetImportJob",
"Parameters": {
"DatasetImportJobArn.$": "$.createDatasetImportJobResult.DatasetImportJobArn"
},
"ResultPath": "$.describeDatasetImportJobResult",
"Next": "Fork-Data-Import"
},
"Fork-Data-Import": {
"Type": "Choice",
"Choices": [
{
"Variable": "$.describeDatasetImportJobResult.Status",
"StringEquals": "ACTIVE",
"Next": "Done-Data-Import"
}
],
"Default": "Wait-Data-Import"
},
"Wait-Data-Import": {
"Type": "Wait",
"Seconds": 60,
"Next": "Check-Data-Import"
},
"Done-Data-Import": {
"Type": "Pass",
"Next": "Create-Predictor"
},
2. Fail and retry
Alternatively, use the Retry parameter to specify how to repeat the API call in case of an error. This example shows how the attempt to create the forecast is repeated if the resource that it depends on is not created. In this case, the preceding task of creating the predictor.
The time between retries is set to 180 seconds and the number of retries must not exceed 100. This means that the workflow waits 3 minutes before trying again. The longest time to wait for the ML training is five hours.
With the BackoffRate set to 1, the wait interval of 3 minutes remains constant. Value greater that 1 may reduce the number of retries but may also add increased wait time for training jobs that run for several hours:
"Create-Forecast": {
"Type": "Task",
"Resource": "arn:aws:states:::aws-sdk:forecast:createForecast",
"Parameters": {
"ForecastName.$": "States.Format('{}_forecast', $.ProjectName)",
"PredictorArn.$": "$.createPredictorResult.PredictorArn"
},
"ResultPath": "$.createForecastResult",
"Retry": [
{
"ErrorEquals": ["Forecast.ResourceInUseException"],
"IntervalSeconds": 180,
"BackoffRate": 1.0,
"MaxAttempts": 100
}
],
"Next": "Forecast-Export"
},
Deploying the workflow
The AWS Serverless Application Model Command Line Interface (AWS SAM CLI) is an extension of the AWS CLI that adds functionality for building and testing serverless applications. Follow the instructions to install the AWS SAM CLI.
To build and deploy the application:
- Clone the GitHub repo:
git clone https://github.com/aws-samples/aws-stepfunctions-examples/tree/main/sam/demo-forecast-service-integration
- Change directory to cloned repo.
cd demo-forecast-service-integration
- Enable execute permissions for the deployment script
chmod 700 ./bootstrap_deployment_script.sh
- Execute the script with a stack name of your choosing as parameter.
./bootstrap_deployment_script.sh <Here goes your stack name>
The script builds the AWS SAM template and deploys the stack under the given name. The AWS SAM template creates the underlying resources like S3 bucket, IAM policies, and Step Functions workflow. The script also copies the data file used for training to the newly created S3 bucket.
Running the workflow
After the AWS SAM Forecast workflow application is deployed, run the workflow to train a forecast predictor for the energy consumption:
- Navigate to the AWS Step Functions console.
- Select the state machine named “ForecastWorkflowStateMachine-*” and choose New execution.
- Define the “ProjectName” parameter in form of a JSON structure. The name for the Forecast Dataset group is “household_energy_forecast”.
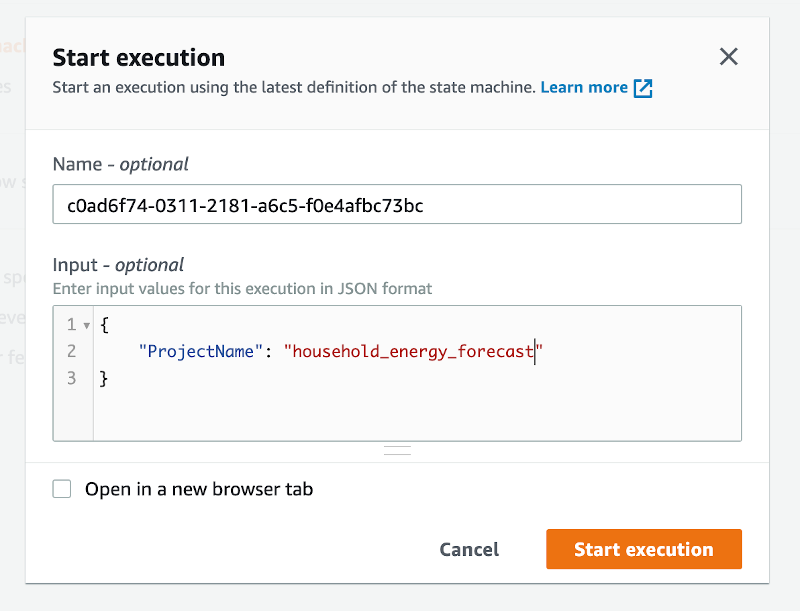
- Choose Start execution.
Viewing resources in the Amazon Forecast console
Navigate to the Amazon Forecast console and select the data set group “household_energy_forecast”. You can see the details of the Forecast resource as they are created. The provided state machine executes every step in the workflow and then deletes all resources, leaving the output files in S3.
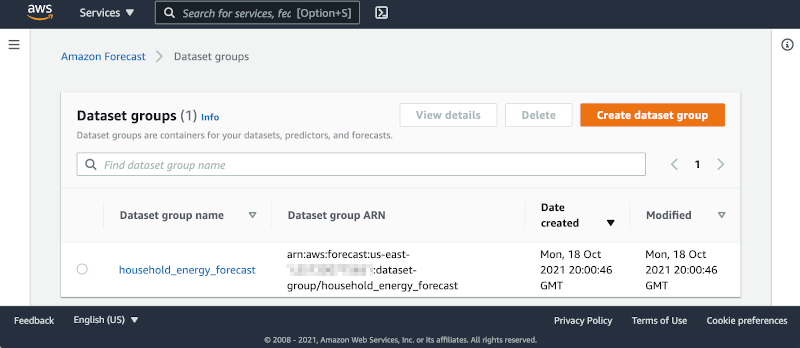
You can disable the clean-up process by editing the state machine:
- Choose Edit to open the editor.
- Find the tasks “Clean-Up” and change the “Next” state from “Delete-Forecast_export” to “SuccessState”.
"Clean-Up": {
"Type": "Pass",
"Next": "SuccessState"
},
- Delete all tasks named Delete-*.
Remember to delete the dataset group manually if you bypass the clean-up process of the workflow.
Analyzing Forecast Results
The forecast workflow creates a folder “forecast_results” for all of its output files. In there you find the subfolders “backtestexport” with data produced by Backtest-Export task, and “forecast” with the predicted energy demand forecast produced by the Forecast-Export job.
The “backtestexport” folder contains two tables: “accuracy-metrics-values” with the model performance accuracy metrics, and “forecast-values” with the predicted forecast values of the training set. Read the blog post Amazon Forecast now supports accuracy measurements for individual items for details.
The forecast predictions are stored in the “forecast” folder. The table contains forecasts at three different quantiles: 10%, 50% and 90%.
The data files are partitioned into multiple CSV files. In order to analyze them, first download and merge the files into proper tables. Use the AWS CLI command to download
BUCKET="<your account number>-<your region>-sf-forecast-workflow"
aws s3 cp s3://$BUCKET/forecast_results . –recursive
Alternatively, you may import and analyze the data into Amazon Athena.
Cleaning up
To delete the application that you created, use the AWS SAM CLI.
sam delete --stack-name <Here goes your stack name>
Also delete the data files in the S3 bucket. If you skipped the clean-up tasks in your workflow, you must delete the dataset group from the Forecast console.
Important things to know
Here are things know, that will help you to use AWS SDK service integration:
Call AWS SDK services directly from the ASL in the resource field of a task state. To do this, use the following syntax: arn:aws:states:::aws-sdk:serviceName:apiAction.[serviceIntegrationPattern]
Use camelCase for apiAction names in the Resource field, such as “copyObject”, and use PascalCase for parameter names in the Parameters field, such as “CopySource”.
Step Functions cannot generate IAM policies for most AWS SDK service integrations. You must add those to the IAM role of the state machine explicitly.
Learn more about this new capability by reading its documentation.
Conclusion
This post shows how to create a Step Functions workflow for Forecast using AWS SDK service integrations, which allows you to use over 200 with AWS API actions. It shows two patterns for handling asynchronous tasks. The first pattern queries the describe-* API repeatedly and the second pattern uses the “Retry” option. This simplifies the development of workflows because in many cases they can replace Lambda functions.
For more serveless learning resources, visit Serverless Land.
Page 1|Page 2|Page 3|Page 4