Contents of this page is copied directly from AWS blog sites to make it Kindle friendly. Some styles & sections from these pages are removed to render this properly in 'Article Mode' of Kindle e-Reader browser. All the contents of this page is property of AWS.
Page 1|Page 2|Page 3|Page 4
Announcing AWS CloudTrail Lake – a managed audit and security Lake
=======================
Organizations managing cloud infrastructure in AWS need effective mechanisms to audit operations in their AWS accounts for security and compliance. In November 2013, we announced AWS CloudTrail as the auditing platform for AWS. Since then, millions of customers have adopted this service. We believe CloudTrail is so important to AWS customers’ success that every new account created includes a 90-day free trial. We’ve also given our customers access to longer data retention, as well as provided them with integral copies of trails that multiple teams can consume.
Today, we are excited to announce the general availability of AWS CloudTrail Lake, a managed data lake that lets organizations aggregate, immutably store, and query events recorded by CloudTrail for auditing, security investigation, and operational troubleshooting. This new platform simplifies CloudTrail analysis workflows by integrating collection, storage, preparation, and optimization for analysis and query in the same product. This removes the need to maintain separate data processing pipelines that span across teams and products to analyze CloudTrail events.
CloudTrail Lake enables querying of CloudTrail data using the familiar SQL query language. The platform also includes sample queries that are designed to help users get started with writing queries for common scenarios, such as identifying records of all activities performed by a user to help accelerate security investigations. The immutable nature of storage, coupled with a default retention window of seven years, helps customers meet compliance requirements. CloudTrail Lake supports the collection of events from multiple AWS regions and AWS accounts.
In this blog post, I’ll walk you through an example of how you can get started with enabling CloudTrail Lake and performing a few example queries.
Enabling CloudTrail Lake
To use CloudTrail Lake, you must enable it in AWS CloudTrail. Use the following steps to enable CloudTrail Lake and create an event data store that we will query later on.
- Open the AWS Console and log in with an account with administrative permissions to manage AWS CloudTrail.
- Navigate to the CloudTrail console. In the left-hand navigation menu, choose Lake
- Choose the Event Data Store tab
- Navigate to, and choose, Create event data store.
- Enter a name for the data store. For my example, I’ll use the name “MyNewDataStore”
- Enter the retention period for your data store. You can enter from 7 days to 2555 days.
- Select whether you want to include only the current region in this data source. The current region’s name is shown for your reference.
- (Optional) Select if you want to include all accounts in the organization (applies only to AWS Organizations environments)
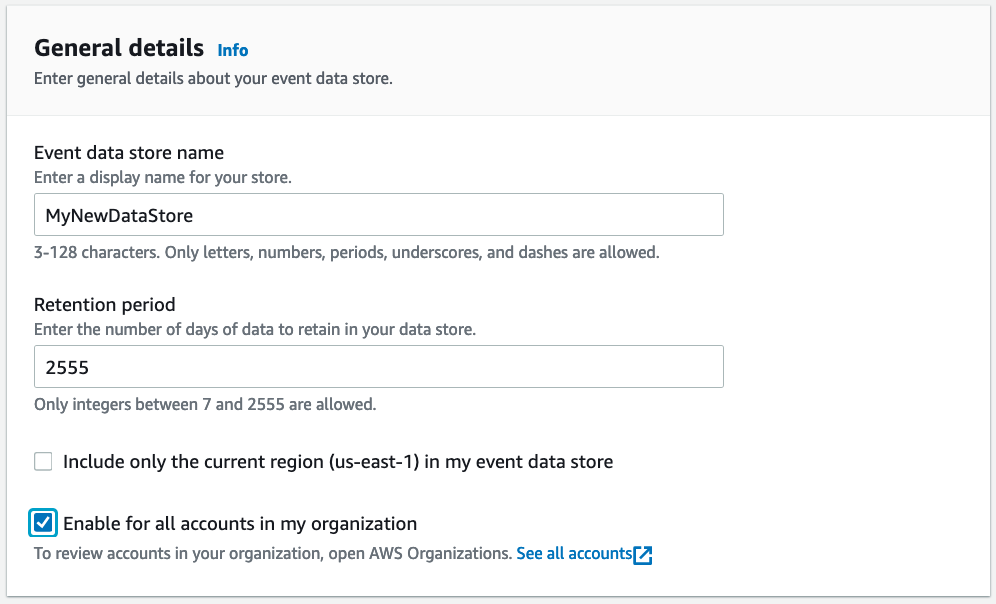
Create Event Data Store General Details
- (Optional) Enter any tags for the event data source. Tags can help you organize and sort resources in your AWS account. To learn more about using tags, see Tagging AWS resources in the AWS General Reference.
- Choose Next.
- Select the event types that you want to track. CloudTrail Lake allows you to collect data on both management events and data events.
- If you selected tracking for management events, you can select whether you want to track read and write events. You can also select whether to exclude AWS Key Management Service (KMS) and AWS RDS data API events from tracking.
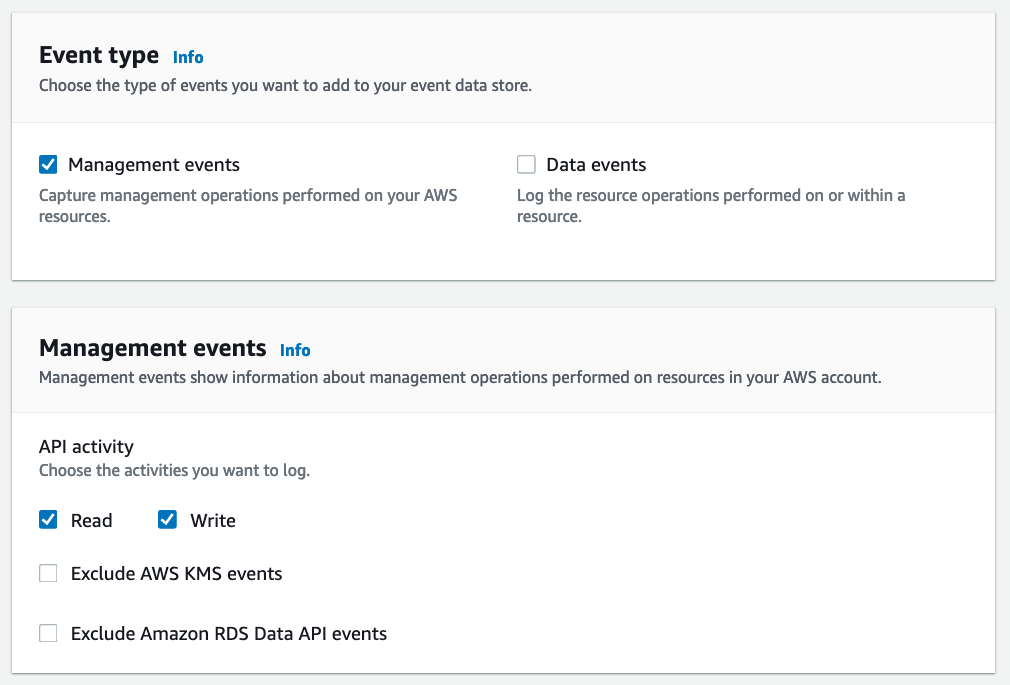
Choose events screen that allows users to specify the CloudTrail events that will be part of the event data source. You can also set options to exclude certain API activity.
- Choose Next.
- On the review page, make sure the options you configured are correct. When ready, choose Create event data store.
CloudTrail Lake then creates your event data store. You’ll see the status of your new event data store in the Status pane of the Event data stores list. After a few minutes, your data store will start and can then be queried.
Sample queries
You can explore the features of CloudTrail Lake by trying some of the sample queries included with this service. To use a sample query, use the following steps:
- Navigate to the Samples queries
- For this example, choose the Multi-region console logins This query will display all users who have logged into the console from a specified set of regions, within a specified date range.
- The following sample query is automatically populated into the Query editor (you must replace $EDS_ID with the id of your event data store) :
SELECT eventTime, useridentity.arn, awsRegion FROM $EDS_ID WHERE eventTime > '2021-07-20 00:00:00' AND eventTime < '2021-07-23 00:00:00' AND awsRegion in ('us-east-1') AND eventName = 'ConsoleLogin'
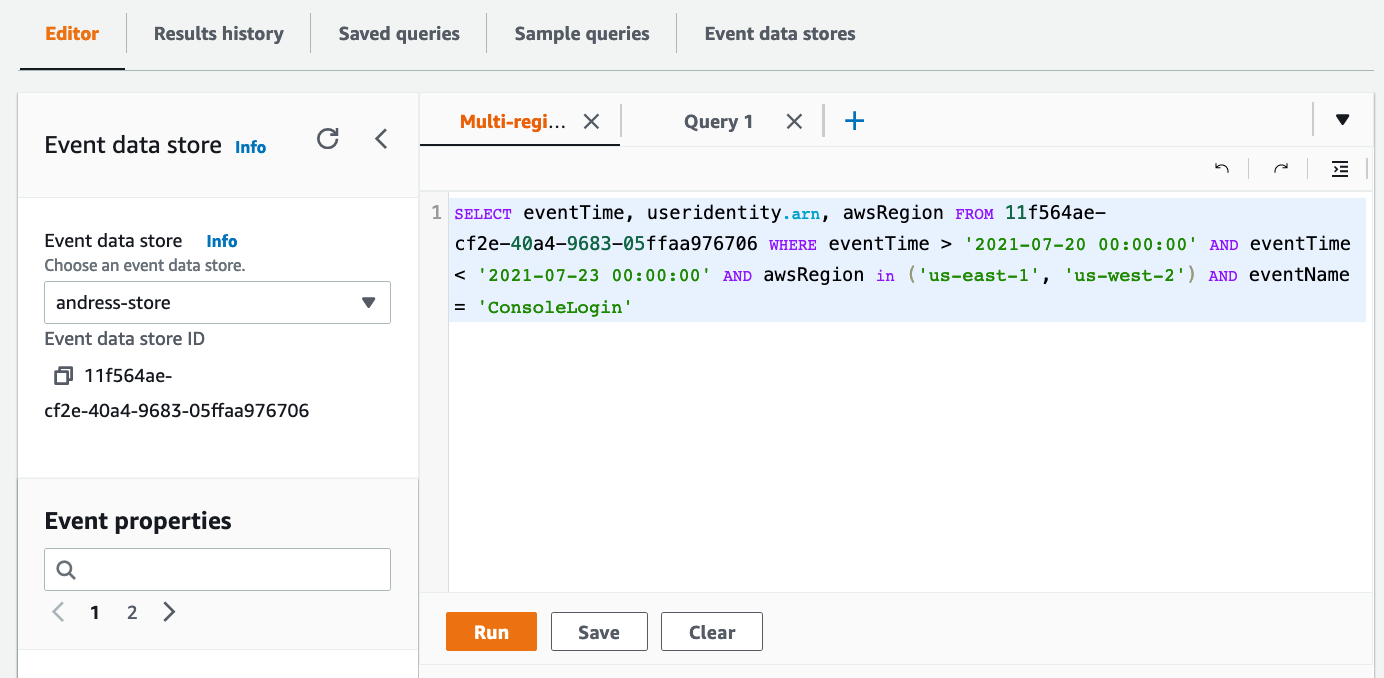
Sample query screen
- Next, you must replace the time range that will be searched with the time range you want to use. The date string specified after
eventTime > is the earliest event timestamp that will be included, while the date string specified after eventTime < is the latest event timestamp that will be included. (Note: you can use >= or <= to make the time stamp inclusive of the date/time provided. For a full list of all the operators supported, please see here. )
- Finally, specify for which regions you would like to search login events. The sample already includes
us-east-1 and us-east-2. This looks good to me. If you want to add or remove regions from the search, you can add or remove them from the parenthesis after the awsRegion in statement.
With my changes made, my new query now looks as follows:
SELECT eventTime, useridentity.arn, awsRegion FROM 2add3562-038a-4075-95af-e219ea33a2df WHERE eventTime > ‘2021-12-05 00:00:00’ AND eventTime < ‘2021-12-16 00:00:00’ AND awsRegion in (‘us-east-1’, ‘us-west-2’) AND eventName = ‘ConsoleLogin’
Now that the query is ready, I click “Run”. After a few seconds I can see the results under “Query Results”
CloudTrail Lake included additional resources you can use while building a query. For example, the left-hand pane on the console gives a full list of the event properties you can query. This is helpful when you want to add fields to query for or criteria to further refine your query.
You can also save your queries and reuse them later, right from the console. Just choose the Save button and enter a descriptive name for the query. You can access all your saved queries from the Saved queries tab.
Other sample queries
Here are a few other queries you can try to get a sense of the power of this platform. Make sure to replace the event data source in the query statement with the correct one for your account.
Show all recorded API activity for a specific IAM key
SELECT eventTime, eventName, userIdentity.principalId
FROM 11f564ae-cf2e-40a4-9683-05ffaa976706
WHERE userIdentity.accessKeyId like 'AKIAXZUQIC6XEVCJJFM7'
Show any security group changes
SELECT eventname, useridentity.username, sourceIPAddress, eventtime, element_at(requestParameters, 'groupId') as SecurityGroup, element_at(requestParameters, 'ipPermissions') as ipPermissions
FROM $EDS_ID
WHERE (element_at(requestParameters, 'groupId') like '%sg-%')
and eventtime > '2017-11-01T00:00:00Z'
order by eventtime asc;
Generally available today
You can enable CloudTrail Lake in the CloudTrail console, by using the AWS Software Development Kits (SDKs), or by using the AWS Command Line Interface (CLI). CloudTrail Lake is currently available in the following regions: US East (N. Virginia), US East (Ohio), US West (N. California), US West (Oregon), Canada (Central), Africa (Cape Town), Europe (Ireland), Europe (London), Europe (Paris), Europe (Milan), Europe (Frankfurt), Europe (Stockholm), Asia Pacific (Tokyo), Asia Pacific (Seoul), Asia Pacific (Osaka), Asia Pacific (Hong Kong), Asia Pacific (Singapore), Asia Pacific (Sydney), Asia Pacific (Mumbai), Asia Pacific (Jakarta), Middle East (Bahrain), and South America (Sao Paulo). To get started, see Working with CloudTrail Lake in the CloudTrail User Guide.
Cleanup
If you no longer would like to use CloudTrail lake, just make sure to delete the event data store. To do this follow these steps:
- Click on the Event data stores tab in the Lake console.
- Select the event data store from the list.
- From the actions menu, select “Change termination protection”.
- From the change termination protection pop-up select Disabled and click “Save”.
- From the Actions menu select Delete, confirm that you want to delete it by entering the name of the data store. Then click “Delete”. This will place your event data store in the pending deletion state.
- This will disable the data store and in seven days it will be deleted permanently.
Conclusion
In the blog post we’ve announced the new CloudTrail Lake service. We’ve shown you some examples of how you can enable it, as well as how to start writing your own queries. We also provided you some sample queries to get started. We’re excited to make this new service available for you and can’t wait to see what great things you build with it.
How to monitor hybrid environments with AWS services
=======================
As enterprises start migrating to the cloud, one challenge they will face is framing and implementing a holistic monitoring strategy for the hybrid environment. In our experience, there are three main reasons for this. First and foremost, an enterprise generally has multiple monitoring tools in place, but when the enterprises start moving to the cloud, they quickly realize that those tools cannot meet the requirements of cloud-native applications and workloads. Second, the cost and licensing of supporting multiple tools forces enterprises to step back, investigate their monitoring ecosystem, and consolidate. Third, enterprises are unaware that AWS tools and services can be utilized to monitor hybrid and on-premises environments.
There’s a misconception that AWS tools can only monitor AWS environments, and that they cannot support hybrid and on-premises workloads monitoring. This exacerbates the pain points mentioned in the first two points above, as AWS monitoring tools can help enterprises define their monitoring strategy, and in some cases even complement the existing tools and technologies. This post will describe how enterprises can leverage AWS tools and services to monitor their hybrid environment.
Monitoring scenario
In this post, we’ll demonstrate the following:
Setup required to enable monitoring in a hybrid environment.
Monitor an application in an on-premises VM (Linux based).
Send the logs and metrics from on-premises environment to AWS.
Consolidate the on-premises metrics and logs with AWS data in order to provide a single pane of glass for monitoring.
This post does not show all of the possible use-cases for hybrid monitoring. Instead, we will showcase the capability of AWS services for monitoring a hybrid and/or on-premises environment so that you can get familiar with these capabilities and utilize them as you define your monitoring strategy.
Overview of AWS Monitoring tools and services
The key services for monitoring on-premise environments are as follows:
Amazon CloudWatch
Amazon CloudWatch is a service that lets you monitor AWS and on-premises environments in real time, including resources and applications. Utilize Amazon CloudWatch to collect and track metrics, collect and monitor log files, set alarms, and create dashboards. Get more details about the service here.
AWS X-Ray
AWS X-Ray complements Amazon CloudWatch by helping developers analyze and debug distributed applications, such as those built with a microservices architecture. AWS X-Ray provides insights into how your application and its underlying services are performing in order to identify and troubleshoot the root cause of performance issues and errors. AWS X-Ray provides an end-to-end view of requests as they travel through your application, as well as a map of your application’s underlying components. For more information about AWS X-Ray, refer here.
AWS Systems Manager (SSM)
AWS Systems Manager acts as the operational hub for your hybrid environment. It lets you manage servers in your environment across AWS (EC2 instances), as well as on-premises. Utilize SSM to install and update agents, such as the CloudWatch agent, across your entire server fleet without having to do so individually per server. Read about AWS Systems Manager here.
Environment Setup
This section describes the steps you must take to enable monitoring.
Configuring SSM agent and the CloudWatch agent
These are the steps you must follow in order to install and configure SSM and the CloudWatch agents in your on-premises environment:
- Create an IAM role named SSMServiceRole with ‘AmazonSSMManagedInstanceCore‘ and ‘CloudWatchFullAccess‘ AWS managed policies, as well as the following trust policy:
{
"Version": "2012-10-17",
"Statement": {
"Effect": "Allow",
"Principal": {
"Service": "ssm.amazonaws.com"
},
"Action": "sts:AssumeRole"
}
}
- Create a new Hybrid Activation using SSM Manager, which provides you with the Activation Key and Activation code (see image below). Either use the role created above or the default role that SSM creates for you (AmazonEC2RunCommandRoleForManagedInstances).
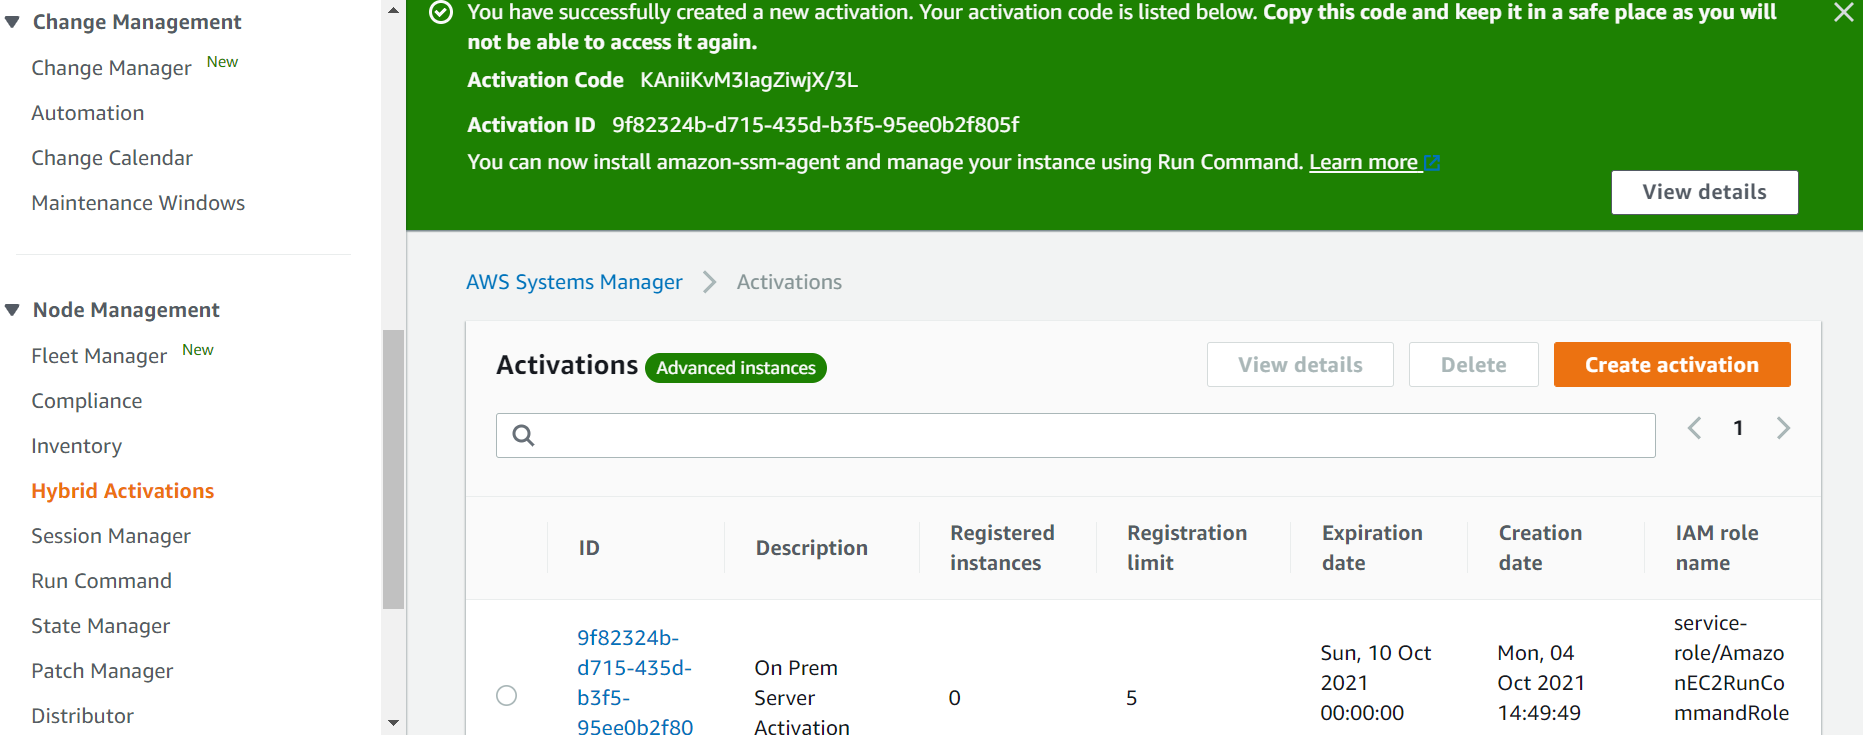
- Install and run SSM agent on on-premises servers. Register the server with SSM, and start the agent, by using the following commands:
sudo -E amazon-ssm-agent -register -code "activation-code" -id "activation-id" -region "region"
sudo service amazon-ssm-agent start (Or, sudo systemctl start snap.amazon-ssm-agent.amazon-ssm-agent.service)
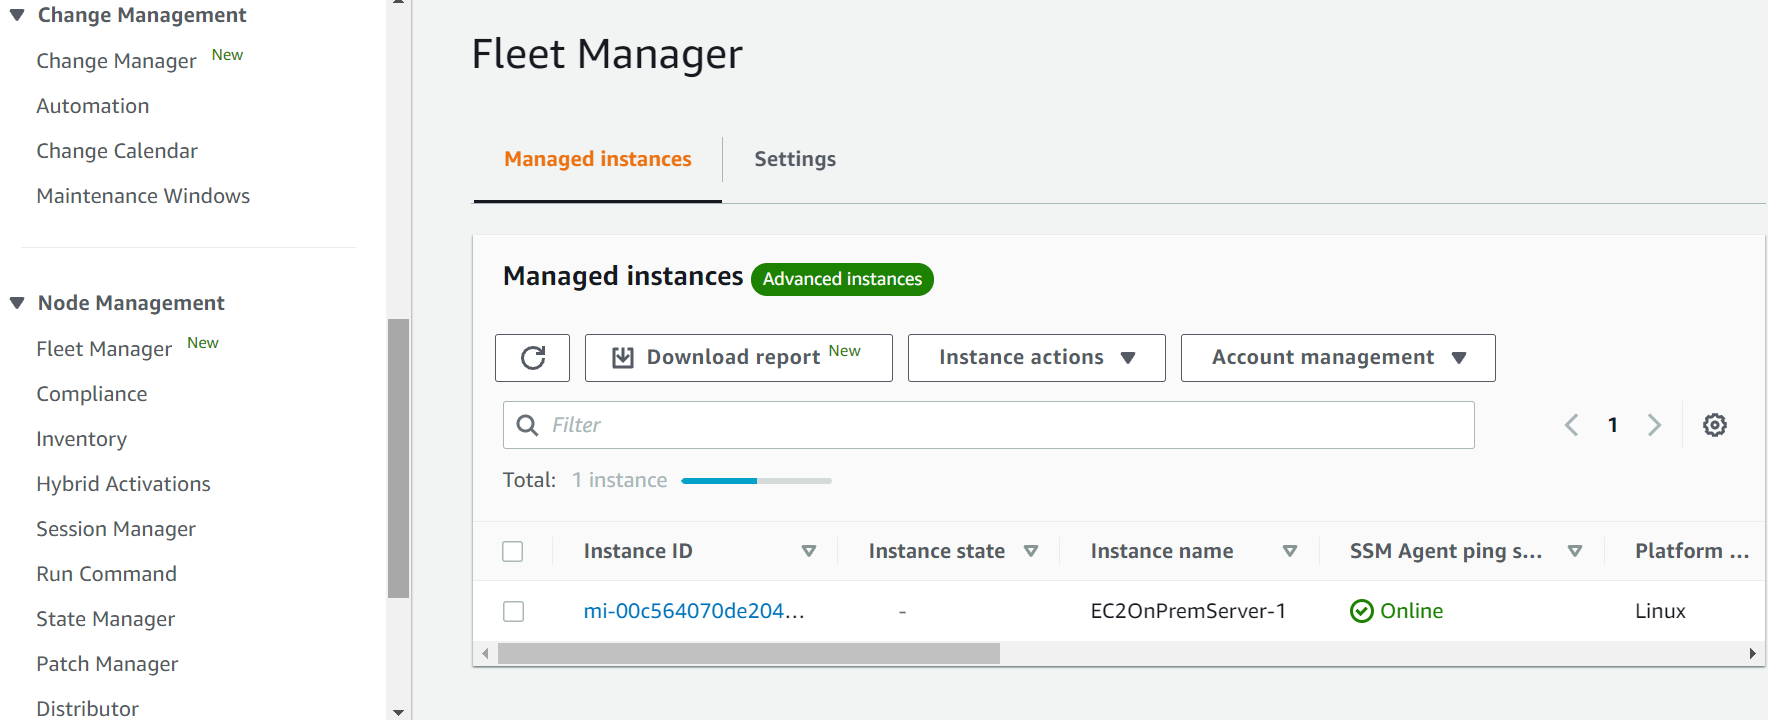
- Once the SSM agent is started, you should see the on-premises server(s) in the Systems Manager console by going to the ‘Fleet Manager’ section of the panel under Node Management as shown below.
- Install the CloudWatch agent on the on-premises server(s) by using AWS Systems Manager’s Run command, and then selecting AWS-ConfigureAWSPackage Configure the CloudWatch agent by using a configuration file or configuration wizard.
- Configure on-premises servers that use SSM Agent and the unified CloudWatch agent to use AWS credentials. See the following link on how to do so:https://aws.amazon.com/premiumsupport/knowledge-center/cloudwatch-on-premises-temp-credentials/
- Set up CloudWatch log groups and log streams for CloudWatch in AWS to send logs to AWS, and then start the CloudWatch agent on the servers by using the following command:
sudo /opt/aws/amazon-cloudwatch-agent/bin/amazon-cloudwatch-agent-ctl -a fetch-config -m onPremise -s -c file:/opt/aws/amazon-cloudwatch-agent/bin/config.json
Configuring AWS X-Ray
In this section, we discuss the steps to enable AWS X-Ray for on-premises servers. To send segments to AWS X-Ray directly, utilize PutTraceSegments, or through the X-Ray daemon. This post utilizes the AWS X-Ray daemon approach to send the traces back to AWS X-ray service.
We recommend utilizing AWS X-Ray daemon to emit data into AWS X-Ray, as this ensures the application will not need to spend time and resources formatting and emitting data to the AWS X-Ray API. Use of a local AWS X-Ray daemon lets your applications send telemetry locally on your network in real-time over UDP port 2000. This places the transmission burden on a purpose-built system that is solely responsible for doing so. Moreover, this follows the principal of least privilege, as well as a strong separation of concerns between your applications and the systems that analyze telemetry.
Run the AWS X-Ray daemon on-premises on Linux, MacOS, Windows, or in a Docker container, and relay trace data back to AWS X-Ray. When running outside of AWS Cloud, the daemon can read credentials from an Amazon SDK credentials file (.aws/credentials in your user directory) or from environment variables.
Find the AWS X-Ray daemon configurations below.
AWS X-Ray daemon configurations:
- Download and install the AWS X-Ray agent on the on-premises server by using the following command. The command will vary depending on the OS. Find more information depending upon the different operating systems using this link. Also, define an SSM Document to install the daemon by using AWS Systems Manager.
curl https://s3.us-east-2.amazonaws.com/aws-xray-assets.us-east-2/xray-daemon/aws-xray-daemon-3.x.deb -o /opt/aws/xray/aws-xray-daemon-3.x.deb
- Provide AWS credentials in the credentials file located in ~/.aws/credentials on Ubuntu server. For other OS, see the location here. You must create a user in AWS and download the ‘AWS Access Key Id’, and ‘AWS Secret Access Key’, which must be provided in the credentials file as follows:
[default]
aws_access_key_id = AKIAIOSFODNN7EXAMPLE
aws_secret_access_key = wJalrXUtnFEMI/K7MDENG/bPxRfiCYEXAMPLEKEY
- Check the AWS Identity by using the following command, and you should find the appropriate userid, account, and role information:
aws sts get-caller-identity
- It is very important to check that you have configured the AWS profile of the target account before running the AWS X-Ray daemon. The AWS X-Ray agent will fail to send the messages if you are using an incorrect access key or secret access key.
- If you cannot see the traces going back to AWS X-Ray, run the env command and check the AWS Profile set. You should see something like what is shown below, and it should be the correct profile.
ubuntu@ip-172-31-17-251:~$ env
SHELL=/bin/bash
AWS_PROFILE=xray <active profile>
- Configure the AWS X-ray agent by providing a config yaml file or providing the appropriate parameters while starting the AWS X-Ray daemon as follows:
/xray-daemon$ ./xray -o -n <region> -f <log file location> -l <log level> &
- Run the AWS X-Ray daemon in the background, or use any other mechanisms as per your company policies to run it.
Send AWS X-Ray traces:
- For this blog, we have used a simple python – Flask based web application. To generate a segment based on incoming requests, you must instantiate the AWS X-Ray middleware for flask by using the below libraries:
from aws_xray_sdk.core import xray_recorder
from aws_xray_sdk.ext.flask.middleware import XRayMiddleware
- If you are using any other language or framework, you can always refer to the AWS X-Ray developer guide for detailed information.
- Furthermore, in order to instrument downstream calls, use the AWS X-Ray SDK for Python to patch the libraries that your application uses. The AWS X-Ray SDK for Python can patch the libraries available in this link. When you use a patched library, the AWS X-Ray SDK for Python creates a subsegment for the call and records information from the request and response. A small code snippet is available below:
import boto3
import botocore
import requests
import sqlite3
from aws_xray_sdk.core import xray_recorder
from aws_xray_sdk.core import patch_all
patch_all()
- There are other detailed options available to send granular data, but for the initial set up you can utilize this simple piece of code shown above. For a detailed set up, refer to this documentation. There are similar references available for other languages as well.
- As you use your application, you will see the traces sent to the AWS X-Ray service immediately and should be able to see the required graphs in your application.
End-to-end observability in AWS
This section demonstrates how enterprises can monitor hybrid environments holistically. End-to-end monitoring covers on-premises and AWS environments, and it provides a single pane of glass for monitoring.
CloudWatch Console Screenshots
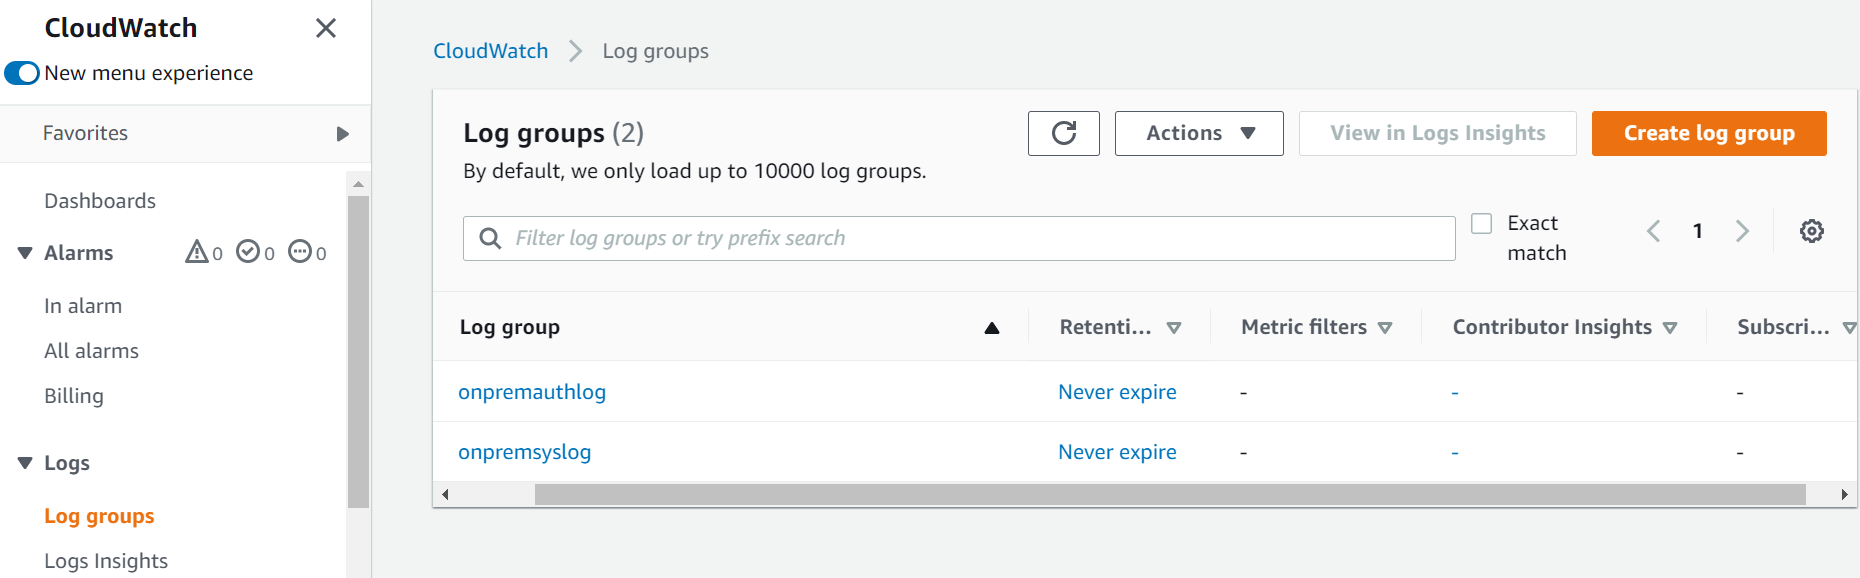
Here’s a view of CloudWatch log group created to ingest logs from on-premises servers:
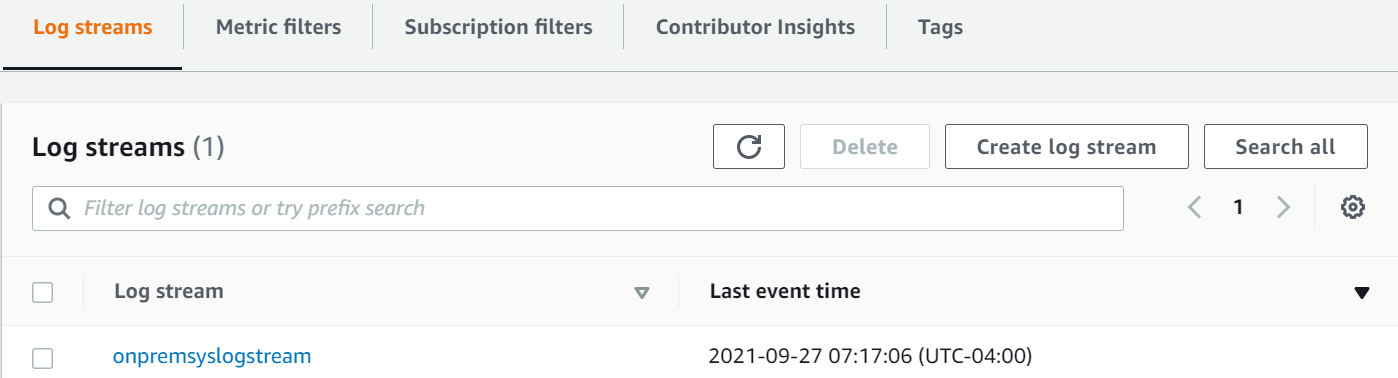
The following image shows the CloudWatch log stream created in the log group (onpremsyslog) to capture CloudWatch logs:
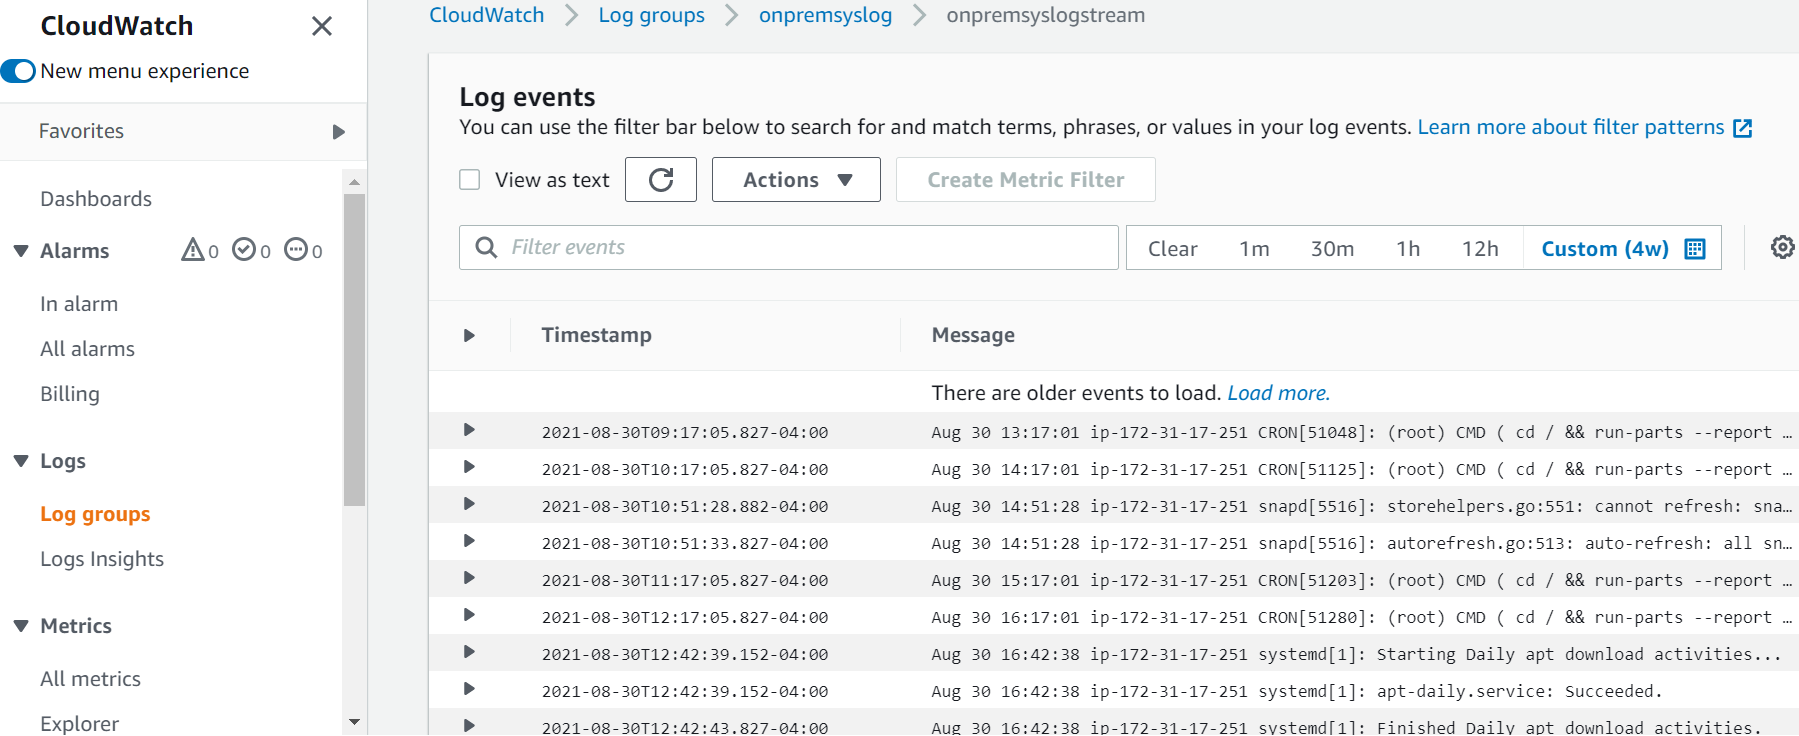
And the image below shows logs pushed from on-premises servers:
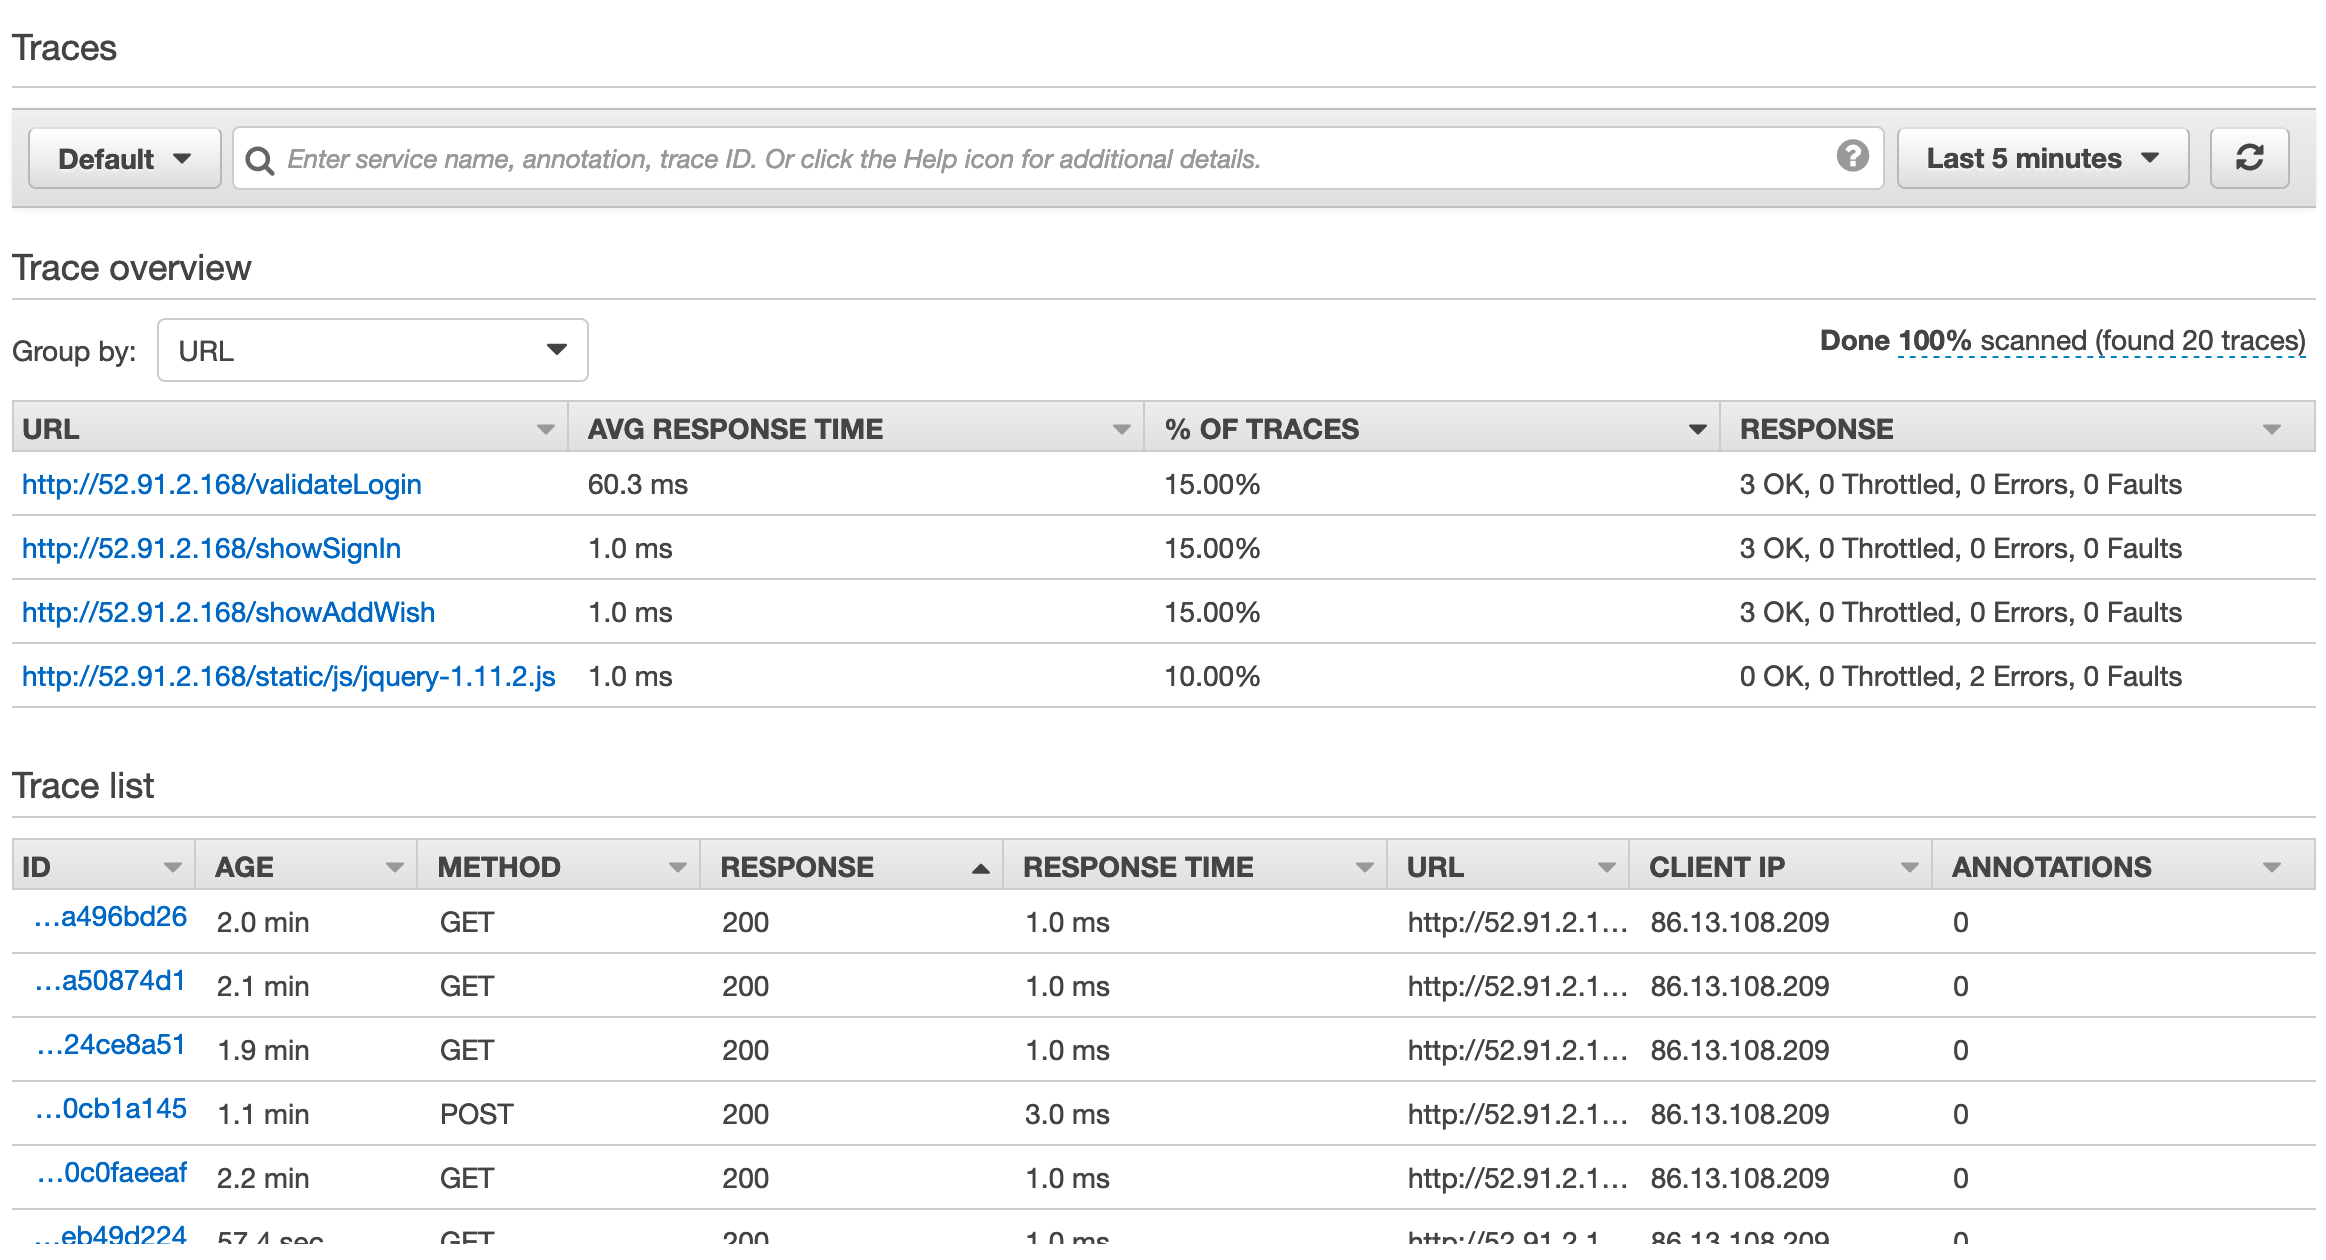
AWS X-Ray Screenshots
Find the traces overview in your AWS X-Ray application, which you can group by URL, status code, user, etc. It lets you drill down to individual trace from the Trace list and get a detailed view.
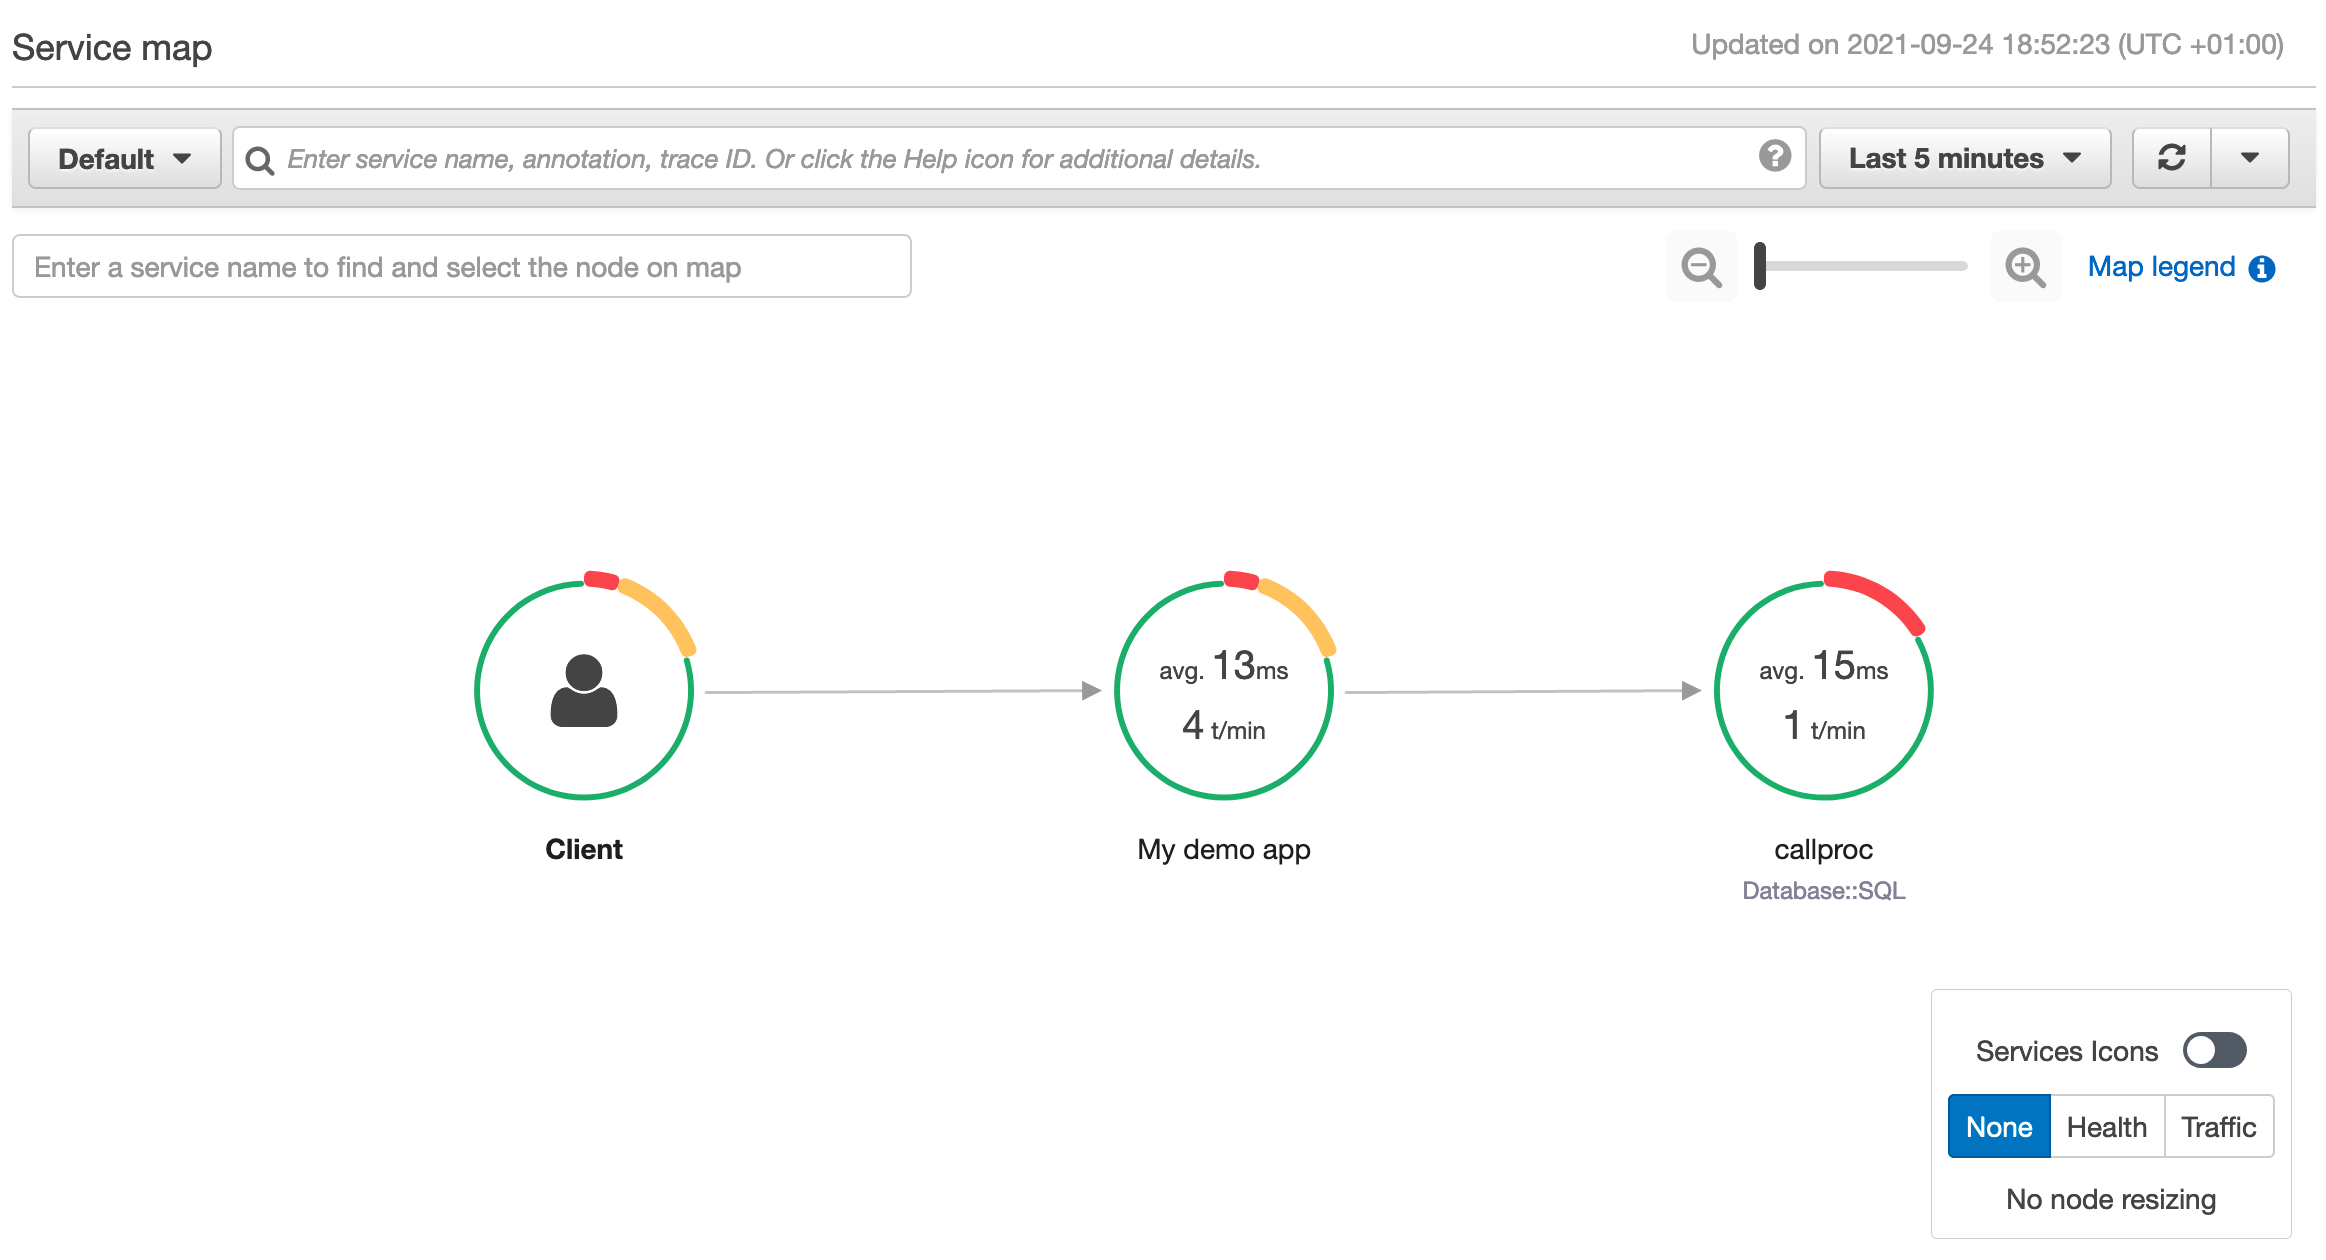
You can go to AWS X-Ray service maps that show information about your API and all of its downstream services. For example, in this scenario, we are seeing calls made to database server.
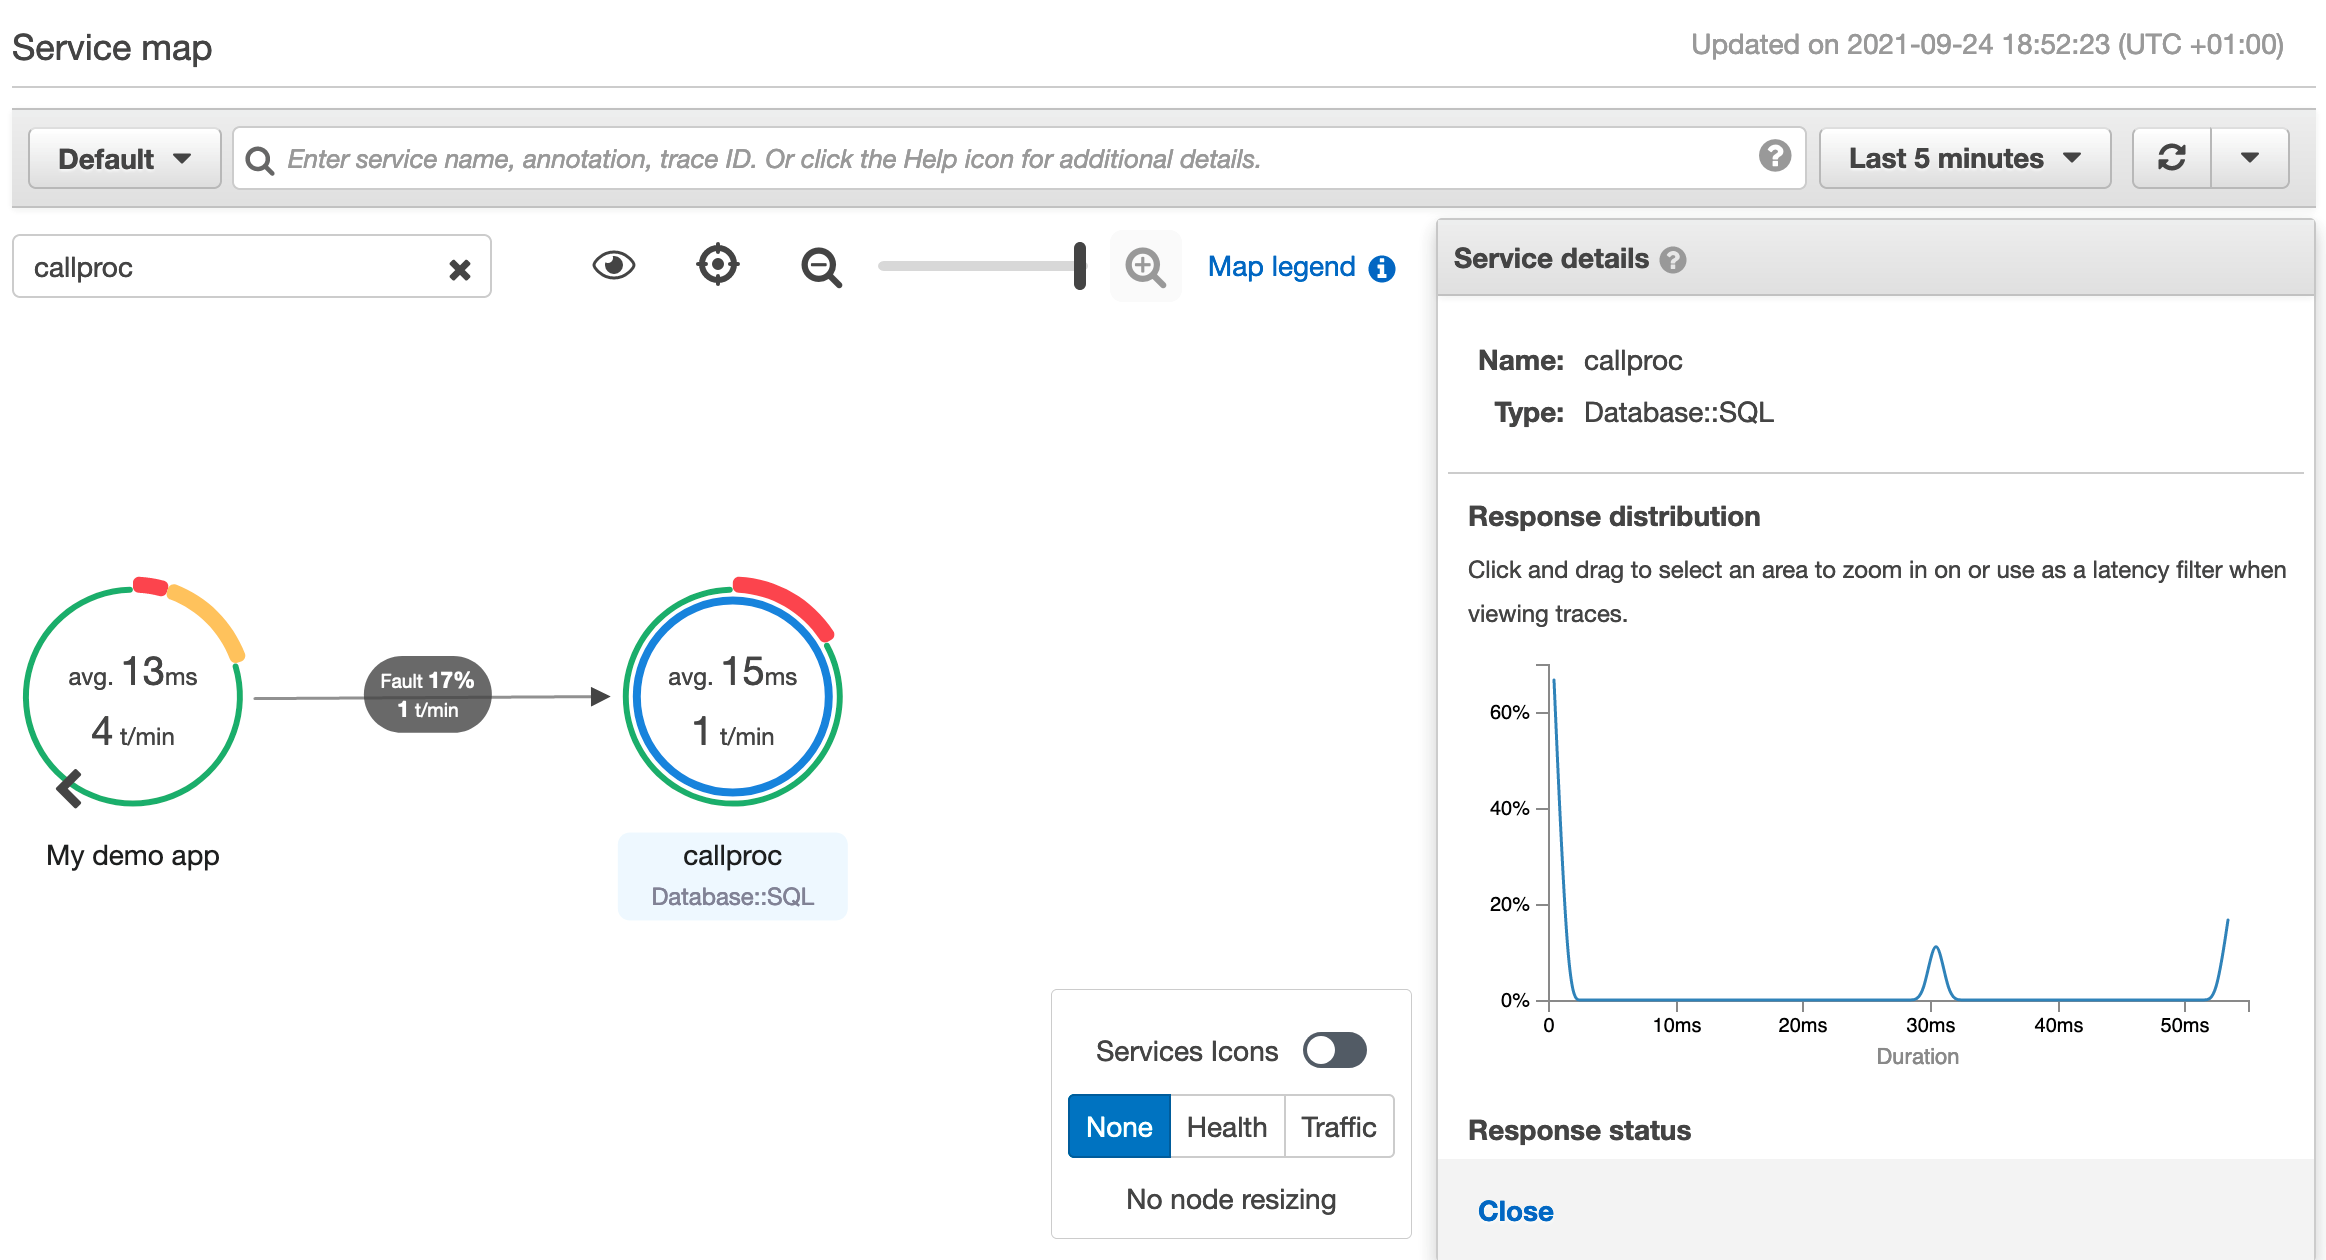
If you choose a node or edge on an AWS X-Ray service map, the AWS X-Ray console shows a latency distribution histogram. Utilize a latency histogram to see how long it takes for a service to complete its requests.
Essentially, by just following a couple simple steps, you can enable end-to-end monitoring for your on-premises application. Furthermore, it can be extended to a range of applications hosted in an on-premises or hybrid environment, which will let you build a single monitoring view on AWS Cloud.
Considerations for implementing Monitoring strategy
So far, we’ve shown how to utilize AWS tools to complement an enterprise’s monitoring strategy. These tools and services can support strategic long-term monitoring objectives, or they can be used tactically to bridge gap(s) until the long-term monitoring strategy is finalized. Based on our experience, no single solution will work for every organization. Here are some considerations that should help select the appropriate tool, and help with the monitoring strategy.
Existing toolset: What are the current monitoring tools in place? If the current tools meet your organization’s monitoring requirements and can meet future workload requirements, then you should continue using them.
Monitoring capabilities: Is the tool(s) in consideration capable of monitoring cloud-native workloads that you intend to use moving forward? For example, if the enterprise direction is to use serverless technologies (or say containers – ECS/EKS), will the tool(s) be able to monitor the workloads effectively? Also, do the tool(s) cover every aspect of monitoring requirements — infrastructure, network, application, etc.?
SMEs and knowledge: Do you have the skill set and know-how to use a monitoring tool? We’ve seen numerous monitoring initiatives fail due to lack of expertise. It is imperative that enterprises have the requisite knowledge and skill-set to work with the tool.
Cost: Look at the costs holistically. Factor in support costs, integration/development costs, and not just the licensing costs (present and future) of the tool(s) under consideration. Some monitoring tools are not cheap, and in some cases enterprises will be better off using their existing toolsets/licenses. Explore BYOL (Bring Your Own License) or AWS Marketplace/private pricing offerings, as they may help lower costs.
Integration: See how the tool(s) integrate with your workloads, AWS services, and SIEM platform in general. In some cases, low licensing costs may be offset by high integration costs.
Reliability: Does the tool(s), and its deployment, meet the HA requirements, as well as support RTO and RPO objectives of the organization?
Security: Does the tool(s) meet the security and controls requirements of the enterprise, and does it support integration with security tools and services?
Open source vs Proprietary: From the technological perspective, one criteria you must determine is whether you want an open source monitoring toolset (e.g., ELK – ElasticSearch/Logstash/Kibana, or Prometheus/Grafana), or a proprietary vendor product. The toolset you opt for depends on the enterprise culture, i.e., does the enterprise have a mature technology team, and are they experienced working with open source tools and technologies (e.g., Kubernetes)? Or, is the organization more comfortable using a tool backed by a vendor (from the support perspective)? This decision also depends on the risk profile of the enterprise, as some organizations have a policy in place not to implement a technology stack that is unsupported by a vendor.
User Experience: Last, but not least, are end users—business and technical—comfortable with the user experience that the tool offers? User experience is one of the most underrated factors in terms of monitoring tool selection, and it is a key reason for the lack of adoption of the tool within organizations.
Best Practices
Below we’ve listed some of the best practices for monitoring based on our experience.
Don’t boil the ocean
As the enterprise starts migrating to the cloud, add any additional tool(s) in order to address gaps existing in the current state monitoring environment. Don’t try to boil the ocean and replace the current monitoring tool(s) with the “latest and greatest”. Chances are that your organization already has monitoring tools in place. The key is determining whether the tool can meet your future requirements and if it is a good fit for monitoring cloud-native workloads. If not, then complement the tool with additional tools instead of utilizing a blanket replacement. Over time, as workloads migrate to the cloud, use the strangler pattern in order to organically reduce the legacy monitoring tool(s) footprint.
Implement a POC (proof of concept)
One of the most tested approaches when introducing a new technology is trying out a “proof of concept“. This is especially true for a cloud environment, where cost barriers to implement a POC are significantly lower. You don’t need to set up servers, procure hardware, and spend months preparing the POC environment. Identify the key workloads and/or scenarios for monitoring, including the KPIS/metrics that the tool should monitor and report on. Moreover, POC lends enterprises a great opportunity to see how easy, or difficult, it is to setup and configure monitoring. The effort spent implementing a POC will be well worth it, as you don’t want to know the tool isn’t as user-friendly and flexible as you thought when you reviewed the presentations!
Change Management
No matter what tool you opt for, or what the monitoring strategy is, ensure that the enterprise is well equipped and trained to utilize the tool. This holds true for both business and technical users of the tool. We’ve seen some enterprises cut corners on training and change the management aspect of the tool. This ultimately resulted in higher costs for the enterprise in the longer run.
Define KPIs/metrics
One of the main reasons we see enterprises struggle with their monitoring strategy is that they never defined the success criteria for monitoring. They never defined a business outcome from which to work backward. As a result, they had a monitoring “solution” in place, but not the end result they desired. A big part of the monitoring strategy is understanding “What” and “Why”. In other words, what do you intend to monitor, and why? In some cases, determining the monitoring KPIs and metrics led to a realization that the enterprise was actually looking for business process metrics and needed an analytics solution in order to complement their monitoring strategy. It’s always nice to know “what good looks like” before defining an enterprise monitoring strategy.
Conclusion
This post demonstrated how AWS tools and services can help enterprises monitor hybrid and on-premises environments, and how AWS can provide a single pane of glass for a holistic monitoring view. We walked through the steps for setting up hybrid environment monitoring, and described a common hybrid scenario for monitoring on-premises and AWS workloads. Furthermore, we discussed some key considerations for selecting the monitoring technology and toolset. And finally, we touched upon the best practices to follow when defining a monitoring strategy for your enterprise.
Using ELB Access Logs and AWS Application Cost Profiler to track tenant cost of shared AWS Infrastructure
=======================
In our previous post on AWS Application Cost Profiler (ACP), we demonstrated how application owners instrument a serverless application with tenant metadata in a contextual format using AWS X-Ray. This tenant metadata is necessary for ACP to generate a granular cost breakdown of shared AWS resources used by multi-tenant applications. These granular cost insights let customers running multi-tenant applications accurately understand the per-tenant usage and associated costs of shared resources within the application. Using this data, Independent Software Vendors (ISVs) can develop go-to-market strategies with tier-based support or consumption-based pricing for their products, and effectively manage the costs of a multi-tenant architecture model. Additionally, organizations running multi-tenant applications can use the data to define accurate cost allocation models for chargeback purposes.
As previously noted, ACP requires application owners to instrument their application for tenant metadata in a contextual format. However, it’s not always feasible for customers to update large swaths of application code to generate the necessary tenant metadata. This post demonstrates how you can leverage the access logs of your Application Load Balancer (ALB) to extract the tenant usage metadata of multi-tenant applications running behind an ALB without the need to instrument the code of the application.
Solution Overview
Many customers run their web application code behind an ALB to automatically distribute incoming application traffic across multiple targets, such as Amazon EC2 instances, containers, IP addresses, and AWS Lambda functions. Elastic Load Balancing provides access logs that capture detailed information about requests sent to your load balancer. Each log entry contains information, such as the time the request was received, the client’s IP address, request processing time, and request path.
Multi-tenant applications will typically include a tenant identifier in the initial request of the application’s authentication process, which is recorded in the request path field of the ALB access logs. AWS Glue is a serverless data integration service that can be used to build extract, transform, and load (ETL) pipelines. Using AWS Glue lets you extract the tenant identifier along with the client IP address from the ALB access logs. Subsequent requests made from that IP address can be correlated to the extracted tenant identifier. Since the ALB access logs contain the request start and stop times, we can record the usage period of each request and link that request to a tenant ID based on the IP address. Assuming that all shared resources behind the ALB are tagged with a common cost allocation tag, we have enough information to generate the tenant metadata file without changing any of our existing application code!
Architecture
The following diagram illustrates this solution:
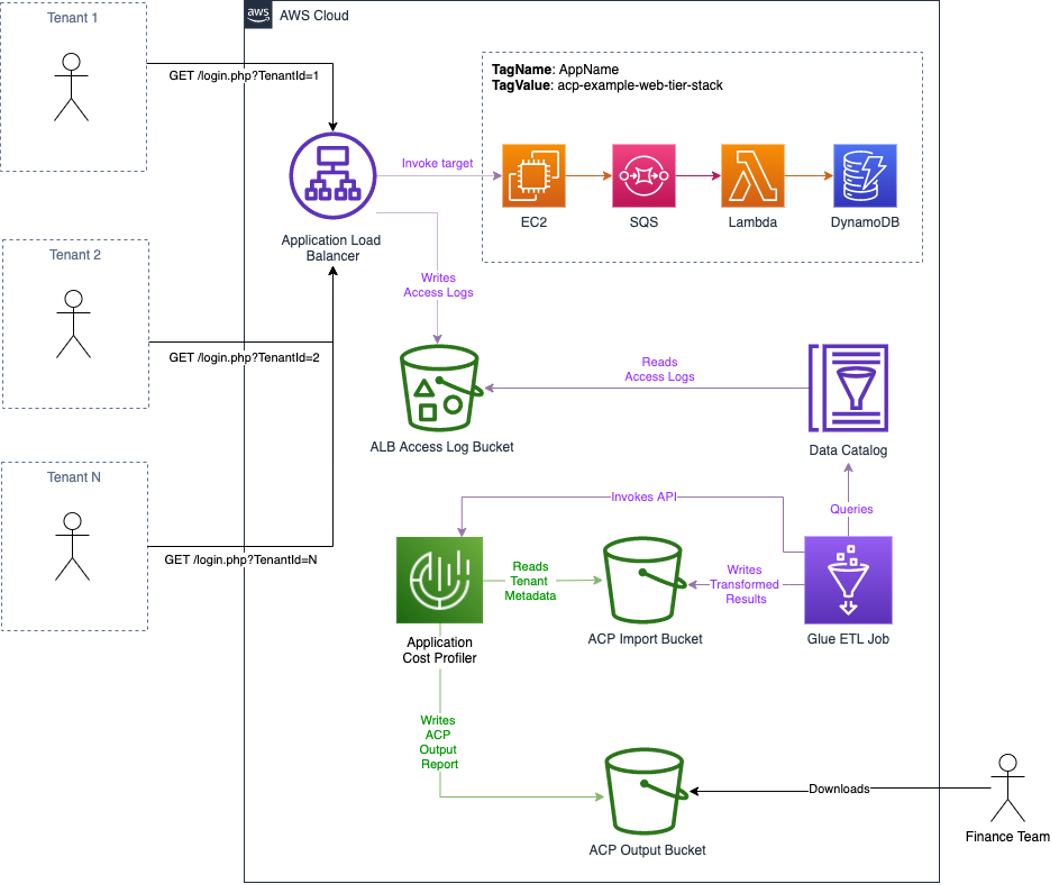
Figure 1: Architecture overview
The workflow is as follows:
- Tenants initiate authentication to the multi-tenant application. As part of this request flow, a tenant identifier is recorded in the ALB logs.
- After authentication, the tenants use the shared resources of the application behind the ALB. All of the shared resources are tagged with a common cost allocation tag.
- Access logs are written to the configured S3 bucket.
- Every hour a Glue Workflow is triggered:
- A Glue ETL job reads the ALB access log data from a Glue Data Catalog and transforms the data to the tenant usage format writing the output to an Amazon Simple Storage Service (S3) bucket with a bucket policy that grants ACP read access.
- ACP is notified of the new files ready for import, as is shown in the following figure.
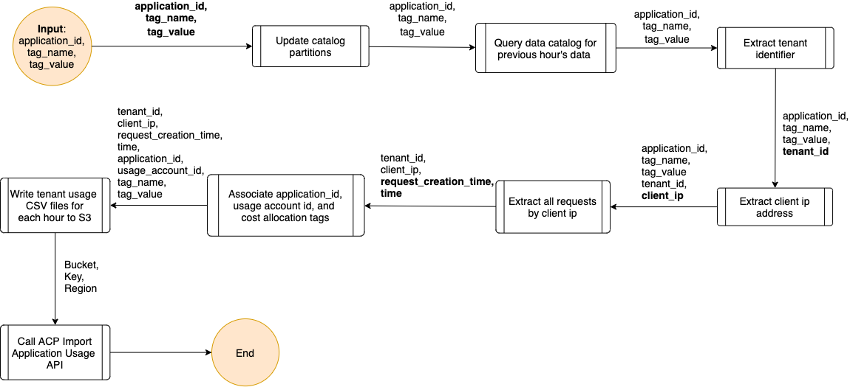
Figure 2: Logic for Glue ETL job
- Each day, ACP will retrieve the tenant usage files from Amazon S3, run the data through its data processing pipeline, and output the ACP report to the configured S3 bucket.
Deploy the infrastructure
To demonstrate this solution, this post provides a set of AWS CloudFormation templates that will setup the necessary S3 bucket for ACP, the Glue ETL infrastructure, and a multi-tier web application that can be used to generate sample data based on cost allocation tag.
Step 1: Configure the Application Cost Profiler for reporting consumption insights
ACP report configuration must be defined in the AWS Console, via the AWS CLI, or using one of the AWS SDKs. We will demonstrate how you configure this in the AWS console. The report configuration is to instruct ACP where to deliver the tenant cost reports. The destination is an S3 bucket with the proper permissions for ACP to write the reports.
Prerequisites
For this walkthrough, you need the following prerequisites:
An AWS account
AWS IAM user with console access and admin privileges
Enable Cost Explorer
Setup S3 bucket and report configuration
- Log in to the AWS Console.
- Verify that Cost Explorer has been enabled (important as ACP will not process tenant usage data without Cost Explorer being enabled).
- Select the following launch stack button to launch our first CloudFormation stack that will install and configure an S3 bucket with proper ACP permissions and server side encryption settings, an AWS Event Bridge rule, and an SNS Topic for ACP events that you can optionally subscribe to.

.
- Once the launch of the CloudFormation stack has completed, use the console search function to navigate to the “AWS Application Cost Profiler” landing page.
- In the ACP dashboard, choose “Get started now”.
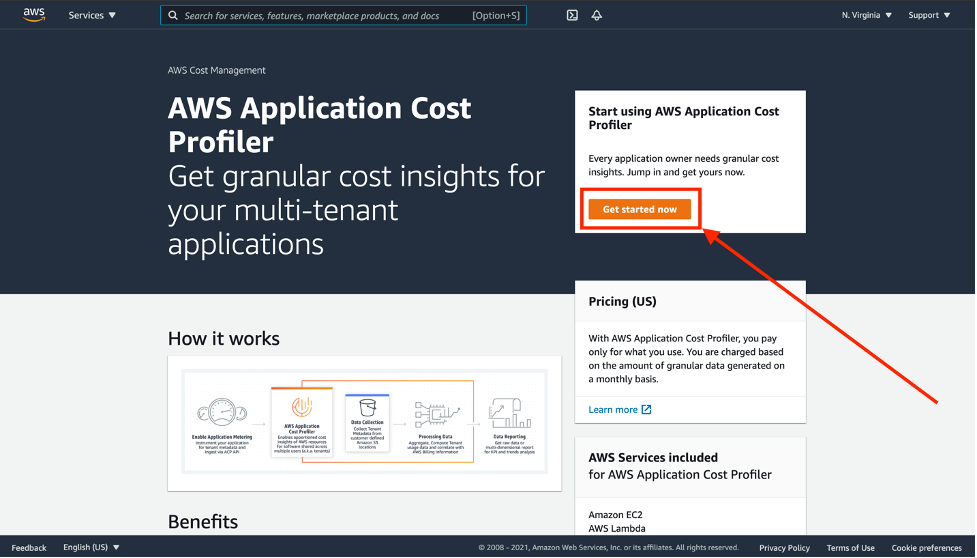
Figure 3: The landing page for AWS Application Cost Profiler
- Setup a new report configuration:
- Report Name – This is user defined and cannot be changed once saved.
- Report Description – This is a user defined description of the report configuration (optional).
- S3 Bucket Name – This is the S3 bucket where ACP will deliver the reports. This bucket was created using the previous CloudFormation template, and it can be found in the outputs under the key “AcpReportDeliveryBucket”. The bucket is named “acp-{REGION}–{ACCOUNT_ID}”, substituting {REGION} with the AWS region that the CloudFormation template was deployed to, for example us-east-1, and {ACCOUNT_ID} with the actual AWS account ID that was used to deploy the CloudFormation template, for example, “acp-us-east-1-987654321”. This report bucket name can also be found in the “Resources” section of the CloudFormation stack deployed above.
- S3 Prefix – This is the prefix in the S3 bucket used above where ACP will deliver the reports. The S3 Bucket deployed in the CloudFormation template above enabled write permissions for ACP to the “reports” prefix. Therefore, enter “reports” for the S3 prefix here.
- Time Frequency – Choose whether the report is generated on a Daily or Monthly cadence, or both.
- Report Output Format – Choose the type of file that will be created within your S3 bucket. If you choose CSV, then ACP creates a comma-separated values text file with gzip compression for the reports. If you choose Parquet, then a Parquet file is generated for the reports.
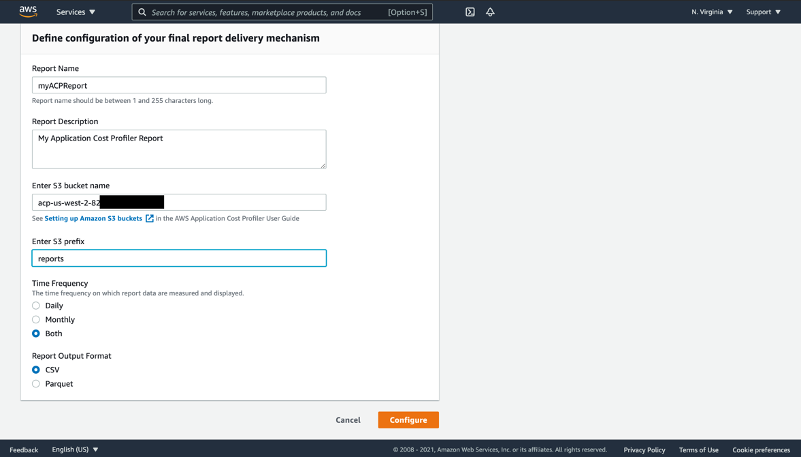
Figure 4: Define configuration of the ACP report delivery
- Select the “Configure” button. ACP will verify the existence of the S3 bucket defined above, as well as the services write permissions to the prefix defined above. If successful, then you will see a confirmation.
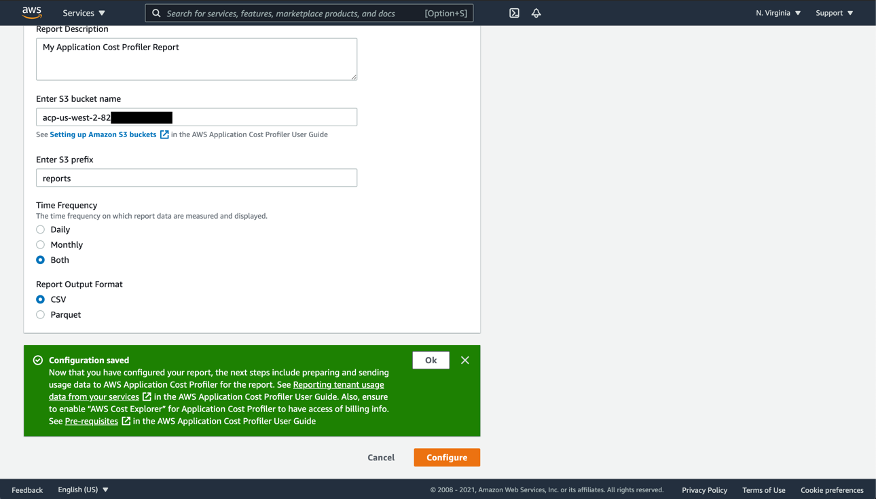
Figure 5: Confirmation after successfully configuring ACP report delivery
- Select “OK” to return to the ACP.
Now that you’ve set up an S3 bucket destination with permissions, and set up a report configuration within the ACP console, you are ready to prepare, upload, and import your tenant usage data.
Step 2: Deploy the sample web application
- Log in to the AWS Console.
- Select the following launch stack button to launch the second CloudFormation stack that will install and configure the sample web application.
 .
.
This creates a multi-tenant application you can use to generate sample ALB logs which will be transformed by the Glue ETL job and processed by ACP. The architecture of this web application consists of an Amazon Virtual Private Cloud (Amazon VPC) with two public subnets and two private subnets. An Application Load Balancer is deployed across the public subnets and routes web requests to EC2 instances deployed in each of the private subnets. These EC2 instances submit messages containing the tenant id extracted from each web request to an Amazon Simple Queue Service (Amazon SQS) queue. A Lambda function reads each message on the queue and increments a counter in an Amazon DynamoDB table. All of these resources are tagged with the same cost allocation tag. See the architecture diagram in Figure 6 in below for more details.
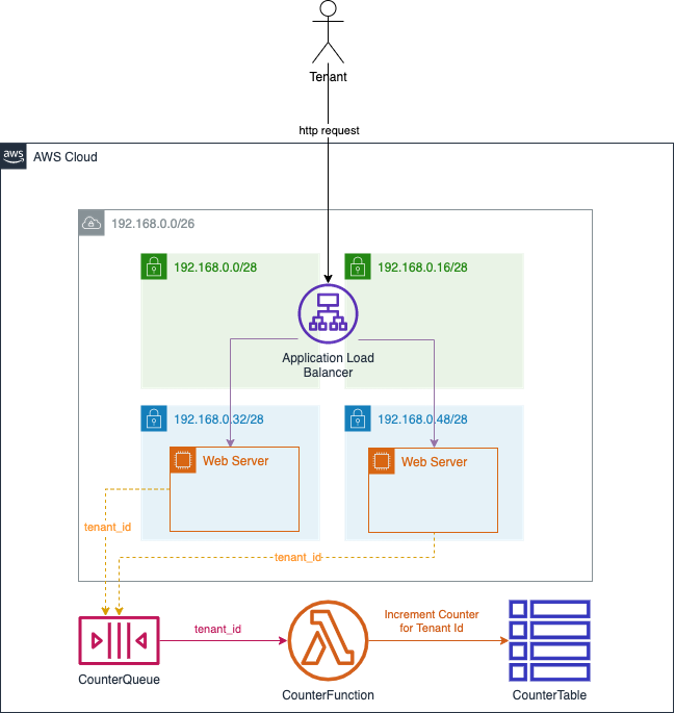
Figure 6: Architecture of sample multi-tenant web application used to generate ALB logs
- Once this CloudFormation template has completed deploying, navigate to the Outputs section of the stack and note the “WebTierInvokeUrl” value. It will be in the following format:
http://{your-alb-dns-name}/login.php
- Using the “WebTierInvokeUrl” identified above, open a web browser and paste the value into the location window. This will execute the sample web application.
- If no tenant ID is detected in the request cookie or URL query parameters, then a random tenant ID is assigned and the request is redirected back to the login page with the tenant ID as a query parameter.
- To generate request data, you can then page through a series of three pictures by clicking the links in each page.
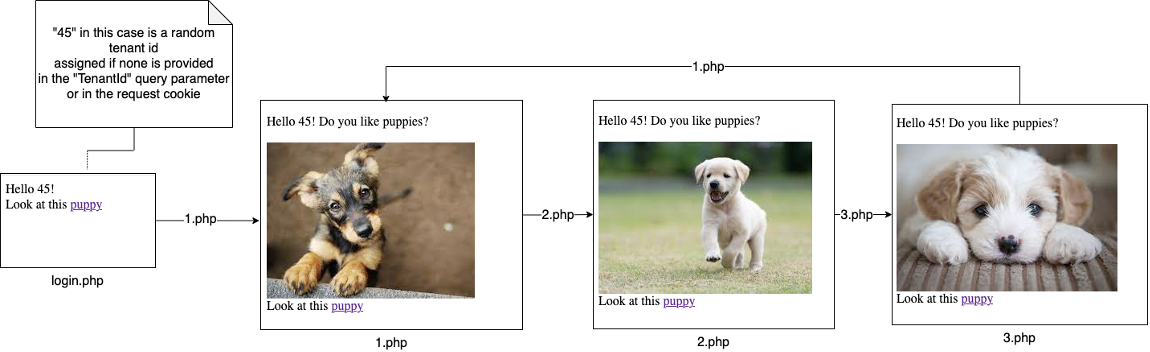
Figure 7: Page flow of sample web application
-
- Each request will sleep between zero and five seconds to simulate the variable processing time by the web application.
- Each request will also submit a message containing the request’s tenant ID to the Amazon SQS “CounterQueue” queue.
- The “CounterLambda” Lambda function is invoked when messages are placed on the “CounterQueue”. It reads the tenant ID from the message and increments an atomic counter on the DynamoDB “CounterTable” table for each request made for an individual tenant ID.
- To simulate different tenants, change the “TenantId=” value in the browser location window to a different ID, such as “TenantId=19” or “TenantId=30”. Press enter each time to execute the sample serverless application. Invoking this endpoint in a browser will cause the web application to execute and log the request in the ALB access logs. You can also use utilities like Apache JMeter to simulate multiple tenants. Here is an example JMeter script that works well with the Distributed Load Testing on AWS solution to quickly simulate the load generated by multiple tenants from different IP addresses that are similar to real world traffic*.
*Note: Use this sample JMeter script be sure to change the value on line 13 to the dns name of the sample web application load balancer:
<stringProp name="Argument.value">YOUR_ALB_DNS_NAME</stringProp>
Although it’s not a very efficient design, the sample application will generate usage across multiple AWS services. ACP can associate this usage to individual tenant IDs because all of the resources are tagged with a common cost allocation tag.
Step 3: Deploy the Glue ETL infrastructure
- Log in to the AWS Console.
- Select the following launch stack button to launch the next CloudFormation stack that will install and configure the Glue ETL infrastructure used to transform the ALB access logs into the tenant usage metadata format required by ACP.
 .
.
Once the CloudFormation stack has completed, in the N. Virginia/us-east-1 region use the console search function to navigate to the “AWS Glue” landing page. Using the navigation panel on the left side under the “Data catalog” section, select “Tables”. You will see a table with the name format “acp_alb_{ACCOUNT_ID}_{REGION}”.
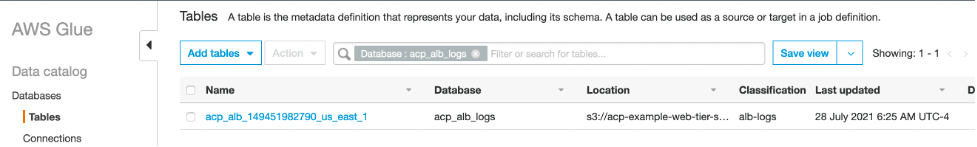
Figure 8: View of the Glue Data Catalog table containing ALB access log data
The data for this table is sourced from the ALB access logs for the sample application, and it is read by the Glue ETL script when generating the tenant usage data.
Again, using the navigation panel on the left side under the “ETL” section, select “Workflows”. Here you will see a workflow named “alb-logs-to-usage-etl-workflow”.
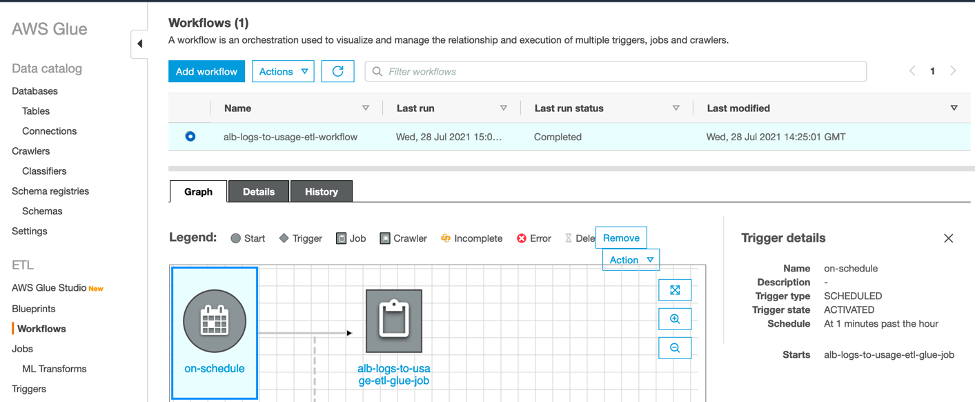
Figure 9: View of the Glue ETL Workflow
This workflow triggers a python script every hour to process new ALB logs and submit the generated usage data to ACP for processing.
Run the Glue ETL job
Manually navigate to AWS Glue Studio to run the Glue ETL job. AWS Glue Studio is a new graphical interface that makes it easy to create, run, monitor, extract, transform, and load (ETL) jobs in AWS Glue. Click “View Jobs”, and you will again see the “alb-logs-to-usage-etl-glue-job”. Check the box next to the job name, and then select the “Run job” button on the right.
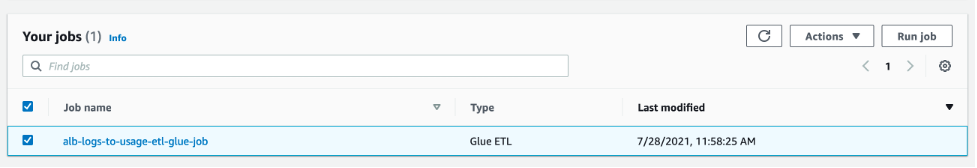
Figure 10: View of the Glue ETL jobs screen in AWS Glue Studio
To monitor the job’s progress, select the job name and navigate to the “Runs” tab.
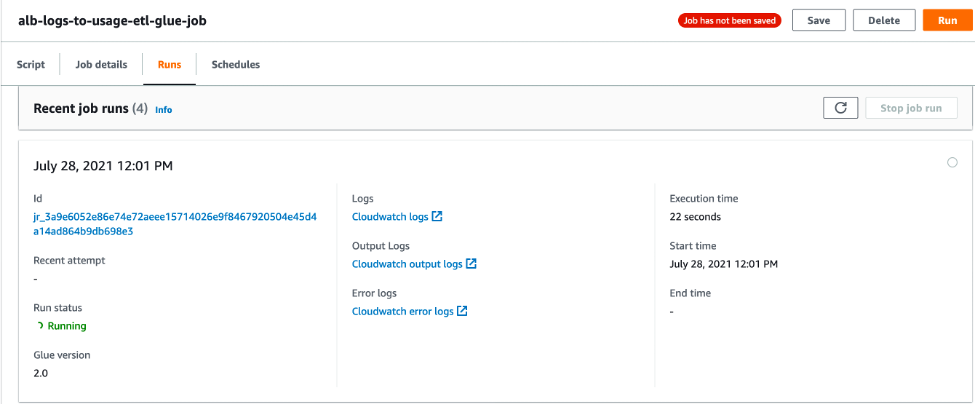
Figure 11: View of the running Glue ETL job in AWS Glue Studio
Once the job is complete, open the link labeled “CloudWatch output logs”. This will take you to the jobs log stream in Amazon CloudWatch logs. Select the log stream to view the output logs of the Glue job.
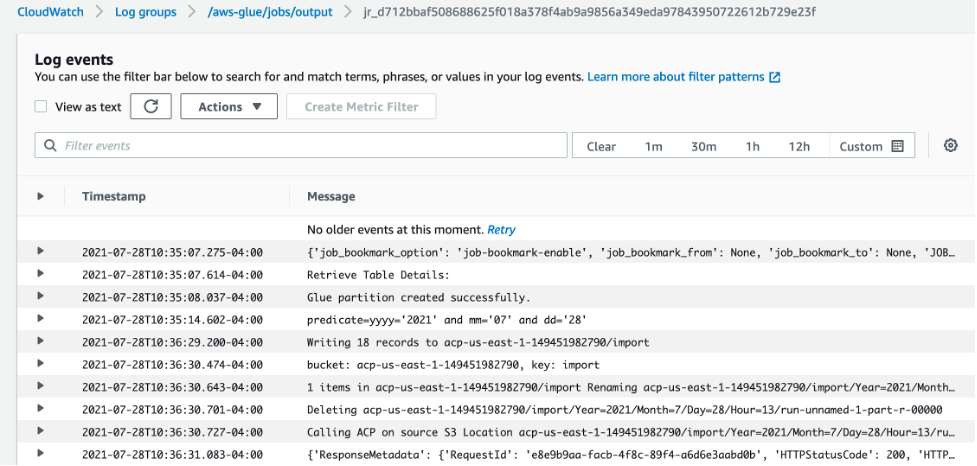
Figure 12: View of the Glue ETL job logs in Cloudwatch
Here you can see the job has transformed the ALB access logs and written the results to Amazon S3. If you navigate to this location in Amazon S3, then you can view a subset of the output results by using S3 Select.
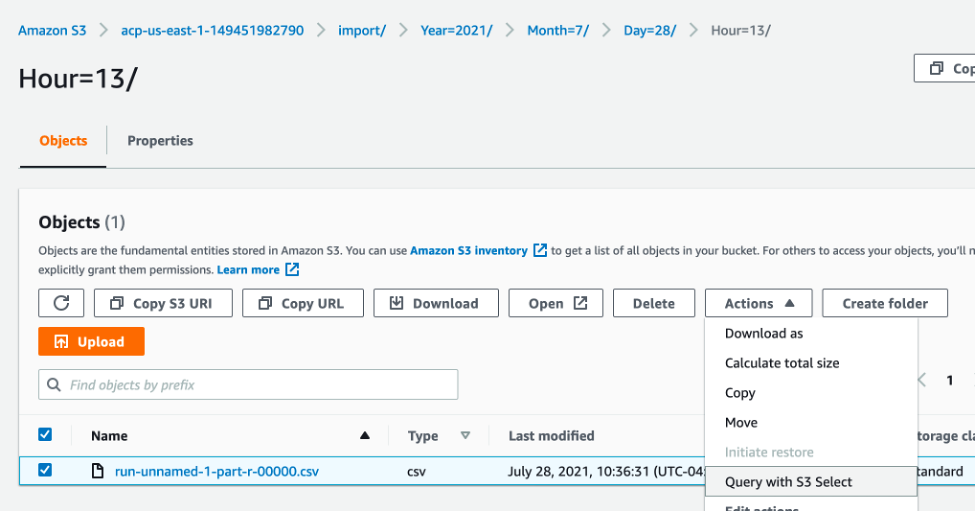
Figure 13: View of the transformed ALB access logs file in S3
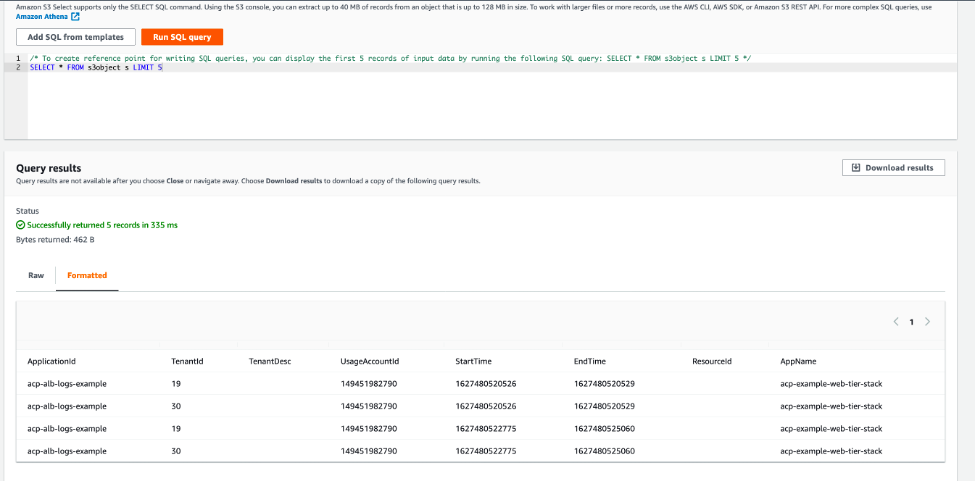
Figure 14: S3 Select results screen showing the transformed data
Application Cost Profiler Data
If the time frequency for your ACP report was set up to be daily, it can take up to 24 hours after the Glue ETL job calls the ImportApplicationUsage API for the ACP data to be available in the S3 report bucket and prefixed configured. Using the above CloudFormation setup, the ACP data will be placed in s3://acp-{REGION}–{ACCOUNT_ID}/reports/YYYY/MM/DD/part-*.csv.gz accordingly. An EventBridge event will also be generated when ACP data is available in the following format:
{
"version": "0",
"id": "01234567-EXAMPLE",
"detail-type": "Application Cost Profiler Report Generated",
"source": "aws.application-cost-profiler",
"account": "123456789012",
"time": "2021-03-31T10:23:43Z",
"region": "us-east-1",
"resources": [],
"detail": {
"message": "Application Cost Profiler report delivered in bucket: acp-us-east-1-123456789, key: reports/2020/05/01/ part-c744af14-57bd-4c51-b1d4-badc155ef7ef-c000.csv.gz"
}
}
The following data is available in the tenant cost csv file generated by ACP.
Table 2: AWS ACP Tenant Cost Breakdown Elements on output file
| Column name |
Description |
| PayerAccountId |
The management account ID in an organization, or the account ID if the account is not part of AWS Organizations. |
| UsageAccountId |
The account ID for the account with usage. |
| LineItemType |
The type of record. Always Usage. |
| UsageStartTime |
Timestamp (in milliseconds) from Epoch, in UTC. Indicates the start time of the period for the usage by the specified tenant. |
| UsageEndTime |
Timestamp (in milliseconds) from Epoch, in UTC. Indicates the end time of the period for the usage by the specified tenant. |
| ApplicationIdentifier |
The ApplicationId specified in the usage data sent to ACP. |
| TenantIdentifier |
The TenantId specified in the usage data sent to ACP. Data with no record in the usage data is collected in unattributed. |
| TenantDescription |
The TenantDesc specified in the usage data sent to ACP. |
| ProductCode |
The AWS product being billed (for example, AmazonEC2). |
| UsageType |
The type of usage being billed (for example, BoxUsage:c5.large). |
| Operation |
The operation being billed (for example, RunInstances). |
| ResourceId |
The resource ID or ARN for the resource being billed. |
| ScaleFactor |
If a resource is over-allocated for an hour, for example, then the usage data reported is equal to two hours instead of one hour, and a scale factor is applied to make the total equal the actual billed amount (in this case, 0.5). This column reports the scale factor used for the specific resource for that hour. The scale factor is always greater than zero (0) and less than or equal to one. |
| TenantAttributionPercent |
The percentage of the usage attributed to the specified tenant (between zero (0) and 1). |
| UsageAmount |
The amount of usage attributed to the specified tenant. |
| CurrencyCode |
The currency that the rate and cost are in (for example, USD). |
| Rate |
The billing rate for the usage, per unit. |
| TenantCost |
The total cost for that resource for the specified tenant. |
| Region |
The AWS Region of the resource. |
| Name |
If you created resource tags for your resources on the Cost and Usage report, or through the resource usage data, then the Name tag is shown here. For more information about resource tags, see Resource tags details in the Cost and Usage Report User Guide. |
The following is an example of the actual csv output in the ACP report as viewed via S3 Select:
PayerAccountId,UsageAccountId,LineItemType,UsageStartTime,UsageEndTime,ApplicationIdentifier,TenantIdentifier,TenantDescription,ProductCode,UsageType,Operation,ResourceId,ScaleFactor,TenantAttributionPercent,UsageAmount,CurrencyCode,Rate,TenantCost,Region
123456789,123456789,Usage,2021-04-14T22:00:00.000Z,2021-04-14T23:00:00.000Z,123,789,exampleTenantDescription,AWSLambda,USE1-Request,Invoke,arn:aws:lambda:us-east-1:123456789:function:TenantLambdaFuction,1,0.521637766,116.8468595,USD,0.0000000167,0.0000019500,us-east-1
123456789,123456789,Usage,2021-04-14T22:00:00.000Z,2021-04-14T23:00:00.000Z,123,789,exampleTenantDescription,AWSLambda,USE1-Lambda-GB-Second,Invoke,arn:aws:lambda:us-east-1:123456789:function:TenantLambdaFuction,1,0.521637766,11053.02435,USD,0.0000000167,0.0001845860,us-east-1
123456789,123456789,Usage,2021-04-14T22:00:00.000Z,2021-04-14T23:00:00.000Z,123,456,exampleTenantDescription,AWSLambda,USE1-Request,Invoke,arn:aws:lambda:us-east-1:123456789:function:TenantLambdaFuction,1,0.022431334,5.024618778,USD,0.0000000167,0.0000000839,us-east-1
123456789,123456789,Usage,2021-04-14T22:00:00.000Z,2021-04-14T23:00:00.000Z,123,456,exampleTenantDescription,AWSLambda,USE1-Lambda-GB-Second,Invoke,arn:aws:lambda:us-east-1:123456789:function:TenantLambdaFuction,1,0.022431334,475.2993271,USD,0.0000000167,0.0000079400,us-east-1
This csv file can then be queried directly using Amazon Athena or integrated into your existing analytics and reporting tools, such as Amazon Quicksight as in the following example.
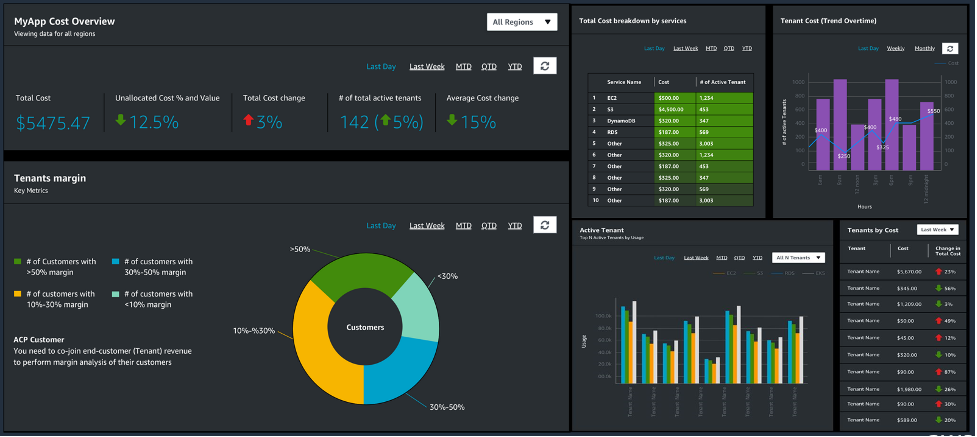
Figure 15: Example of an Amazon QuickSight dashboard created from the ACP report
Cost
See the ACP pricing page for pricing details. For our example, ACP costs remained inside the free tier when running the application for one month. Additional costs were associated with running the example web application and the Glue ETL job.
Tear Down
To tear down the project delete the following stacks via the CloudFormation console:
acp-example-analytics-stack
acp-example-web-tier-stack
ApplicationCostProfilerBucketStack
Conclusion
In this walkthrough, you have setup a new AWS ACP report configuration, including a destination S3 Report Bucket with appropriate permissions. Then, you completed the process of generating tenant usage data for a sample web application, imported the usage data into ACP, and received the result reports.
Our service team provides reference implementation guidance for different architecture patterns to facilitate the instrumentation. We also have a dedicated Solution Architects team to support you through the instrumentation and facilitate onboarding. If you need support for onboarding, then reach out to us at aws-acp@amazon.com or contact your account team to get support.
To further understand the value and importance of cost per-tenant, please refer to the Calculating Tenant Costs in a SaaS Environment post, as well as the AWS re:Invent session that outlines the basic approach and challenges associated with capturing this information.
Root and Nested Organizational Unit Support for Customizations for AWS Control Tower
=======================
Customers often use AWS accounts as a boundary to segregate their workloads, environments, business units, compliance requirements, or any type of logical isolation that suits their business. An AWS account serves as a hard boundary by design – each account is its own logical entity with controls, limits, and guardrails. Large customers typically have many AWS accounts serving various functions, and, at that scale, it becomes difficult for them to manage and govern accounts on their own.
Over the years, we have introduced various services to help customers grow and scale their AWS resources. Recently, we introduced a new feature that lets you scale further by providing added customization when managing your AWS accounts. First, we will introduce you to various services and concepts, and then we will dive into the purpose of this post.
AWS Organizations lets you group your accounts into organizational units (OUs) that you can centrally manage. Apply tag polices to classify or track resources in your organization, and provide attribute-based access control for users or applications. In addition, you can delegate responsibility for supported AWS services to accounts so that users can manage them on behalf of your organization.
AWS Control Tower creates your landing zone using AWS Organizations, bringing together ongoing account management and governance, as well as implementation best practices based on AWS’ experience working with thousands of customers as they move into the cloud. AWS Control Tower lets builders provision new AWS accounts in a few clicks, while you have peace of mind knowing that your accounts conform to company-wide policies. AWS Control Tower provides guardrails that can be attached to your OUs to simplify governance.
The Customizations for AWS Control Tower (CfCT) solution combines AWS Control Tower and other highly-available, trusted AWS services to help customers more quickly set up a secure, multi-account AWS environment using AWS best practices. You can easily add customizations to your AWS Control Tower landing zone using an AWS CloudFormation template and service control policies (SCPs). You can deploy the custom template and policies to individual accounts and OUs within your organization. This solution integrates with AWS Control Tower lifecycle events to make sure that resource deployments remained synced with your landing zone. For example, when a new account is created using the AWS Control Tower account factory, the solution makes sure that all of the resources attached to the account’s OUs will be automatically deployed.
On November 18, 2021, we announced the support for AWS Organizations nested OUs in AWS Control Tower. This feature provides further customization between groups of accounts within your OUs, thereby giving you more flexibility when applying policies for different workloads or applications. This becomes an important scaling mechanism as you add accounts in your AWS Control Tower environment, and as policies applied at the OU-level automatically apply to accounts within the OU. In the AWS Control Tower console, the governance status of each OU is representative of the status of the OUs nested beneath it in the hierarchy. To learn more about this feature, considerations, and limitations, visit the Nested OUs in AWS Control Tower section of the AWS Control Tower User Guide.
We are excited to announce the support for root as an OU and nested OUs deployments in the CfCT solution. This lets you deploy to nested OUs, thereby taking advantage of the added flexibility that AWS Control Tower nested OUs offers. CfCT has also added a feature allowing deployments to your entire organization by specifying the organization Root OU instead of listing each OU independently as previously required. Both features, Root when Root OU is used and nested OU, are fully supported for CloudFormation StackSets and SCPs.
In this post, we will demonstrate how you can leverage the new nested OU support for CfCT, which lets you create a robust OU structure that makes more sense to you and your business requirements. We will also demonstrate how to deploy resources and apply SCPs to these nested OUs and organization Root, should you need this ability.
Example Use Case
In the following configuration we want to enable our developers to freely use any service during the development of our application “Pet Store”, but we need some budgets in place to make sure that the expense does not get out of control. We would like to put an AWS Budget in place with notification to the developer’s manager when the forecasted expense will exceed 80% of $1,000 USD. In addition, we want to make sure that any budgets we put in place for the entire organization are not modified except via the CfCT pipeline, so that changes can be tracked.
We will walk you through the following use case where the root OUs, and nested OUs can be used with AWS Control Tower and CfCT using both CloudFormation templates and SCPs.
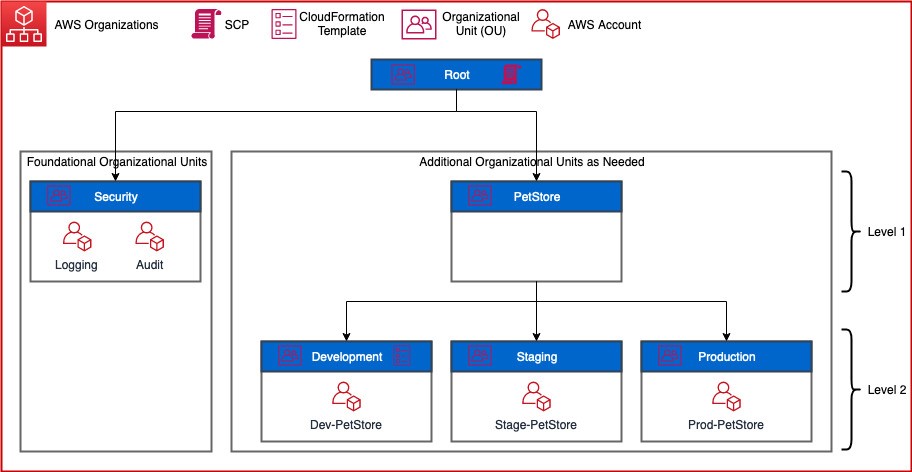
Figure 1: Architecture of Pet Store with SCP applied to the root OU
Solution Overview
Foundational OUs – This is the OU that AWS Control Tower deploys when it’s setup in your account. Within this OU, it will place two accounts that it creates: Logging and Audit. Note that some of the names could be different because AWS Control Tower lets you modify names.
Additional OUs as Needed – This is the structure you create that works best for your organization. Above, I have decided to have my parent OU named for the project, PetStore. Within each nested OU (Development, Staging, and Production) I have a single account.
Deploy a CloudFormation template to my development OU within my parent OU of PetStore, thereby setting the AWS Budget.
Deploy an SCP to the root OU that limits changes to AWS Budgets outside of the CfCT pipeline.
Best Practices
You may only go five levels deep, which is consistent with AWS Organizations, and AWS Control Tower.
If you specify the Root OU in the CfCT manifest.yaml, then any other Ous should not be included as they will be ignored.
If you are specifying the Root OU, then only the accounts enrolled in AWS Control Tower will be deployed targets.
When specifying the OU path, you should exclude the Root OU
Incorrect: Root:PetStore:Development
Correct: PetStore:Development
Prerequisites
- AWS Control Tower – Please make sure that you have AWS Control Tower deployed and it is upgraded to the minimum version of 2.7.
- CfCT – Please ensure you have the the minimum version (2.2.0) deployed which released in December of 2021
- Please review the following blog for concepts and steps which we will not cover, Fast and Secure Account Governance with Customizations for AWS Control Tower
- Please ensure AWS Cost Management is configured by following this link to you AWS Console. If the page displays “Since this is your first visit, it will take some time to prepare your cost and usage data. Please check back in 24 hours” it can take up to 24 hours for you to have a successful deployment.
Solution Walkthrough
We will demonstrate the deployment of a CloudFormation template to a nested OU for setting up AWS Budgets, and then we will deploy an SCP limiting the modification and creation of AWS Budges outside of the CfCT pipeline.
CloudFormation Template Example
Create a CloudFormation template named pet-store-developer-budget.yaml under the templates folder of your deployed CfCT pipeline with the following contents.
---
AWSTemplateFormatVersion: “2010-09-09”
Description:
This template creates a budget using parameters supplied.
**WARNING** This template creates a budget resource and related resources. You will be billed for the AWS resources used if you create a stack from this template.
Parameters:
BudgetName:
Description: What is the budget name you would like used?
Type: String
MinLength: 1
BudgetNotificationEmail:
Description: Who would you like notified regarding this budget?
Type: String
AllowedPattern: ^[a-zA-Z0-9.!#$%&’*+/=?^_`{|}~-]+@[a-zA-Z0-9](?:[a-zA-Z0-9-]{0,61}[a-zA-Z0-9])?(?:\.[a-zA-Z0-9](?:[a-zA-Z0-9-]{0,61}[a-zA-Z0-9])?)*$
MinLength: 5
BudgetAmount:
Description: What should the budget amount be in USD?
Type: String
AllowedPattern: ^[0-9]*$
MinLength: 2
BudgetNotificationType:
Description: Should the budget be evaluated based on actual or forecasted spend?
Type: String
AllowedValues:
- FORECASTED
- ACTUAL
Resources:
AccountBudget:
Type: “AWS::Budgets::Budget”
Properties:
Budget:
BudgetName: !Ref BudgetName
BudgetType: “COST”
BudgetLimit:
Amount: !Ref BudgetAmount
Unit: “USD”
TimeUnit: “MONTHLY”
NotificationsWithSubscribers:
- Notification:
NotificationType: !Ref BudgetNotificationType
ComparisonOperator: “GREATER_THAN”
Threshold: “80”
ThresholdType: “PERCENTAGE”
Subscribers:
- SubscriptionType: “EMAIL”
Address: !Ref BudgetNotificationEmail
Edit the manifest.yaml file under the root of your pipeline configuration with the following under resources:
Note that under organizational_units I have a list with a single item which contains my parent OU (level 1) with my nested OU (level 2) on the same line separated with a colon. This is how we address nested OUs within the pipeline.
  - name: PetStore-Developer-Budget
description: Developer budget for Pet Store product
resource_file: templates/pet-store-developer-budget.yaml
deploy_method: stack_set
parameters:
- parameter_key: BudgetName
parameter_value: Pet Store Developer Budget
- parameter_key: BudgetNotificationEmail
parameter_value: <YOUR EMAIL HERE>
- parameter_key: BudgetAmount
parameter_value: ‘1000’ # Quote for string value
- parameter_key: BudgetNotificationType
parameter_value: FORECASTED
deployment_targets:
organizational_units:
- PetStore:Development
When complete, your manifest should look like mine.
---
#Default region for deploying Custom Control Tower: Code Pipeline, Step functions, Lambda, SSM parameters, and StackSets
region: <YOUR REGION HERE>
version: 2021-03-15
# Control Tower Custom Resources (Service Control Policies or CloudFormation)
resources:
- name: PetStore-Developer-Budget
description: Developer budget for Pet Store product
resource_file: templates/pet-store-developer-budget.yaml
deploy_method: stack_set
parameters:
- parameter_key: BudgetName
parameter_value: Pet Store Developer Budget
- parameter_key: BudgetNotificationEmail
parameter_value: <YOUR EMAIL HERE>
- parameter_key: BudgetAmount
parameter_value: ‘1000’ # Quote for string value
- parameter_key: BudgetNotificationType
parameter_value: FORECASTED
deployment_targets:
organizational_units:
- PetStore:Development
SCP Example
Create the SCP policy file using JSON named budget-scp.json under the policies folder of your deployed CfCT pipeline with the following contents:
This SCP will do the following:
{
“Version”: “2012-10-17”,
“Statement”: [
{
“Sid”: “VisualEditor0”,
“Effect”: “Deny”,
“Action”: “budgets:ModifyBudget”,
“Resource”: “arn:aws:budgets::*:budget/*”,
“Condition”: {
“ArnNotLike”: {
“aws:PrincipalARN”: [
“arn:aws:iam::*:role/AWSControlTowerExecution”
]
}
}
},
{
“Sid”: “VisualEditor1”,
“Effect”: “Deny”,
“Action”: [
“budgets:CreateBudgetAction”,
“budgets:ExecuteBudgetAction”,
“budgets:DeleteBudgetAction”,
“budgets:UpdateBudgetAction”
],
“Resource”: “arn:aws:budgets::*:budget/*/action/*”,
“Condition”: {
“ArnNotLike”: {
“aws:PrincipalARN”: [
“arn:aws:iam::*:role/AWSControlTowerExecution”
]
}
}
}
]
}
Edit the manifest.yaml file under the root of your pipeline configuration with the following under resources, just like you did for the CloudFormation step.
  - name: Budget-SCP
description: Prevent modification or update to AWS Budgets
resource_file: policies/budget-scp.json
deploy_method: scp
deployment_targets:
organizational_units:
- Root
Complete manifest.yaml
You should now have a manifest like mine as follows, pet-store-developer-budget.yaml copied to the templates folder, and budget-scp.json copied to the policies folder.
---
#Default region for deploying Custom Control Tower: Code Pipeline, Step functions, Lambda, SSM parameters, and StackSets
region: <YOUR REGION HERE>
version: 2021-03-15
# Control Tower Custom Resources (Service Control Policies or CloudFormation)
resources:
- name: PetStore-Developer-Budget
description: Developer budget for Pet Store product
resource_file: templates/pet-store-developer-budget.yaml
deploy_method: stack_set
parameters:
- parameter_key: BudgetName
parameter_value: Pet Store Developer Budget
- parameter_key: BudgetNotificationEmail
parameter_value: <YOUR EMAIL HERE>
- parameter_key: BudgetAmount
parameter_value: ‘1000’ # Quote for string value
- parameter_key: BudgetNotificationType
parameter_value: FORECASTED
deployment_targets:
organizational_units:
- PetStore:Development
- name: Budget-SCP
description: Prevent modification or update to AWS Budgets
resource_file: policies/budget-scp.json
deploy_method: scp
deployment_targets:
organizational_units:
- Root
The following is a screenshot of my folder structure. Yours should look very similar at this point.
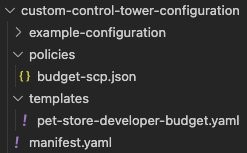
Figure 2: File and folder layout
Once your configuration has been successfully deployed, you should see a screen like mine (as follows) if you go to CodePipeline → Pipelines → Custom-Control-Tower-CodePipeline.
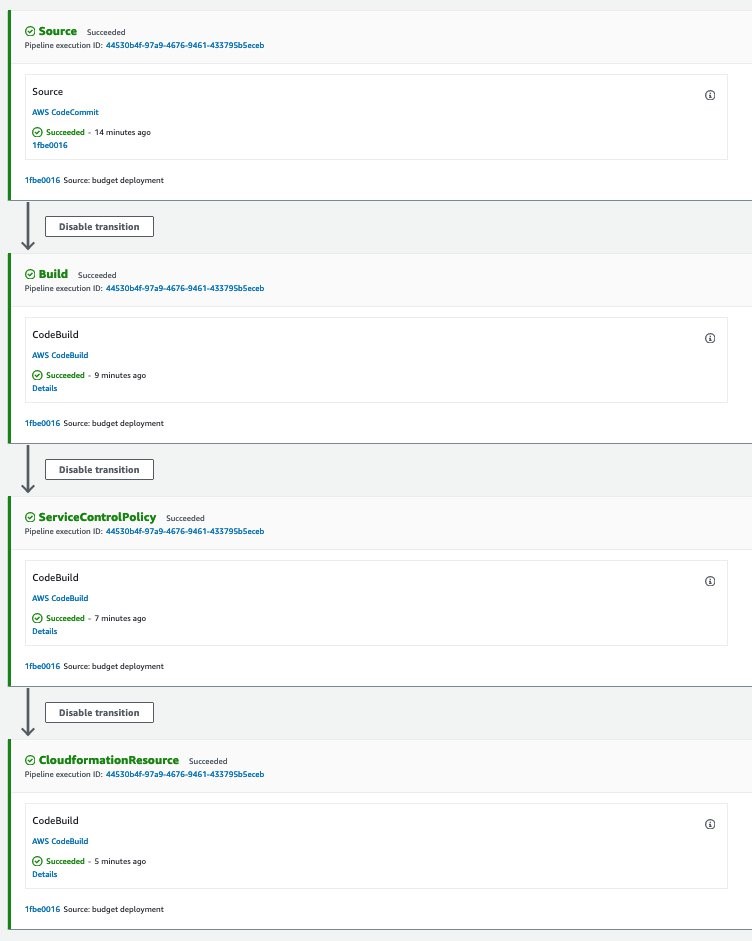
Figure 3: Successful CodePipeline deployment
Verification
Make sure that your manifest.yaml has all of the same settings, the CloudFormation template, and the SCP in place, and then update your code repository. Once updated, your pipeline will run deploying the configuration to the nested OUs.
Once the CloudFormation template to our nested OU is deployed, then we can log in to the Dev-PetStore account, go to CloudFormation → Stacks →. Find the stack with PetStore-Devloper-Budget in the name→ Resources tab →. And then select Pet Store Developer Budget.
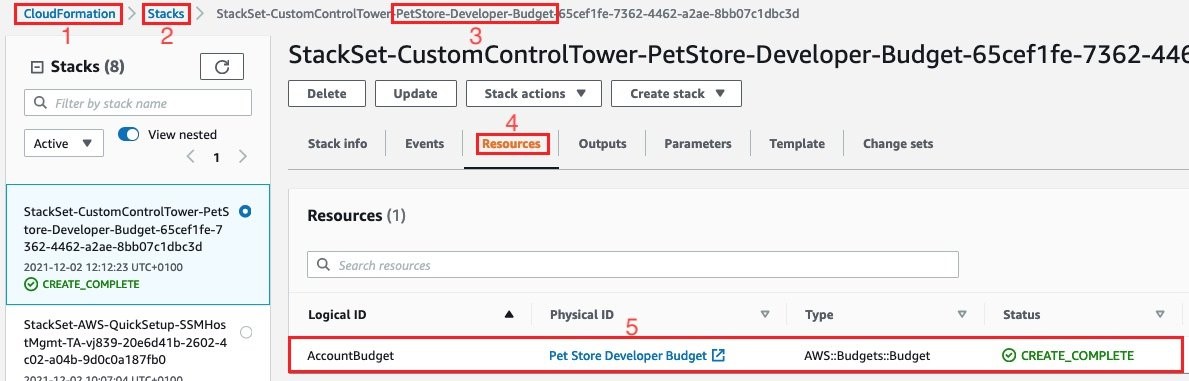
Figure 4: PetStore-Devloper-Budget CloudFormation Resource
You can now explore the budget that was deployed using nested OUs via CfCT.
From the previous step, selecting #5 would bring us to the following screen, and would test if the SCP that I put in place is working from the Root OU of AWS Organizations. Select the Pet Store Developer Budget → Actions → Delete.
You should now get an error, such as the following one, that indicates an error deleting the budget. This is because of the protections that we put in place for this budget via the SCP.
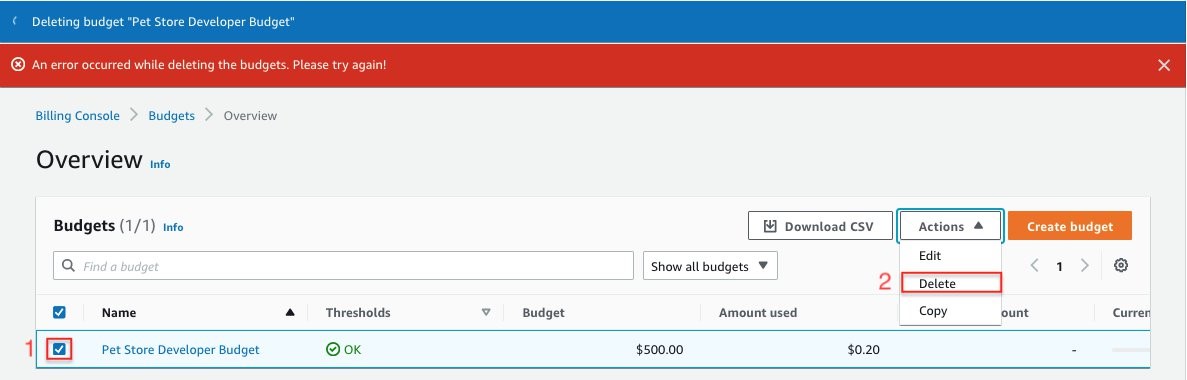
Figure 5: Trying to delete the budget results in error
Clean-up
- Remove the resources that you put in the manifest.yaml file by deleting the lines, and refer to the Complete Manifest section above.
- Remove the templates/pet-store-developer-budget.yaml file from the pipeline.
- Remove the policies/budget-scp.json from the pipeline.
- Make sure that the pipeline completes successfully.
- Delete the CloudFormation StackSet Instances of CustomControlTower-PetStore-Developer-Budget by following these instructions.
- Delete the CloudFormation StackSet CustomControlTower-PetStore-Developer-Budget by following these instructions.
Conclusion
We have walked you through the process of deploying both a CloudFormation template and an SCP to nested AWS OUs. Using this new feature from CfCT, we can create OUs that make more sense to you and your organization. Try out this solution and let us know your thoughts in the comments section.
For more information about the solution, see the CfCT Implementation Guide for a description of solution components, step-by-step directions, cost estimates, and more. Visit our GitHub repository to download the source code for this solution, and to share your customizations with others as needed. For more solutions like this one, visit the AWS Solutions Library.
A beginners’ guide for Finance and Operations teams in their cloud migration journey
=======================
Finance teams maintain a unique position in their organization enabling them to accelerate strategic business imperatives. As custodians of capital, they play a crucial role in deciding where to place strategic bets. A cloud migration comes with many unknowns, variables, and new capabilities that business teams must unpack for a seamless cloud journey. This blog post discusses some areas that finance as well as operations teams should keep in mind while approaching a migration to the cloud.
Is cloud a cost savings lever or a growth accelerator?
The value of a cloud migration is more than just cost savings, organizations can realize increased value in the areas of staff productivity, operational resiliency and business agility that lead to increased innovation and reduced time to market in launching new features and products. With cloud adoption, infrastructure procurement and consumption are not beholden to a chain of operational and financial dependencies. Cloud technology and product teams are not just builders but operators and owners of their products. They now have responsibilities for many of the activities historically associated with finance and operations teams including procurement and deployment. The ability to spin up and tear down experiments improves agility for technology teams and enables them to innovate faster.
What is the correct migration Strategy?
The short answer is that finance, operations, and business teams should not solve for all variables upfront. It is s essential to have the right migration strategy for your cloud migration and these strategies span across time and cost investments while returning varying degrees of cloud value realization. Often, organizations analyze or overanalyze to create the perfect strategy for migration leading to delays and lost opportunity. The project cost can be directly proportional to the duration of the migration. During a cloud migration phase, organizations have to pay for both on-premises as well as cloud costs for running their workloads. This is known as a “double-bubble cost.” Organizations should strive for incremental value and not wait for the perfect migration strategy. They should take the time to prioritize their workloads and then apply an appropriate migration option for those prioritized workloads to shorten migration cycles while simultaneously setting the foundation for continuously modernizing their cloud workloads. The migration to the cloud is not the end but the beginning of an organization’s digital transformation journey.
What operational mechanisms should be in place for an effective cloud migration?
Many enterprises build business cases by employing a Return On Investment (ROI) metric as justification for a cloud migration. This ROI includes costs for running on AWS, cloud optimization opportunities and a roadmap to maximize cloud value based on managed services such as serverless and/or AI/ML. Once finance teams approve the business case that was used to create the ROI, they need mechanisms to track accrued costs to ensure that the ROI is actually realized. Establishing operational control mechanisms right from the inception of the migration engagement ensures cost transparency and maintains accountability across all parties (finance, technology, operations) involved in the migration.
Finance teams should focus on developing mechanisms for measuring and monitoring cloud spend for workloads or applications involved in the migration. AWS can enable finance teams to create this level of visibility. Adopting AWS Organizations helps enterprises to centrally manage and govern their cloud environment as their cloud investments grow and scale. Implementing a multi-account structure by using AWS Organizations coupled with AWS cost categories and tagging best practices enables allow finance teams to understand better how business units and functional groups are utilizing AWS resources. Finance teams can then start to correlate their AWS spend with business revenue to capture a snapshot of value realization.
Finance and operations teams can further set various financial guardrails on overall spend projections at the AWS service or an AWS account level to reduce the risk of overspending by using AWS Budgets. AWS Budgets allows you to set a budget and alerts you when you exceed (or are forecasted to exceed) your budgeted cost or usage amount. Using AWS Budgets actions you can also define the action you want to take within your account if your cost or usage exceeds a configured threshold or is forecasted to exceed that threshold. These actions can be executed automatically or with approval to reduce unintentional overspending. Refer to How to manage cost overruns in your AWS multi-account environment for insight on how to manage your cost overruns.
How can finance align supply and demand to accelerate business growth?
With the cloud’s ‘pay-as-you-go’ model, it opens up new possibilities to connect your company’s business demand with cloud operating costs. The move to cloud enables visibility and new cost management capabilities to distinguish good spending versus unproductive spending on your cloud deployment.
Business metric unit costs relevant to your organization can be per transaction, cost per trade, cost per ride, cost per flight, or cost per widget. Measuring and reporting costs using a unit metric Key Performance Indicator (KPI) provides a more accurate representation of how efficient is your cloud usage. It provides a data-driven determination to assess if the increase in spend is a sign of success or a sign that something needs to be investigated for finance to align supply and demand in order to accelerate business growth
Are there additional levers to optimize cloud spend?
AWS provides enterprises with multiple ways to consume AWS services based on their business needs. Taking advantage of various discount programs like Savings Plans and Reserved Instances are crucial to driving down the cost per unit on your AWS bill. For example, Reserved Instances are ideal for applications with steady-state or predictable usage and can provide up to a 72% discount compared to on-demand pricing, while Amazon EC2 Spot can reduce costs by up to 90% on compute instances fault-tolerant workloads. In addition to these billing discount strategies, it is essential to have governance to monitor and control your AWS environment. These include technical mechanisms such as rightsizing instances, deleting unused EBS volumes, implementing Amazon S3 lifecycle policies, and fine tuning Auto Scaling policies. Refer to this blog post that describes 10 things you can do to reduce your AWS costs.
Conclusion
In summary, there are many questions that finance and operations teams need to answer when they embark on their cloud journey in partnership with their business teams. In this blog post we have attempted to provide examples of some of those common questions and outlined answers to them. Moving to the cloud can be not just about cost savings but rather accelerating your organization’s innovation journey. You should take a programmatic approach, with proper operational control mechanisms in place from the beginning for a successful cloud journey. Finally, remember to strive for incremental value by getting started sooner instead of waiting for the perfect migration strategy that encompasses every migration workload.
Managing configuration compliance across your organization with AWS Systems Manager Quick Setup
=======================
When running your applications on AWS, the number of resources you use increases as the demand of your applications keeps growing. Eventually, keeping track of your AWS resources and the relationships between them becomes challenging from a governance perspective. AWS Config lets you more easily assess, audit, and evaluate the configurations of your AWS resources. It also lets you track the relationships among resources, troubleshoot resources misconfiguration, and continuously monitor and record the configuration changes of your resources.
The configuration recorder feature lets AWS Config automatically discover and store the configuration of the supported AWS resources in your account. In case there are changes on the configuration baseline, such as resources creation, update, and deletion, AWS Config notifies you with Amazon Simple Notification Service (SNS), so that you have full visibility over the state of your resources and the relationships among them. In addition, if you want to get notifications in the case that your resources don’t comply with your configuration settings, then you can use AWS Config rules. AWS Config provides conformance packs, with predefined or customized templates, to easily deploy a collection of rules and remediation actions at scale.
As your workloads expand in size and complexity, AWS recommends multi-region and multi-account deployments as a best practice. AWS Organizations lets you centrally manage and govern your highly distributed environments. Conformance packs are already integrated with AWS Organizations to quickly establish a common baseline for resource configuration policies and best practices across multiple accounts in a scalable way. As you can see on Deploy Conformance Packs across an Organization with Automatic Remediation, you can set it up from the AWS command-line interface (CLI), or by interacting directly with the AWS APIs.
This post walks you through a quicker and easier approach to enable AWS Config recorder, and deploy conformance packs across your organization using the new integration with AWS Systems Manager Quick Setup.
Solution overview
Quick Setup is an AWS Systems Manager feature that lets you configure and deploy AWS services quickly with the recommended best practices. This means you can instantly setup services in individual or across multiple AWS accounts and regions within your organization, created using AWS Organizations. Instead of writing your own scripts or AWS CloudFormation templates to configure AWS Config on your accounts, this solution lets you quickly create a configuration recorder and deploy conformance packs across multiple organizational units (OUs) and regions using the AWS best practices.
The following diagram shows a typical AWS Organization setup, with multiple organizational units containing different AWS accounts. It shows a management account where you centrally create a configuration recorder and deploy conformance packs from Systems Manager Quick Setup.
AWS Config aggregators collect configuration and compliance data from multiple accounts and regions. A delegated administrator account in an organization aggregates data from all of the member accounts in the organization. The delegated administrator account can create aggregators and deploy conformance packs in the member accounts without additional authorization. See Using delegated admin for AWS Config operations and aggregation to find the steps for creating a data aggregator in a delegated administer account in your organization.
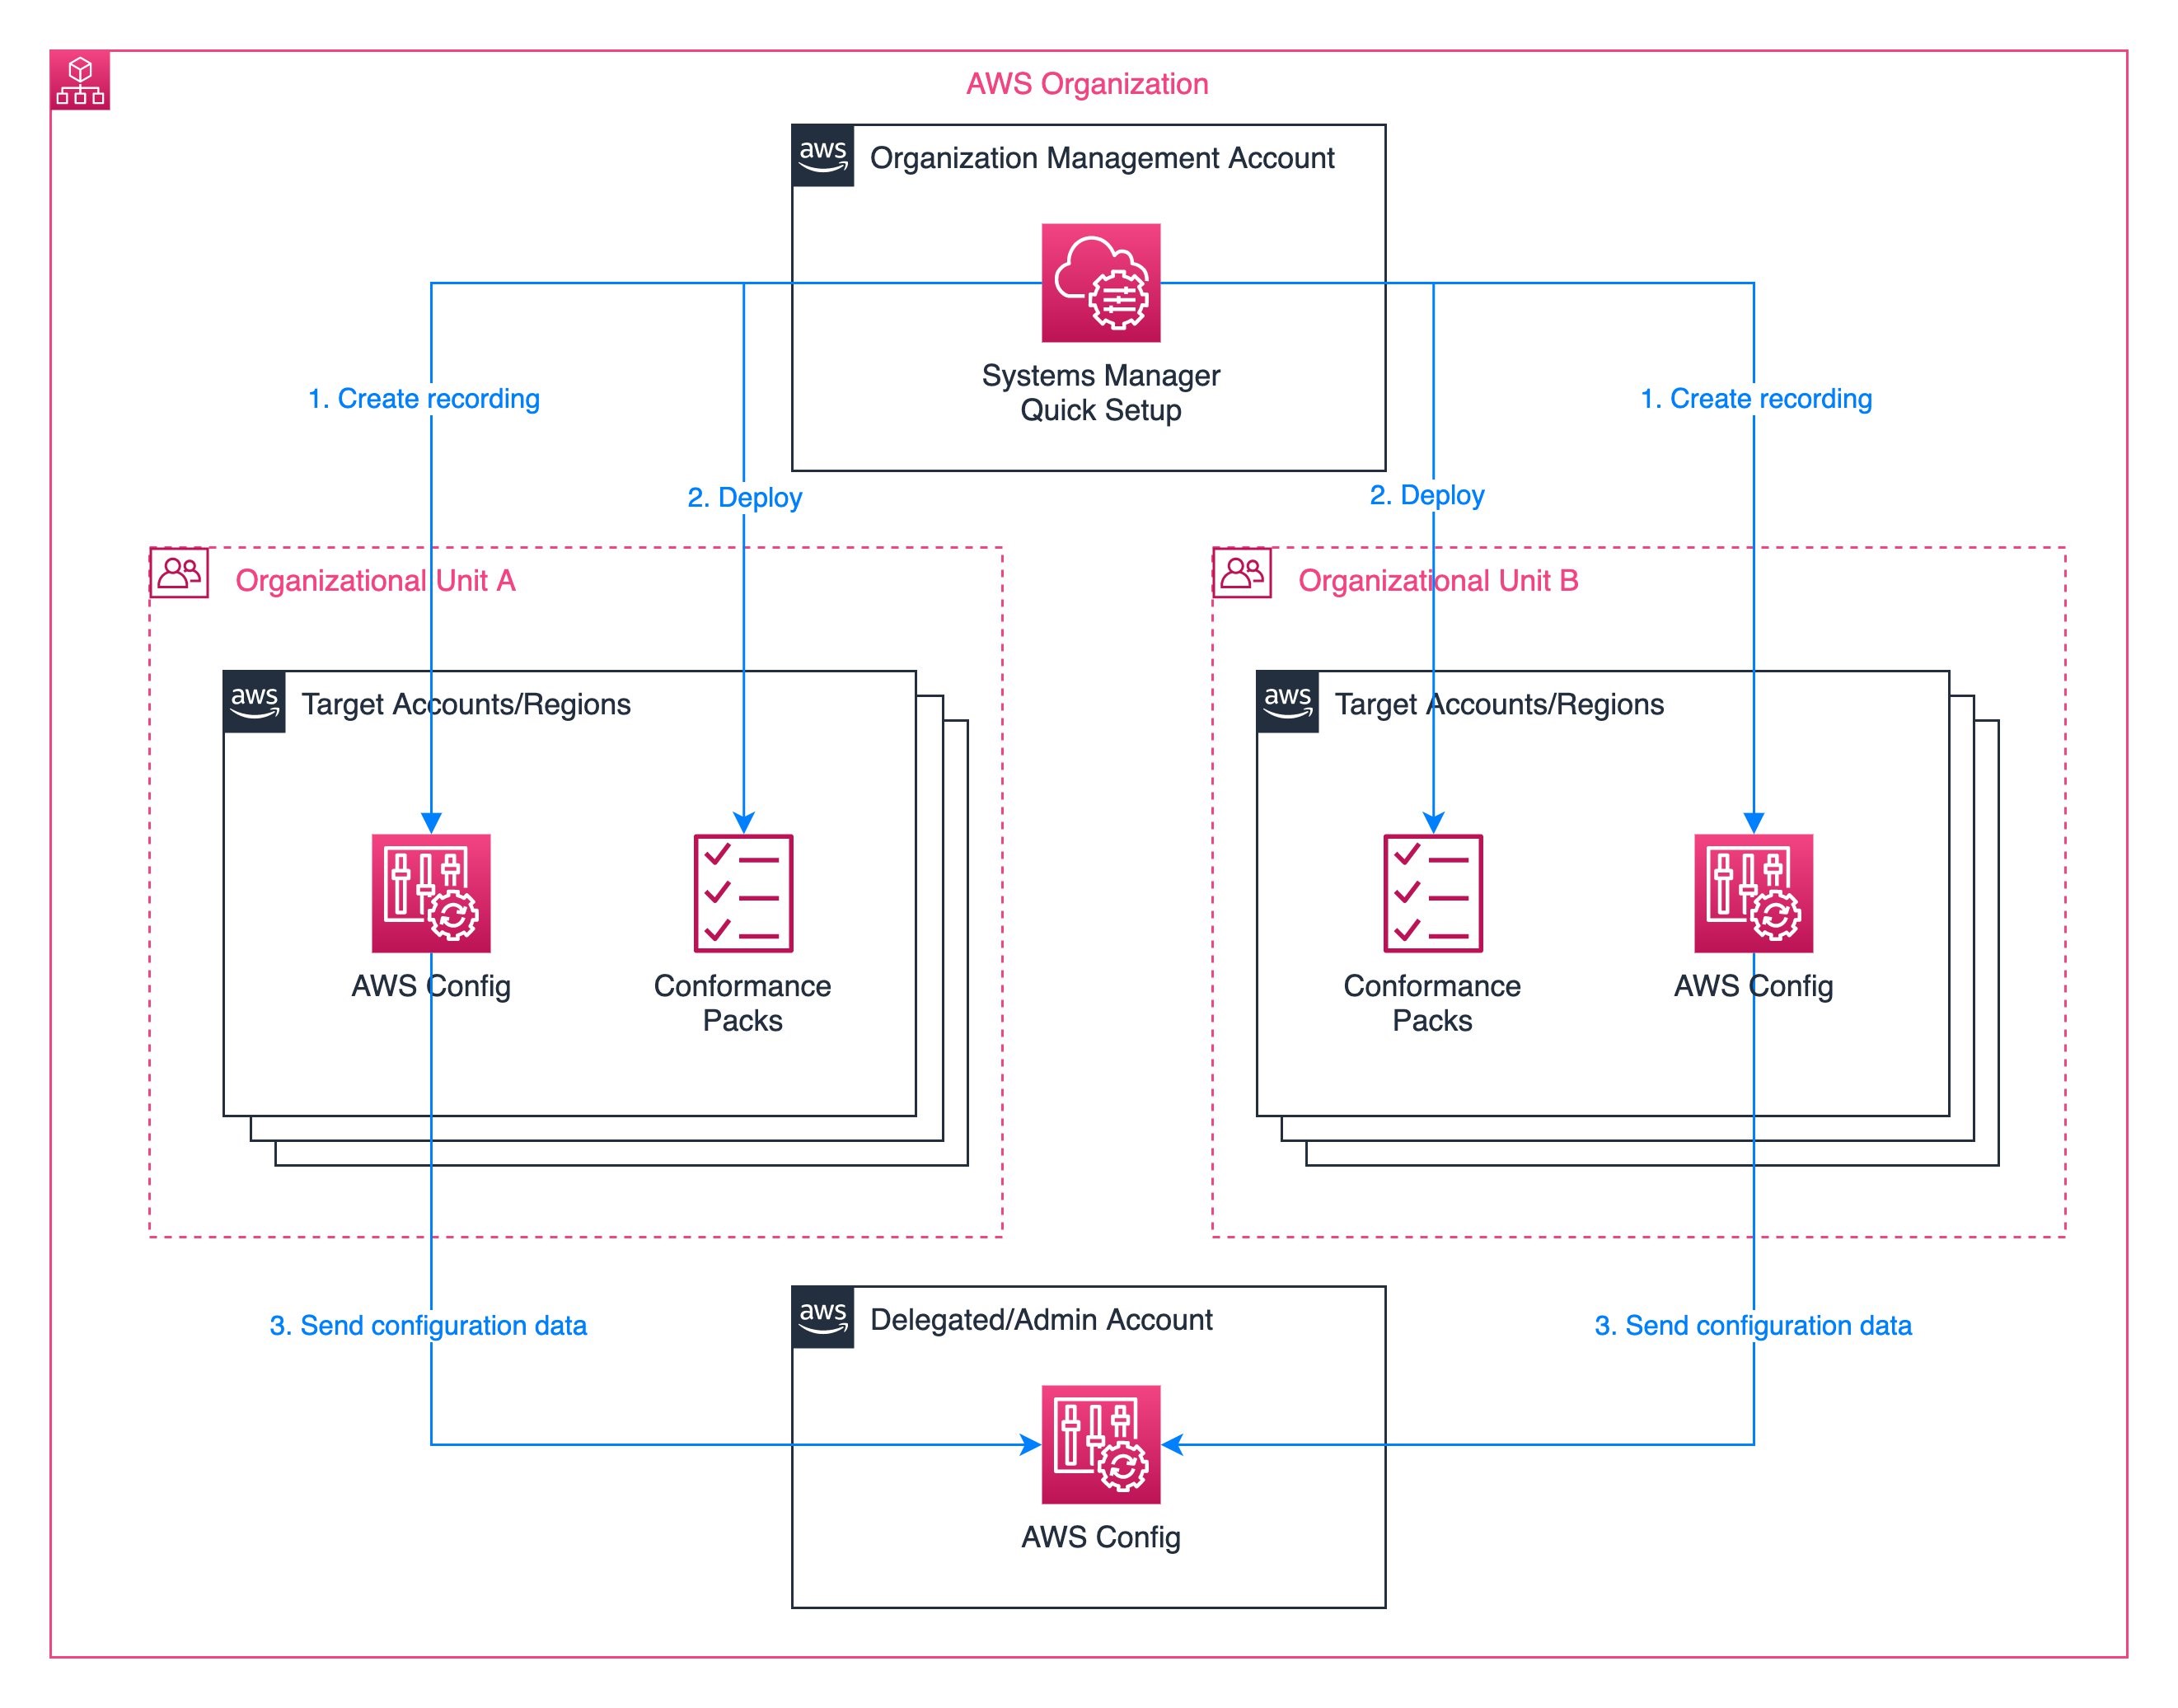
Figure 1: Target architecture diagram
Prerequisites
Before getting started, make sure you have the following prerequisites:
An organization with AWS Organizations. If you are not familiar with AWS Organizations terminology, refer to AWS Organizations terminology and concepts
Two or more organizational units (OUs)
One or more target AWS accounts in each OU
Access to the management account with privileges to manage the target accounts
One delegated administrator account for AWS Config
Setting up AWS Config recording with Quick Setup
Before we apply our conformance packs, we must enable AWS Config recording in all of the target member accounts. We can use Quick Setup to enable config recording for our desired OUs and regions. Follow these steps to set up AWS Config recording:
- In the Organization management account, select Quick Setup in the System Manager console. Choose Create, select Config Recording, and select Next.
- Under Configuration options, first we select the AWS resource types to which we want to track changes. We can simply track all changes to all resource types that are available in the target regions, or selectively choose the resource types that we want to track.
- Next, we configure the S3 bucket to use for the AWS Config delivery channel. We can specify an existing bucket or allow Quick Setup to create one for us.
- AWS Config can be configured to stream configuration changes and notifications to an SNS topic. Under Notification options, we can optionally select an existing SNS topic, let Quick Setup create one for us, or leave streaming notifications disabled.
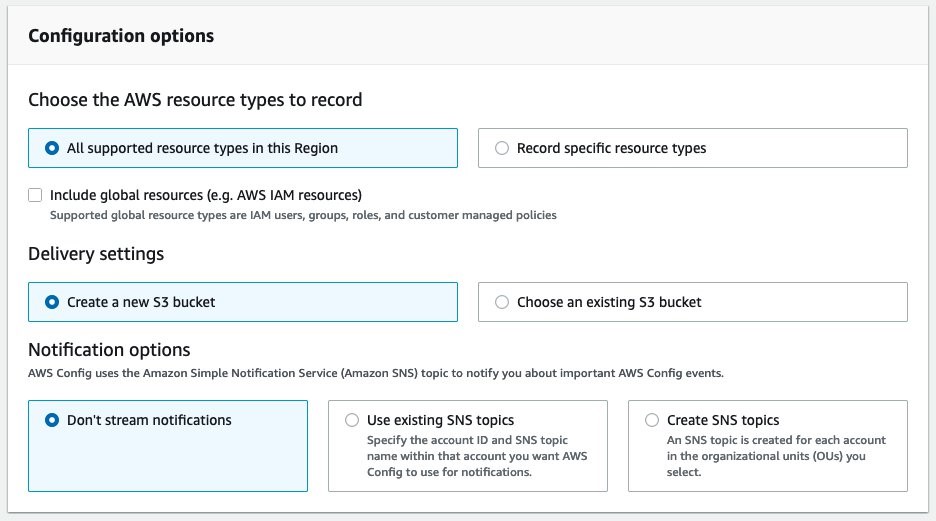
Figure 2: Config recording – Configuration options
- Under Schedule, we define how often we want Quick Setup to remediate any changes if they differ from our above configuration options. The Default option applies the configuration once.
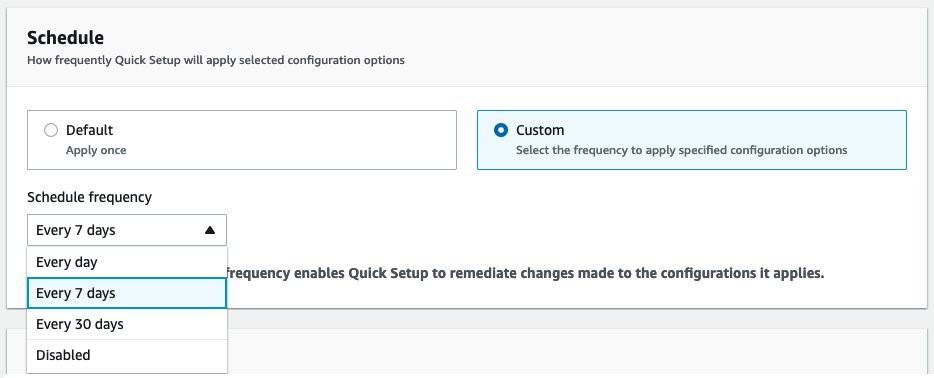
Figure 3: Config recording – Schedule
- In the Targets section, choose whether to create the configuration recording on the entire organization, to specific organizational units (OUs), or the account you’re logged in to. If you choose Custom, then in the Target OUs section, select the check boxes of the OUs and Regions where you want to create the configuration recording.
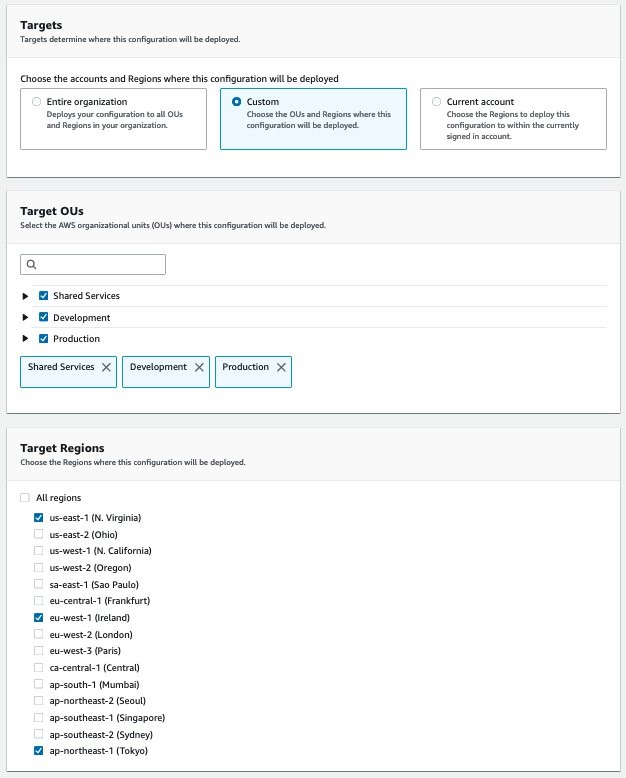
Figure 4: Config recording – Targets
- Select Create to apply the configuration. We are redirected to the details page which shows the current status of the deployment and refreshes automatically. Once all of the deployments are complete, we can continue to the next step of deploying conformance packs across the organization.
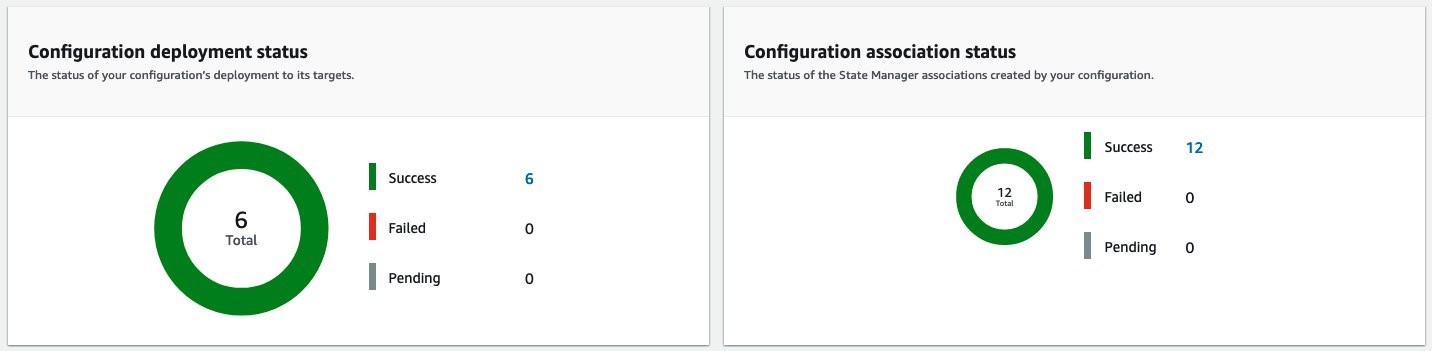
Figure 5: Deployment status
Applying AWS Config Conformance Packs with Quick Setup
Now that we have enabled Config Recording in our target accounts, we can deploy Conformance packs to them. Follow these steps to apply conformance packs with Quick Setup:
- Select Quick Setup from the Systems Management console navigation and select Create. Under Choose a configuration type, select Conformance Packs and select
- Under Choose conformance packs, select up to five conformance packs that you would like to deploy to your organization. These include AWS-recommended operational best practices for specific services, AWS Well-Architected pillars, and compliance programs.
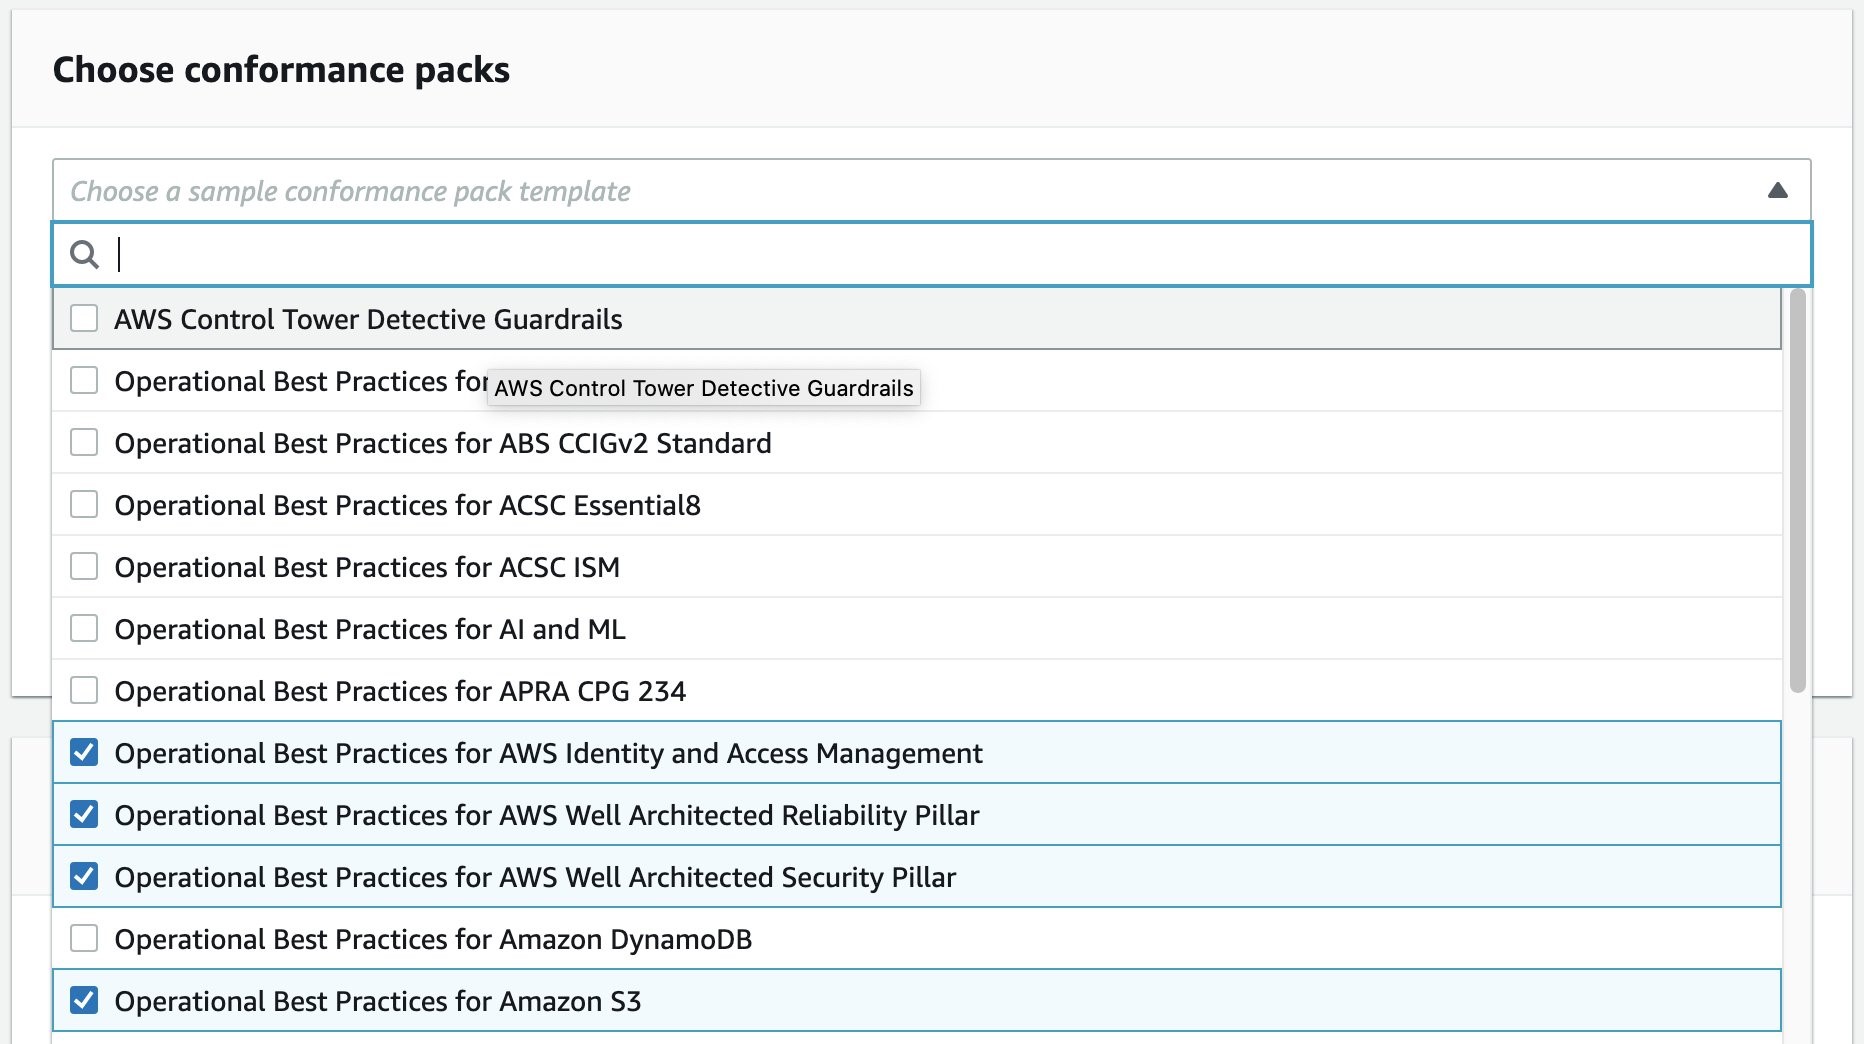
Figure 6: Conformance pack selection
- Similarly to the config recording, we can setup a schedule and target OUs and regions for conformance packs. Config recording setup, under Schedule, we can define how frequently we want Quick Setup to re-apply our configuration, to remediate any deviations from our defined configuration for Quick Setup conformance packs. For targets, we can roll the conformance packs out to the entire organization, the current account, or specific regions only.
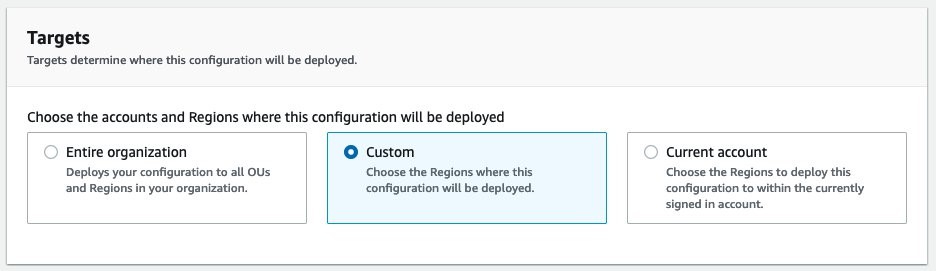
Figure 7: Conformance pack targets
- Under Delegated administrator account, specify the account that will aggregate the config recordings across the organization. If your organization already has a delegated administrator account for AWS Config, then this account will be pre-filled in the configuration.
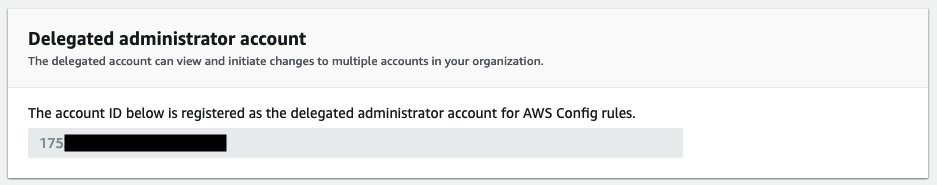
Figure 8: Delegated administrator account
- Select Create to begin the deployment of the selected conformance packs across your organization in the selected regions and accounts that you configured above. In the Summary, we we see a list of configuration options that are being rolled out to the accounts, as well as a real-time status of the deployment.
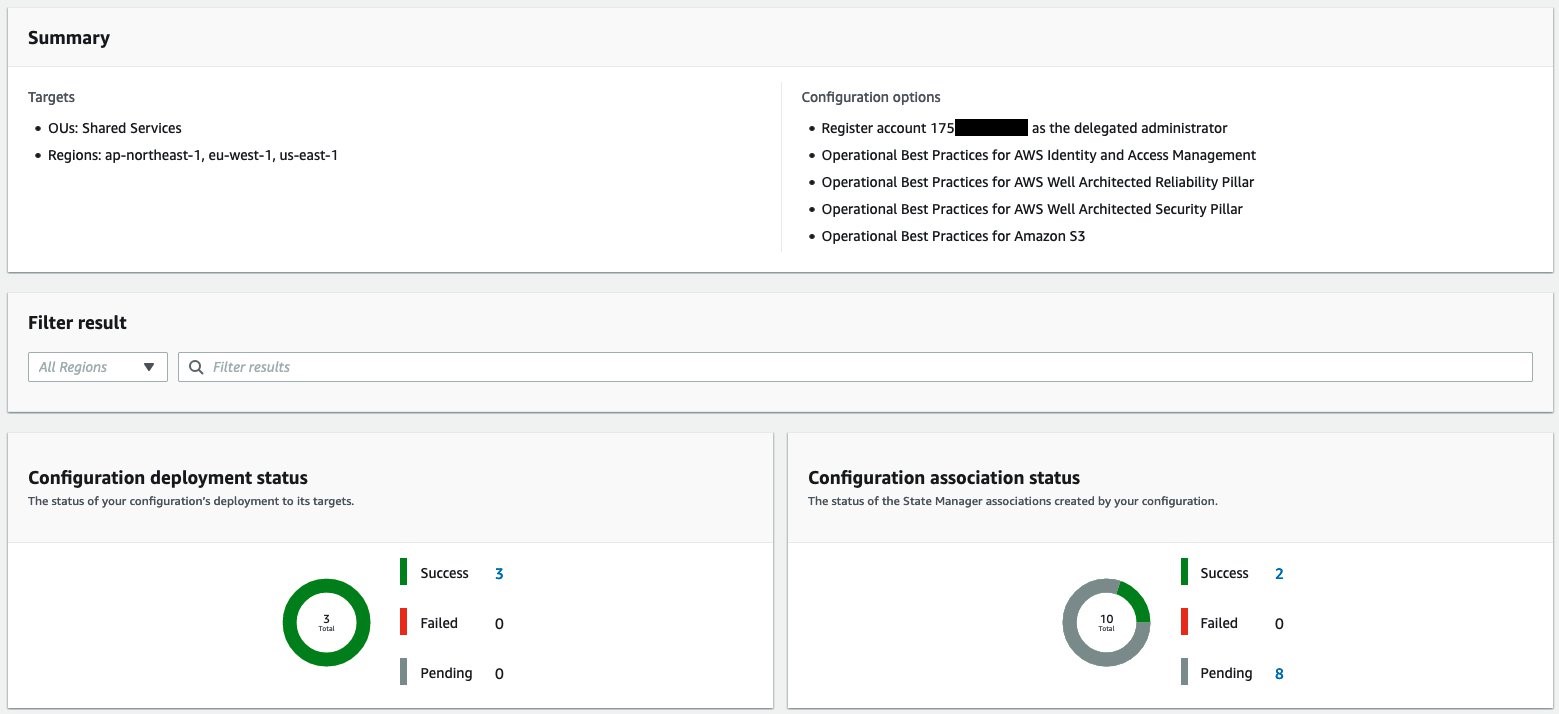
Figure 9: Conformance pack deployment status
The conformance packs are deployed to each member account in the organization. In the member account, and in the AWS Config console, the conformance pack is listed along with its current compliance status.
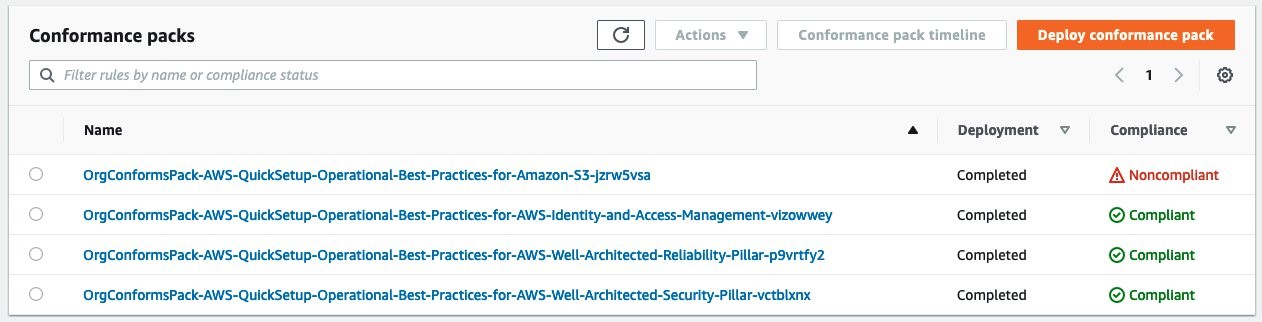
Figure 10: Conformance pack compliance status
Clicking the conformance pack name lets us drill into the specific Config Rules of the conformance pack and their compliance status.
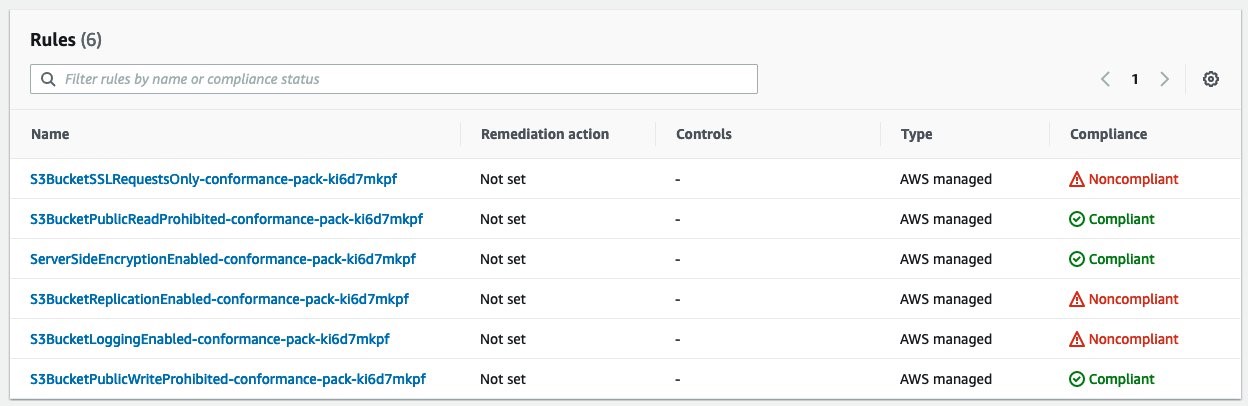
Figure 11: Conformance pack rule compliance status
Conclusion
This post demonstrated how you can quickly and easily enable AWS Config recorder and deploy conformance packs on your multi-account organization using Systems Manager Quick Setup. From the management account, you can configure the accounts within your organizational units to detect changes in your resource configurations, capture those changes as configuration items, and manage the configuration compliance of your AWS resources at scale.
To further improve your organization governance and have visibility over the configurations deployed on all your accounts, refer to Set up an organization-wide aggregator in AWS Config using a delegated administrator account to learn how to deploy organization-wide resource data aggregation in a delegated admin account. Moreover, use the advanced query feature to query your entire AWS footprint from the management account. Doing this provides you and your security team with a simple way to set up and query resource configurations across your AWS environment.
Update your Amazon CloudWatch dashboards automatically using Amazon EventBridge and AWS Lambda
=======================
Amazon CloudWatch lets customers collect monitoring and operational data in the form of logs, metrics, and alarms. This allows for easy visualization and notifications regarding their workload health.
Amazon CloudWatch dashboards are customizable home pages in the CloudWatch console that you can use to monitor your resources in a single view, even those resources that are spread across different AWS regions or on-premises. You can use CloudWatch dashboards to create customized views of the metrics and alarms for your resources. Users can add various widgets, such as line, stacked area, number, bar, pie, or text to their dashboard to fit their visualization needs.
A widget can contain information from multiple sources and metrics, such as CPU utilization from multiple Amazon Elastic Compute Cloud (EC2) instances or network traffic statistics from the same EC2 instances. Although creating dashboards and widgets is straight forward, it can require a maintenance effort to update the resource sources if the content is based on the dynamic information, such as EC2 instances that are created or removed during scale-out and scale-in events in the Auto Scaling group. This post will show how to create and update an event-based, automatically-updated CloudWatch dashboard.
For this example, we will provide an overview of how to create and update a CloudWatch dashboard based on the scale-out and scale-in events of an Auto Scaling group. However, this example only scratches the surface of what is possible with the CloudWatch.
Solutions Overview
This solution will use Amazon EC2 Auto Scaling instance lifecycle events and Amazon EventBridge to trigger an AWS Lambda function that will automatically create or update a CloudWatch dashboard, as seen in figure one.
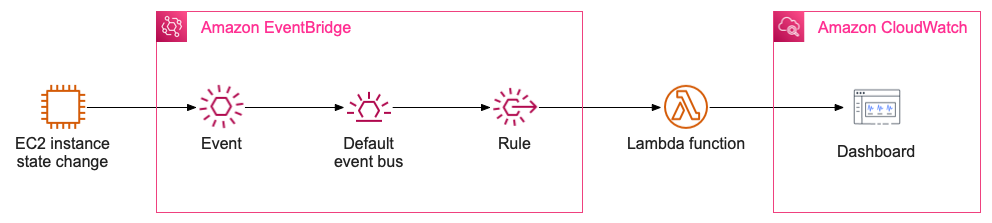
Figure 1: Solution overview, showing the event flow between AutoScaling Group, Amazon EventBridge, AWS Lambda and Amazon CloudWatch
Services used in this solution
Amazon CloudWatch collects monitoring and operational data in the form of logs, metrics, and events, and then visualizes it using automated dashboards so that you can get a unified view of your AWS resources, applications, and services that run in AWS and on-premises.
Amazon EventBridge is a serverless event bus that makes it easier to build event-driven applications at scale using events generated from your applications, integrated Software-as-a-Service (SaaS) applications, and AWS services.
AWS Lambda is a serverless, event-driven compute service that lets you run code for virtually any type of application or backend service without provisioning or managing servers. You can trigger Lambda from over 200 AWS services and SaaS applications, and only pay for what you use.
Getting started
In this post, we will first prepare an environment for our sample, which includes:
One VPC
Two subnets
An Auto Scaling group
An empty Lambda function (which we will manually edit later)
An AWS Identity and Access Management role
Then, we will create an EventBridge rule, modify the Lambda function and roles for our sample, and, once the components are in place, we will scale our Auto Scaling group to trigger the dashboard creation and update.
We must highlight that this VPC and other resources are not intended for production use, but merely as an example that you can optionally deploy if you wish to recreate this approach for demonstration purposes. We have a curated set of best practices available in the AWS Well-Architected Framework, and we encourage our customers to incorporate these into their release lifecycle. However, to expedite things, we are providing an AWS CloudFormation template that creates this infrastructure for us.
Cost
If operated for an entire month, this sample CloudFormation stack would cost approximately $0.50 per day, though this may vary based on slight differences in regional prices. Without the CloudFormation components, operating only the automatic dashboard updating resources (including the Lambda function, EventBridge rule, and dashboard) will typically cost between a few cents if the free tier is leveraged, or up to $3 per month if more than three dashboards are created per account.
Execute CloudFormation
The following is the CloudFormation stack that we will be using in this example. Note that this sample is only meant to demonstrate using an Auto Scaling group to trigger dynamic dashboard updates, and it is not intended for production use. We use this as a way of rapidly creating an environment that demonstrates the solution. If you are unfamiliar with AWS CloudFormation and stacks, then please see our documentation here, or this video introduction.
AWSTemplateFormatVersion: 2010-09-09
Description: AWS CloudFormation Template that creates VPC, ASG, IAM roles for Sample environment
Parameters:
LambdaName:
Type: String
Default: WorkshopLambdaFunction
LatestAmiId:
Type: 'AWS::SSM::Parameter::Value<AWS::EC2::Image::Id>'
Default: '/aws/service/ami-amazon-linux-latest/amzn2-ami-hvm-x86_64-gp2'
Resources:
WorkshopVPC:
Type: 'AWS::EC2::VPC'
Properties:
CidrBlock: 10.100.0.0/16
Tags:
- Key: Application
Value: !Ref 'AWS::StackId'
- Key: Name
Value: Workshop_VPC
WorkshopSubnet1:
Type: 'AWS::EC2::Subnet'
Properties:
VpcId: !Ref WorkshopVPC
CidrBlock: 10.100.0.0/24
Tags:
- Key: Application
Value: !Ref 'AWS::StackId'
- Key: Name
Value: WorkshopSubnet1
WorkshopSubnet2:
Type: 'AWS::EC2::Subnet'
Properties:
VpcId: !Ref WorkshopVPC
CidrBlock: 10.100.1.0/24
Tags:
- Key: Application
Value: !Ref 'AWS::StackId'
- Key: Name
Value: WorkshopSubnet2
WorkshopLaunchTemplate:
Type: 'AWS::EC2::LaunchTemplate'
Properties:
LaunchTemplateName: WorkshopLaunchTemplate
LaunchTemplateData:
ImageId: !Ref LatestAmiId
InstanceType: t3.micro
WorkshopASG:
Type: 'AWS::AutoScaling::AutoScalingGroup'
Properties:
MinSize: 1
MaxSize: 3
DesiredCapacity: 1
LaunchTemplate:
LaunchTemplateId: !Ref WorkshopLaunchTemplate
Version: 1
VPCZoneIdentifier:
- !Ref WorkshopSubnet1
- !Ref WorkshopSubnet2
WorkshopLambdaRole:
Type: 'AWS::IAM::Role'
Properties:
RoleName: WorkshopLambdaRole
AssumeRolePolicyDocument:
Version: 2012-10-17
Statement:
- Effect: Allow
Principal:
Service:
- lambda.amazonaws.com
Action:
- sts:AssumeRole
Path: '/'
WorkshopLambdaRolePolicy:
Type: 'AWS::IAM::Policy'
Properties:
PolicyName: WorkshopLambdaRolePolicy
PolicyDocument:
Version: 2012-10-17
Statement:
- Effect: Allow
Action:
- 'ec2:DescribeInstances'
Resource: '*'
- Effect: Allow
Action:
- 'cloudwatch:PutDashboard'
- 'cloudwatch:DeleteDashboards'
Resource: !Sub 'arn:aws:cloudwatch::${AWS::AccountId}:dashboard/*'
- Effect: Allow
Action: 'logs:CreateLogGroup'
Resource: !Sub 'arn:aws:logs:${AWS::Region}:${AWS::AccountId}:*'
- Effect: Allow
Action:
- 'logs:CreateLogStream'
- 'logs:PutLogEvents'
Resource:
Fn::Join:
- ''
- - 'arn:aws:logs:'
- !Ref 'AWS::Region'
- ':'
- !Ref 'AWS::AccountId'
- ':log-group:/aws/lambda/'
- !Ref 'LambdaName'
- ':*'
Roles:
- Ref: WorkshopLambdaRole
WorkshopLambdaFuction:
Type: AWS::Lambda::Function
Properties:
Runtime: python3.9
FunctionName: !Ref LambdaName
Role: !GetAtt WorkshopLambdaRole.Arn
Handler: index.lambda_handler
Code:
ZipFile: |
import json
def lambda_handler(event, context):
return {
'statusCode' : 200,
'body': json.dumps("completed")
}
Description: Invoke a function during stack creation.
With this deployed, your environment will now have the following components in it:
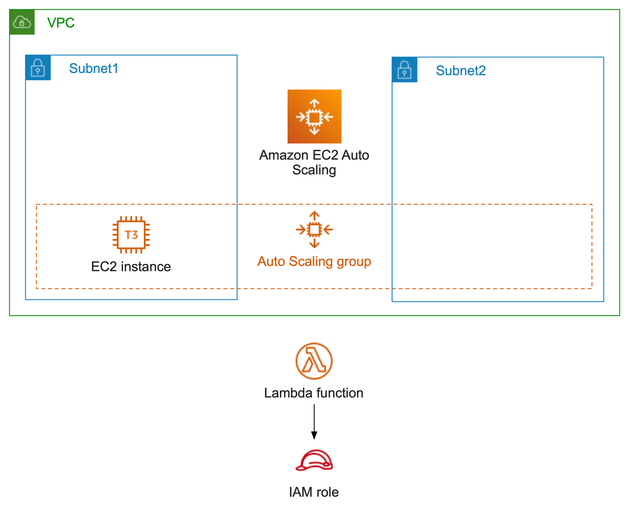
Figure 2: Architecture diagram of resources deployed by the CloudFormation stack
Create EventBridge Rule
With the working environment created, we will now walk you through the process of automating CloudWatch dashboard updates.
First, select here to launch the Amazon EventBridge console. And then, select Create rule and provide a name for the rule.
Now, select the following fields, in this order:
- Event pattern
- Pre-defined pattern by service
- Service provider: AWS
- Service Name: Auto Scaling
- Event Type: Instance Launch and Terminate
- Any instance event
- Specific group name(s)
In the drop-down for Specific group names, select the Auto Scaling group created by CloudFormation. Your page should now look similar to the following:
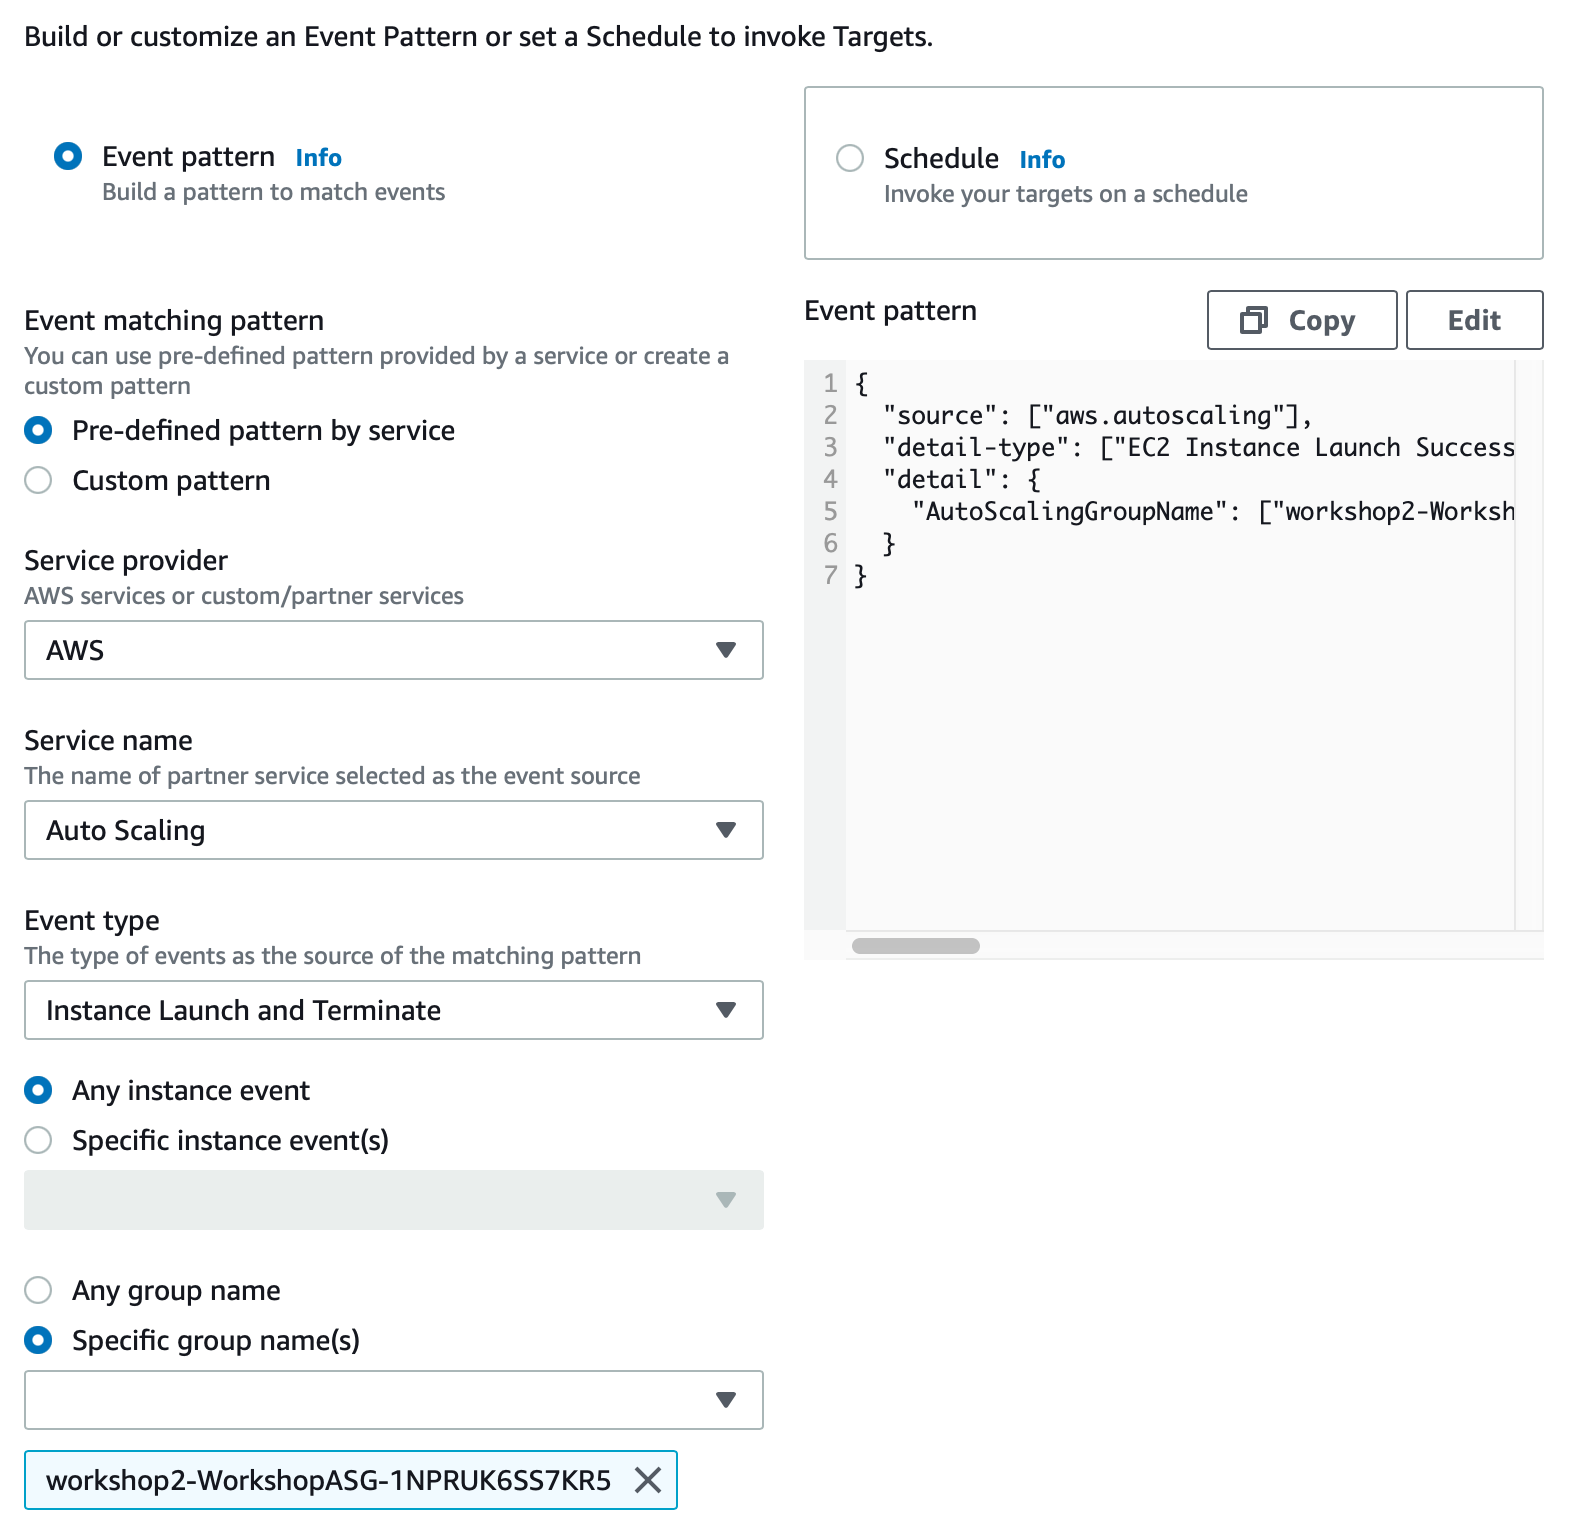
Figure 3: Amazon EventBridge configuration
Leave the Select event bus section untouched, and move on to the Select targets section. Now, select Lambda function, and then WorkshopLambdaFunction.
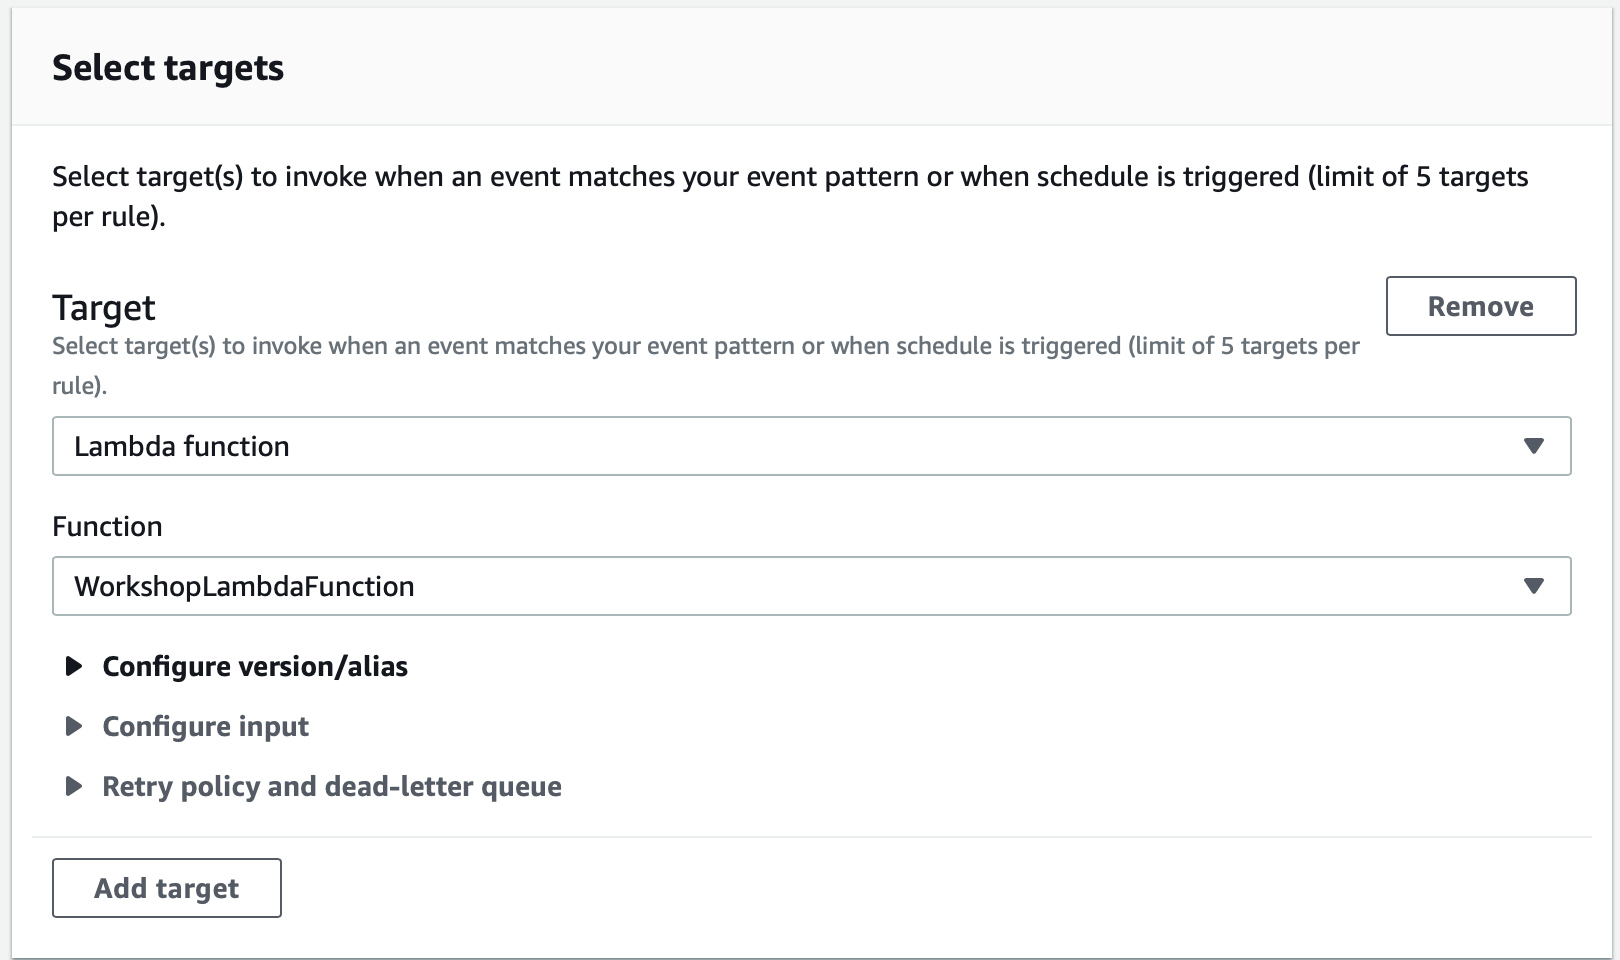
Figure 4: EventBridge Configuration – select target
Finally, select Create.
Modify Lambda function
Now that we have a Lambda function that will execute every time our Auto Scaling group changes its size, we can add the code to it that actually creates (or recreates) a dashboard. This will be a simple example that creates a single widget with CPU metrics from all instances in our sample Auto Scaling group.
First, go to the Lambda console and select the region where you launched the CloudFormation template. Go into the function created by CloudFormation and select the Configuration tab, where you should see an EventBridge under the Triggers, as seen in the following:
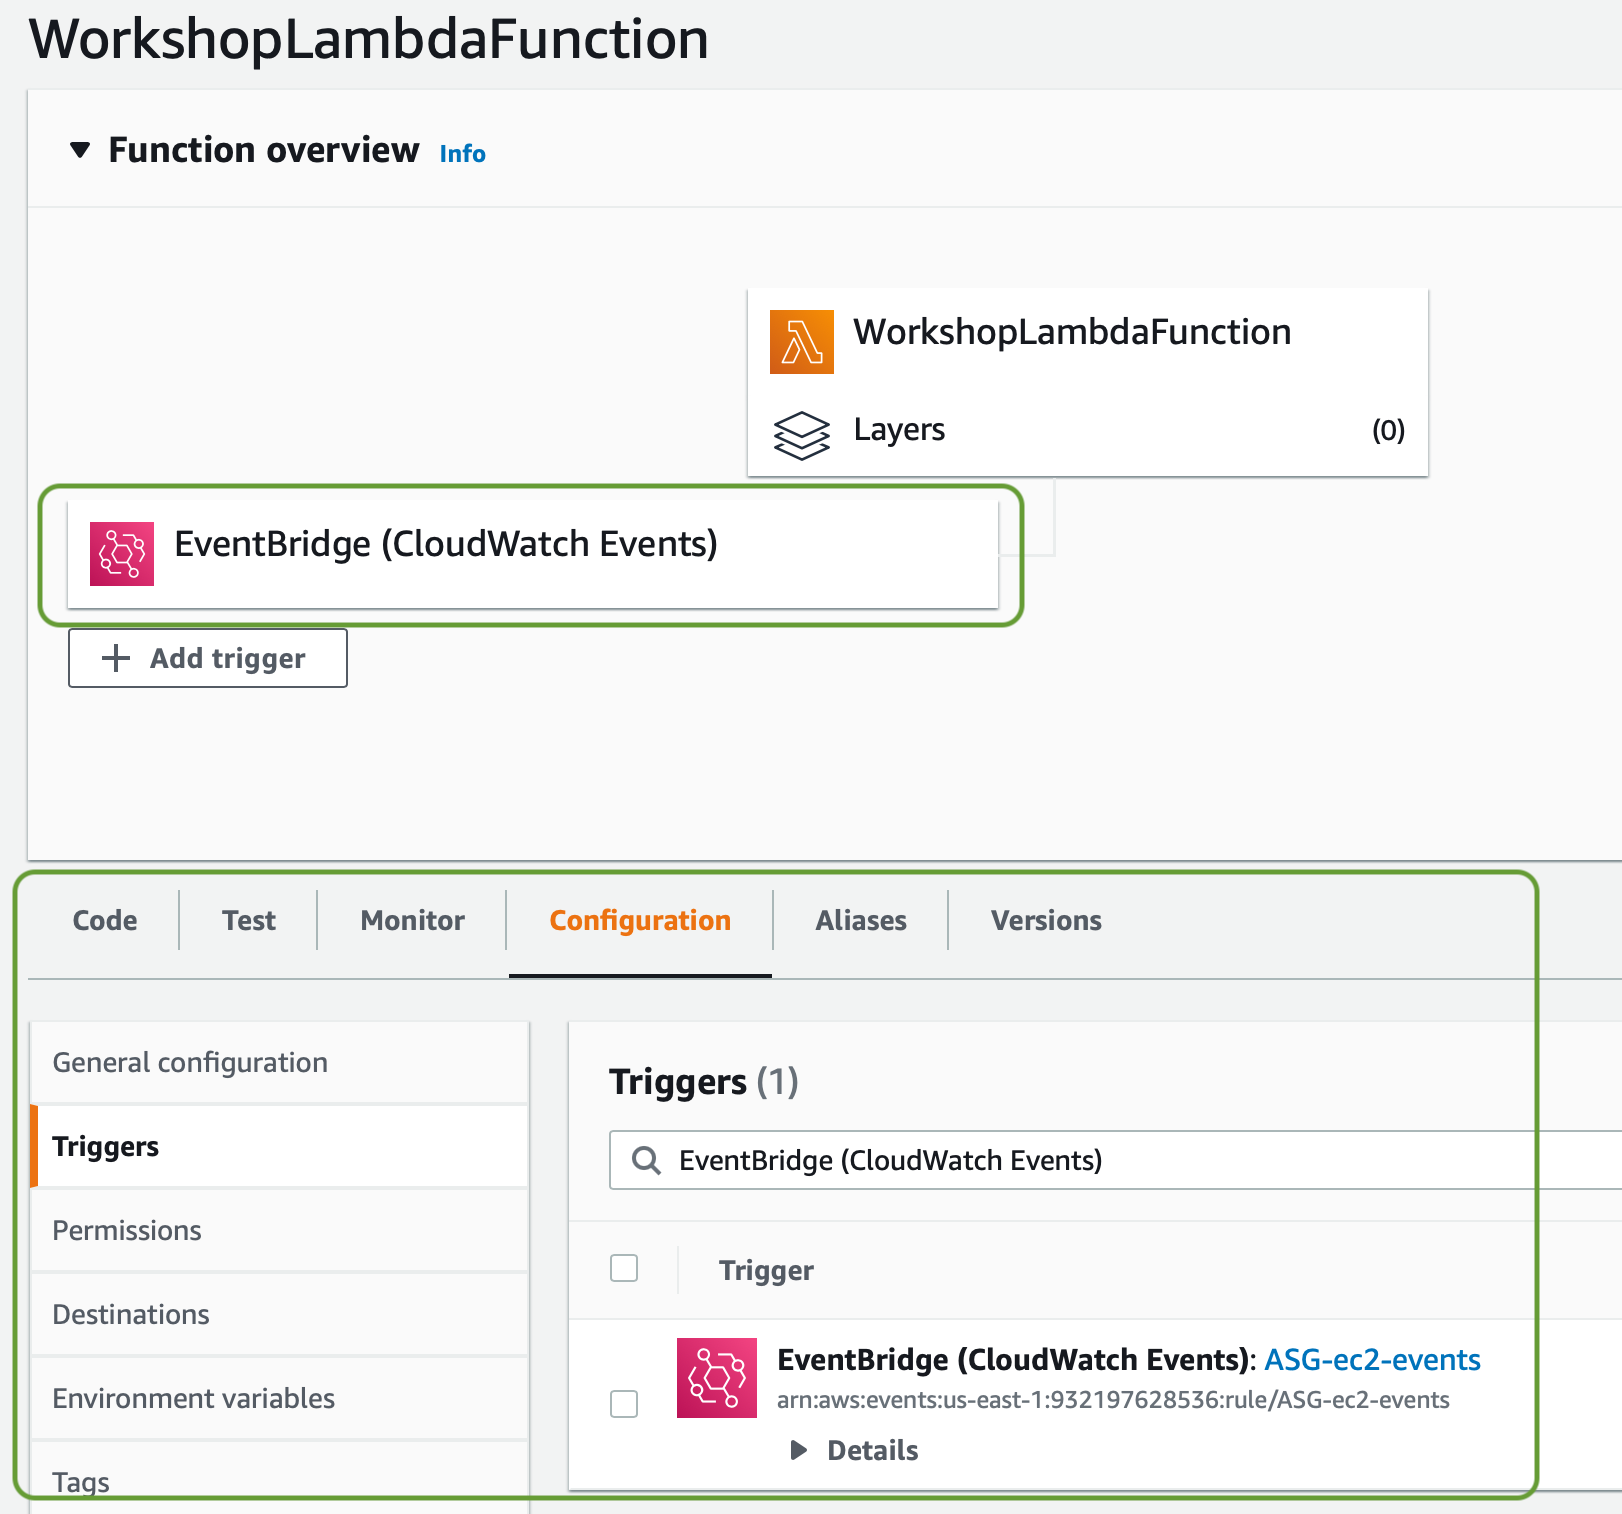
Figure 5: AWS Lambda configuration
Copy and paste the following code into to the editor under the Code tab, in the index.py file.
import copy
import datetime
import json
import os
import boto3
WIDGET_TEMPLATE = {
'type': 'metric',
'x': 0,
'y': 0,
'width': 15,
'height': 6,
'properties': {
'view': 'timeSeries',
'stacked': False,
'metrics': [],
'region': os.getenv('AWS_DEFAULT_REGION', 'us-east-1'),
'annotations': {}
}
}
class CloudWatch:
"""Base class for updated dashboard widgets"""
def __init__(self, dashboard_name):
"""Name of dashboard to (re)create, list of account numbers to interrogate"""
self.cw_client = boto3.client('cloudwatch')
self.ec2_client = boto3.client('ec2')
self.dashboard_name = dashboard_name
self.dashboard = None
def get_ec2_cpu_metrics(self):
"""Returns the EC2 CPU metrics for a single account and region"""
instances = []
# CloudWatch metrics can only display max 500 metrics per widget
results = self.ec2_client.describe_instances(MaxResults=500)
for result in results['Reservations']:
for instance in result['Instances']:
if instance['State']['Code'] != 48:
print('adding instance ID: {}'.format(instance['InstanceId']))
instances.append(instance['InstanceId'])
else:
print('skipping terminated instance ID: {}'.format(instance['InstanceId']))
return instances
def put_dashboard(self, dashboard_body):
"""Puts the updated dashboard into CloudWatch"""
results = self.cw_client.put_dashboard(
DashboardName=self.dashboard_name,
DashboardBody=json.dumps(dashboard_body))
print(results)
def format_widget(list_of_instance_ids):
"""
Returns a JSON object with the widget definition for a single account and
its EC2 instances
"""
results = []
for instance in list_of_instance_ids:
results.append(['AWS/EC2', 'CPUUtilization', 'InstanceId', instance])
return results
def lambda_handler(event, context):
"""Entrypoint for the Lambda function"""
cw = CloudWatch(os.getenv('DASHBOARD_NAME'))
final_dashboard_body = {'widgets': []}
all_instances = cw.get_ec2_cpu_metrics()
metrics_list = format_widget(all_instances)
widget = copy.deepcopy(WIDGET_TEMPLATE)
widget['properties']['metrics'] = metrics_list
widget['properties']['title'] = 'CPU Utilization: {} instances'.format(str(len(all_instances)))
widget['properties']['annotations']['vertical'] = [
{'label': 'Last updated', 'value': datetime.datetime.utcnow().isoformat() + 'Z'}]
final_dashboard_body['widgets'].append(widget)
cw.put_dashboard(final_dashboard_body)
Then, select Deploy to push your changes to become live.
One final change to our Lambda function is required. You must enter an environment variable that will determine the name of the new dashboard.
Note that this script will overwrite any existing dashboard of the same name. Make sure that you don’t use the name of an existing dashboard, as you will then lose it inadvertently.
Select Configuration, and then Environment variables. Now, select Edit to create a new variable. The name must be DASHBOARD_NAME, and the value is the name that you choose.
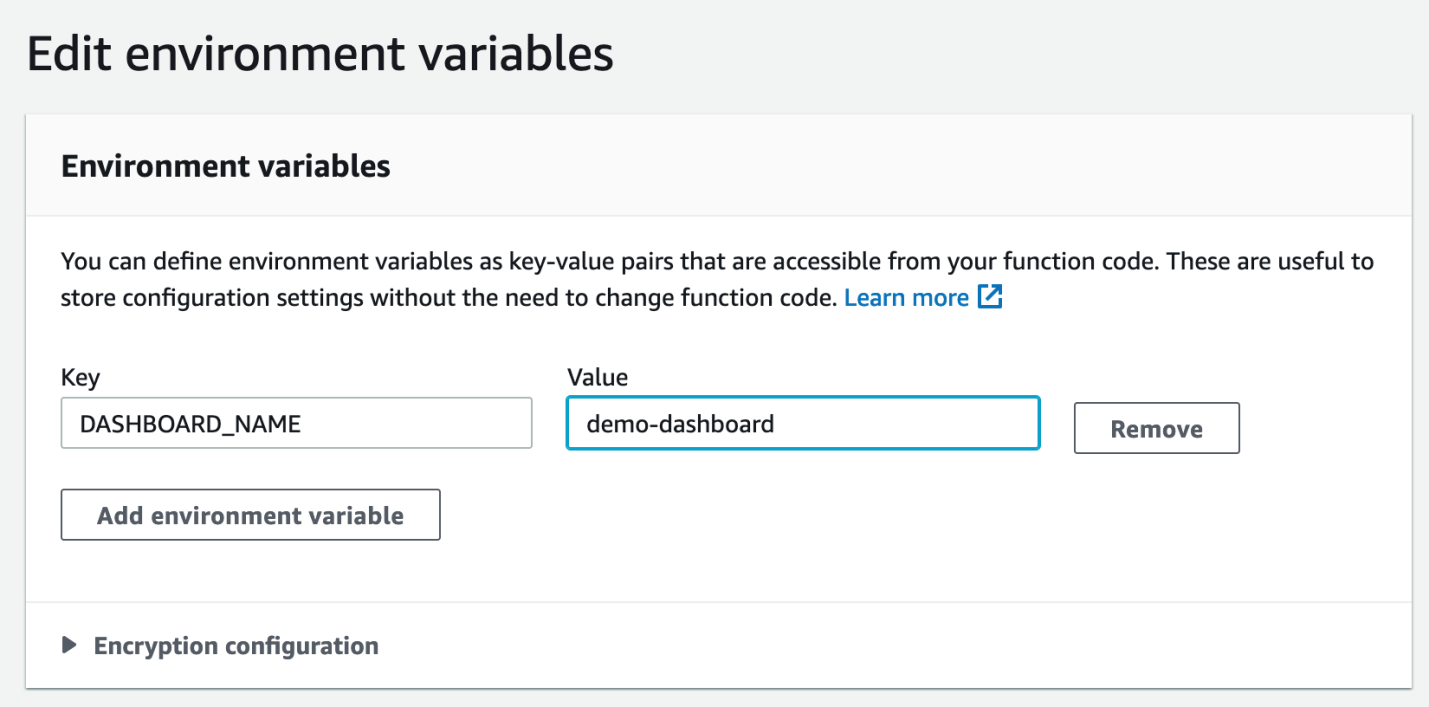
Figure 6: AWS Lambda function environment variables
A note about proper IAM permissions
When we created our Lambda function with our CloudFormation template, we also created an execution role that gives the Lambda function the basic permission to write logs to CloudWatch Logs and associated it with the function. In order for our code to work properly, it requires the following permissions:
- Describe the Auto Scaling group and retrieve the instance details that will be added to the dashboard.
- Execute the CloudWatch
PutDashboardAPI endpoint that creates the dashboard (for demo purpose, this IAM policy was created with the CloudFormation template).
We have added these permissions for you already, but if you are not familiar with the process, then you can view these privileges from the Lambda function’s Permissions view under the Configuration tab. Your view will appear similar to the following:
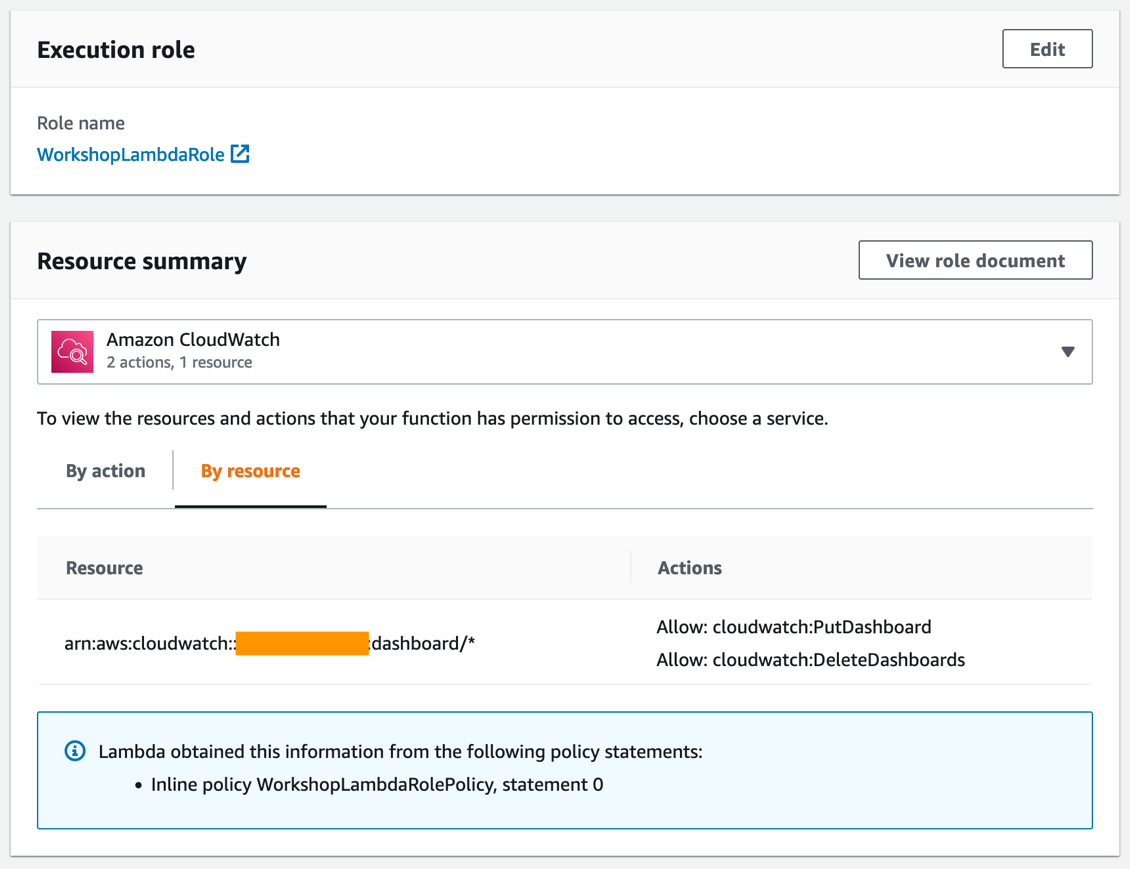
Figure 7: Execution role for our Lambda function
Verification
Now you have all of the pieces needed to create the dashboard based on the events from the Auto Scaling group. Let’s go ahead and trigger it by adjusting our deployment.
The Auto Scaling group created by the CloudFormation template has a desired capacity of one, so we should see exactly one instance has been created under the Auto Scaling group. Open your Auto Scaling group console here, and go to the work shop Auto Scaling Group. Select Edit in the Group details section, and change the desired capacity to two.
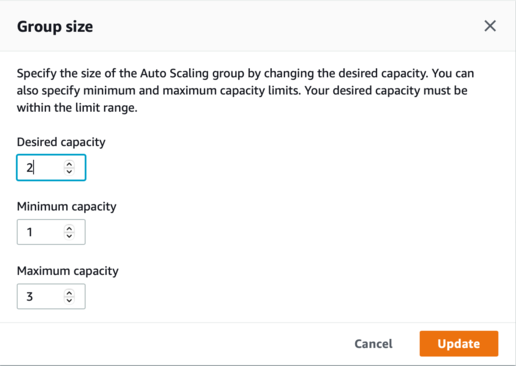
Figure 8: Auto Scaling Group size
You can monitor the Lambda Execution through the Monitor tab in the Lambda function, or you can check the logs from the CloudWatch logs.
Check your dashboard
Now, go to the CloudWatch Dashboards (or reload your CloudWatch dashboard page). Your newly updated dashboard will be ready for you!
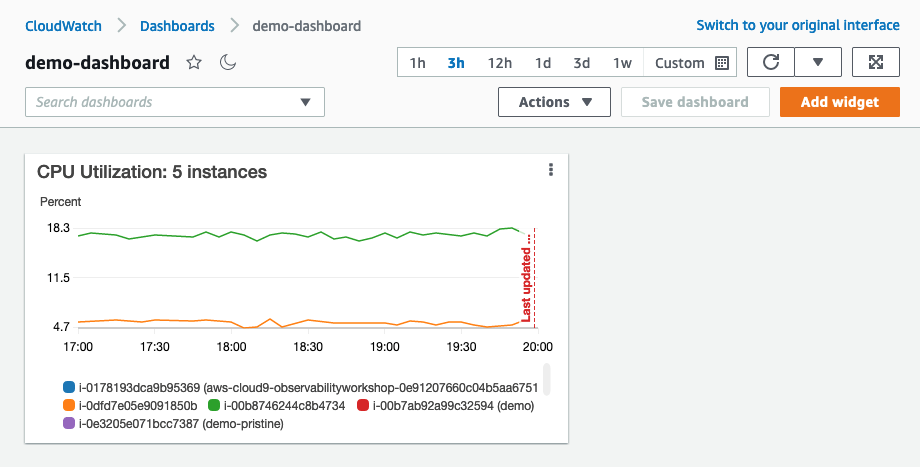
Figure 9: Auto Scaling Group dashboard sample
Summary
The example in this post shows how you can automatically create or modify the Cloud Watch Dashboard based on the lifecycle events from EventBridge. This solution will be handy when you must manage much more complicated situations with multiple Auto Scaling groups and many instances with the least effort.
Cleanup
To cleanup resources used in this post, follow these steps:
- Delete the CloudFormation stack created earlier
- Delete the CloudWatch log group created by your CloudFormation stack’s Lambda function (it will have a name that includes the stack’s name)
- Delete the EventBridge rule that triggers your updates
- Delete the generated dashboard from CloudWatch
Next steps
This post only scratches the surface of what is possible with CloudWatch dashboards and you can extend this solution to include more EC2 metrics, data from Amazon Elastic Block Store, Amazon Kinesis, Amazon API Gateway, or any of our services that emit metric data into CloudWatch. You can even perform more advanced automation including custom widgets, CloudWatch logs, and more.
Identity Guide – Preventive controls with AWS Identity – SCPs
=======================
AWS Identity offers a set of features that let customers apply preventive controls to their AWS environment. This includes AWS Organizations service control policies (SCPs). For you to achieve common preventive controls, SCPs provide preventative enforcement by offering central control over the maximum available permissions for all accounts in your organization. SCPs affect all users and roles in attached accounts, and they can be used to prevent principals from creating resources that do not conform with your requirements. In this blog we will describe how to get started with SCPs, describe common use cases, and describe how to write your own SCPs.
Overview
Prerequisites
Strategies
Deny List
Allow List
Applying an SCP Strategy to an Organization
Common Use Cases
Use Case: Limiting Geographic Regions
Use Case: Prevent Change to Security Controls
Use Case: Prevent destructive actions against compute, network, or storage
Use Case: Preventing an account from leaving an organization
Prevent resource instantiation
Use Case: Prevent Unencrypted RDS
Use Case: Prevent VPCs without internet from obtaining internet
Developing SCPs
Conclusion
Overview
AWS offers a wide variety of services and features to help you secure your environment. Detective services include Amazon GuardDuty, which is a threat detection service that continuously monitors your AWS accounts and workloads for malicious activity and delivers detailed security findings for visibility and remediation. Features, such as AWS Identity and Access Management (IAM) provides fine-grained access control across all of AWS. IAM lets you specify who can access which services and resources, and under which conditions. AWS Organizations service control policies (SCPs) can ensure that your accounts stay within the access control guidelines of your organization. For example, you can allow the creation of encrypted RDS instances while preventing unencrypted RDS instances from being launched.
AWS recommends a defense-in-depth approach to securing your environment. This includes a combination of both preventive and detective controls applied at all layers. In this post, we’ll focus on preventive controls with SCPs, which is a feature of AWS Organizations. SCPs let controls be applied at scale across your entire organization. This makes them a powerful tool in helping you meet the security guidelines of your organization. SCPs are identity-based policies that control the actions that an IAM principal can perform.
Prerequisites
SCPs and preventive controls help enforce a standard configuration for all of your resources. Enforcing these standards works best when your organization has a uniform structure and your developers use a consistent development practice. This will help you understand the impact that new SCPs will have on your environment, as well as establish a safe framework to test out policy changes before applying them throughout your organization.
Otherwise, broadly designed preventive controls may slow down developers. You should evaluate the need for legitimate exceptions to preventive controls and adjust your SCP strategy to accommodate developer needs. For example, if you prevent developers from launching unencrypted RDS instances, and that requirement isn’t communicated clearly across the organization, then developers will spend unnecessary time troubleshooting why they can’t launch an RDS unencrypted instance.
Service Control Policies requires AWS Organizations with all features enabled. If you do not use Organizations today, then review the documentation, prescriptive guidance, and whitepaper on how to enable Organizations and organize your AWS environment.
Strategies
It is critical to understand how IAM policy evaluation logic occurs to understand how to apply SCPs. At its most basic level, all IAM evaluations are implicitly denied by default, except for the root user. This is to make sure that customers are in control and can define which permissions are granted to principals in their account. In order to understand if an action is allowed or not, IAM evaluates all applicable policies. If there is an explicit deny, then the action is always denied. If there is an allow and no explicit deny, then the action is permitted as long as it’s not overridden with an implicit deny from a permissions boundary, SCP, or session policy. If there is neither an explicit deny or allow, then the action is denied because of the implicit deny. The exact evaluation logic can be found here.
Start by deciding upon a policy strategy for SCPs. The two strategies available are Deny List and Allow List. By default, the SCP examples here are configured to be applied using a Deny List strategy, and all of the policies in this document have been written for Deny List environments.
Deny List
A deny list strategy starts from a single policy that defines all of the services that you use in your environment. Then, you create a list of configurations that you want to deny and implement SCPs to achieve that. By default, there is a FullAWSAccess policy applied to every Account and OU in the organization. The FullAWSAccess policy allows all services and actions. Since SCPs don’t grant access, this policy allows for any Allow action in an Identity entitlement to grant access. This lets customers apply SCPs in an existing environment in a safe fashion, as by default nothing is denied, and Deny statements must be explicitly written.
Allow List
Note: Do not remove the FullAWSAccess SCP without applying Allow policies first.
An allow list strategy is when you apply SCPs that explicitly permit the services you allow. Start by creating an SCP listing that the services allowed, then remove the AWS managed FullAWSAccess SCP. This strategy blocks any activity that is not specifically listed in your policies. Allow list SCPs do not allow for conditionals, resource elements, or not action statements. Applying this strategy in an existing organization could have unintended consequences, as policies are applied immediately upon change and all services in use will have to be accounted for. Removal of the FullAWSAccess without replacing it with Allow policies will block all access to AWS services.
Deny vs Allow List
The default configuration of AWS Organizations supports using SCPs as deny lists. The example SCPs provided by AWS are developed as deny lists. Deny list SCPs provide greater flexibility and customization, as they allow for conditionals and for specific resources to be specified. Additionally, Deny statements do not need updates as AWS launches new services, as new services aren’t explicitly denied. This makes deny lists easier to maintain. Allow list SCPs are rigid and will not allow for exceptions through the use of conditions. Allow lists provide the ability to define the specific services allowed in an account. This allows you create policy for accounts with well-defined use cases. If you are getting started with SCPs, then starting with a deny list strategy will let you use AWS examples and build exceptions for when an SCP should not apply.
Applying an SCP Strategy to an Organization
After you decide between a deny or allow list strategy, you will identify actions that you want to control in a preventive manner, and where you want to apply them. Determining the actions you wish to control will depend on your control requirements. The examples here will get you started with common control use cases. To determine where to apply these SCPs, you will evaluate where you want the controls enforced, the structure of your Organization, the available policy size, and the attachment quota for SCPs themselves.
Deny statements in SCPs are inherited based on where they are placed in the Organization. Allow statements must be applied at every level in which they should apply. If you apply a deny list SCP to the Organization’s management root, then it will be inherited by all accounts in the organization. Allow statements must be applied at every level in which they apply. The exception to both allow list and deny list SCPs is that SCPs do not affect users or roles in the management account. They only affect the users and roles in the member accounts in your organization, including the member account root.
If you find yourself requiring more SCPs or SCP statements than the allowed quota, then there are several strategies you can use, such as removing SID statements or using wildcards (*) for actions with the same prefix.
Common SCP Use Cases
In the following section we will describe common use cases. This list is not the complete list of example SCPs that AWS makes available, but they do solve common scenarios that our customers work backward from. You can evaluate these examples to work backward from your use cases to develop your policies.
Use Case: Limiting Geographic Regions
You can use SCPs to limit what regions’ resources can be launched and deployed into. If you operate your business in a specific set of AWS regions, and you have a requirement to restrict AWS usage to those regions, then you can employ an SCP to ensure conformance with this requirement.
Start by using an OU to contain the accounts and workloads that have this requirement. This lets you apply (for example) a Europe-only SCP only to the accounts that have this requirement, without impacting other accounts outside of that OU. Once the organization structure has been defined, then the SCP can be developed and applied at the top-most OU that has this requirement. We have an example scp to support the development of blocking regions while providing exemptions for operations in approved global services that can be found here. The following code snippet shows the key components of using a Condition String Not Equals on aws:RequestedRegion.
"Sid": "DenyAllOutsideFrankfurt",
"Effect": "Deny",
"NotAction": [
...
],
"Resource": "*",
"Condition": {
"StringNotEquals": {
"aws:RequestedRegion": [
"eu-central-1"
]
}
Use Case: Prevent Change to Security Controls
You can use SCPs to prevent modification to security controls, and to make sure that controls aren’t tampered with or disabled. You can implement these controls to both improve your organization’s defense in-depth strategy and make sure that your security logging and monitoring functions remain enabled.
You can apply these SCPs at the Root OU level to make sure the policy applies to all accounts in your organization. The actions that you apply to this type of policy depend on the controls that you have enabled, and how those controls are configured. For example, if you rely on VPC Flow Logs, Amazon GuardDuty, and AWS Config as a part of your security logging and monitoring strategy, then these example SCPs can be combined to make one policy. The following code snippet shows how multiple examples can be combined into a single policy document:
Deleting VPC Flow Logs
Prevent Amazon GuardDuty tampering
Prevent AWS Config tampering
"Sid": "DenyLogDelete",
"Effect": "Deny",
"Action": [
"ec2:DeleteFlowLogs",
...
"guardduty:DeleteDetector",
...
"config:StopConfigurationRecorder"
],
"Resource": "*"
Use Case: Prevent delete actions against compute, network, or storage
You can use SCPs to prevent delete actions in their AWS accounts to ensure data integrity or assist in incident response.
If you have a non-elastic database deployed in EC2, then you can apply an account level SCP to deny Stop or Terminate actions in the account.
If you are encrypting data with KMS, then you can apply defense in-depth and prevent KMS API calls that would delete KMS keys. This will make sure that your KMS keys are protected from deletion.
If you are performing incident response, then you can use SCPs to block destructive data events. This is a temporary measure to respond to an incident response event and is applied to the level of the organization appropriate for the incident that is being responded to. In this use case, evaluate the services you use that store persistent data and the API Calls that are used to delete data. You can block S3 actions that are associated with deleting objects.
The following code snippet shows how you can combine different services into one policy.
"Sid": "PreventDeleteActions",
"Effect": "Deny",
"Action": [
"ec2:StopInstances",
"ec2:TerminateInstances",
...
"kms:ScheduleKeyDeletion",
"kms:Delete”,
...
"s3: DeleteObject ",
"s3: DeleteObjects",
...
"s3: DeleteObjectVersion",
"s3: PutBucketLifecycle"
],
"Resource": "*"
Use Case: Preventing an account from leaving an organization
You can use SCPs to prevent accounts from leaving your organization. This makes sure that member accounts remain within the organization for billing and governance.
"Sid": "PreventOrganizationLeaving",
"Effect": "Deny",
"Action": [
"organizations:LeaveOrganization"
],
"Resource": "*"
Preventive resource instantiation controls
Use Case: Prevent Unencrypted RDS
You can restrict the ability of users from creating unencrypted RDS instances through the use of conditionals in SCPs.
If you have the requirement that all RDS databases are created with encryption, then you can achieve this with an SCP. To do this, create an SCP that uses rds:CreateDBInstance with a boolean of “rds:StorageEncrypted”: “false”. This lets you ensure the at rest data encryption of new RDS instances.
"Sid": "RDS",
"Effect": "Deny",
"Action": [
"rds:CreateDBInstance"
],
"Resource": [
"*"
],
"Condition": {
"ForAnyValue:StringEquals": {
"rds:DatabaseEngine": [
"mariadb",
...
"sqlserver-web"
]
},
"Bool": {
"rds:StorageEncrypted": "false"
Use Case: Prevent VPCs without internet from obtaining internet
You can restrict VPCs without internet from obtaining internet access to make sure that network controls aren’t bypassed.
If you have an account where networking configuration is established and confirmed to be accurate, then you can attach an SCP to make sure that actions that let VPCs obtain direct internet access are not taken. This example can be found here. The following code snippet shows how several services create the same outcome.
"Sid": "PreventVPCInternet",
"Effect": "Deny",
"Action": [
"ec2:CreateInternetGateway",
...
"globalaccelerator:Create*"
],
"Resource": "*"
Developing SCPs
AWS provides helpful documentation to help you author your own SCPs. To get started, the Service Authorization Reference provides the information necessary for you to build the Action and Resource sections of a SCP.
The Service Authorization Reference provides the list of Condition keys that are available in the authorization context. These can be used to provide fine-grained authorization controls. The AWS global condition key documentation describes all of the conditions available in the request context used for authorization. The IAM JSON documentation describes how to use conditionals. Combined, you can choose the service condition key and pair it with the global conditional used to specify it.
Let’s walk through an example of how you might use the AWS documentation to help author your preventive controls. For example, you want to prevent unencrypted Amazon Elastic File Systems (EFS) from being created.
Start by reviewing the EFS Service Authorization Reference page. Identify the action used by the service to create a file system, CreateFileSystem. For the resource element, you can save policy space by using a * to have the SCP apply to all EFS resources. Next, review the list of Condition keys available to determine which key, and its type that is used for encryption. The elasticfilesystem:Encrypted key is a Boolean type key. After reviewing the Boolean condition operator, we’re now ready to create our policy:
"Effect": "Deny",
"Action": [
"elasticfilesystem:CreateFileSystem"
],
"Resource": "*",
"Condition": {
"Bool": {
"elasticfilesystem:Encrypted": [
"false"
]
Conclusion
We have discussed how SCPs work, how to apply SCPs at scale within your organization, common SCPs, and how to build an SCP. This will enable you to raise the security bar of your organization by building preventive controls. This is just the beginning of your journey with AWS Identity and security on AWS. Resources for continuing your journey with Identity include Choosing the right mix of AWS IAM policies for scale, Next-generation permission management, and Use IAM Access Analyzer to preview access before deploying permissions changes
To continue learning more about preventive, detective, and reactive controls on AWS, resources on Control Tower, Guard Duty & Security Hub, and Config are a great place to start.
How and when to enable session cookies with Amazon CloudWatch RUM
=======================
Amazon CloudWatch RUM is a real user monitoring service that closes the gap between the end-user experience in a web application, and the serving of that content from your AWS or on-premises environment. By measuring client-side application performance, such as page load time and JavaScript errors, you have access to new and powerful tools for assessing users’ experiences as they traverse your web applications.
Amazon CloudWatch RUM provides an AWS-based, cloud-native client-side application telemetry solution that integrates directly into CloudWatch metrics, logs, and alarms, as well as Amazon CloudWatch Evidently and AWS X-Ray.
How it works
CloudWatch RUM works by collecting data from your web application and emitting that data to AWS for analysis. As shown in Figure 1 below, once CloudWatch RUM has received data from your application, you can examine metrics relating to sessions, page views, performance, errors, and HTTP requests. You can create alarms based on your targets, and optionally export data into CloudWatch logs where you can write queries to extract additional insights.
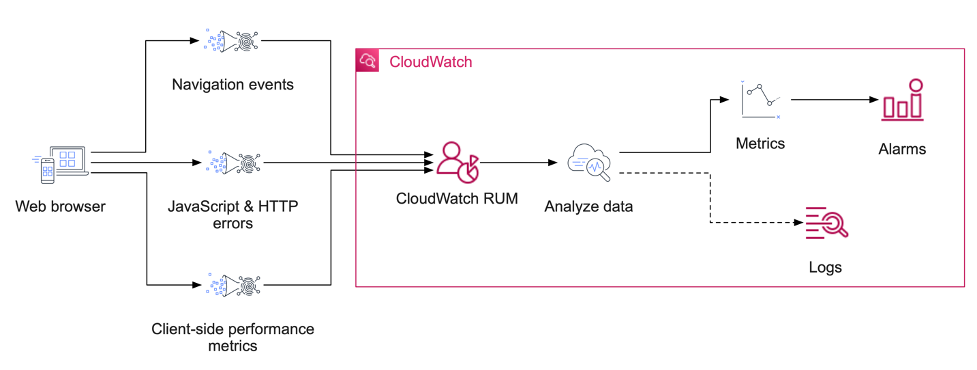
Figure 1: High-level overview of the flow of data into CloudWatch RUM
A key part of RUM is the concept of a session. A session aims to capture data pertaining to your web application’s performance while a single user of your application performs a task, or series of tasks. For example, if a customer visits your e-commerce site, adds an item to their cart, completes a purchase, and then leaves – this would be a single session. But, to persist a session across multiple page loads, RUM must set a cookie to identify and resume the session.
It is useful to understand these RUM cookies well in advance!
RUM web client cookies
Using cookies or cookie-like technologies may require the user’s consent in various jurisdictions. User consent and privacy law are beyond the scope of this post. Be mindful of relevant privacy laws when you create your application monitor and install the RUM web client in your application.
The CloudWatch RUM web client is a JavaScript library that records RUM data inside of your web application. The web client is downloaded and configured for your web application using a code snippet generated by the CloudWatch RUM console. The code snippet is placed in the <head> tag of your web application.
Although CloudWatch RUM continues to operate and provide valuable insights without cookies enabled, certain CloudWatch RUM features require cookies. For example, the number of active sessions, number of sessions with errors, and user journeys (where users land and drop off your application) are all metrics that require cookies.
The RUM web client sets two cookies: cwr_s (the session identifier) and cwr_u (the user identifier). Both the session identifier and user identifier are anonymous uuid v4 identifiers created specifically for use by the RUM system. They are not related to any user or session identifiers created by your application. See our documentation for more information.
Note: Personally identifiable information (PII), such as application-level user identifiers or email addresses, are not explicitly collected by CloudWatch RUM, and they are never available for analysis using this service. You must make sure that your application doesn’t leak PII to CloudWatch RUM through error messages or URLs. We built CloudWatch RUM to be secure and private by design. See our documentation for more information.
A newly created RUM application will present you with a script such as the following. In this example, we have enabled cookies:
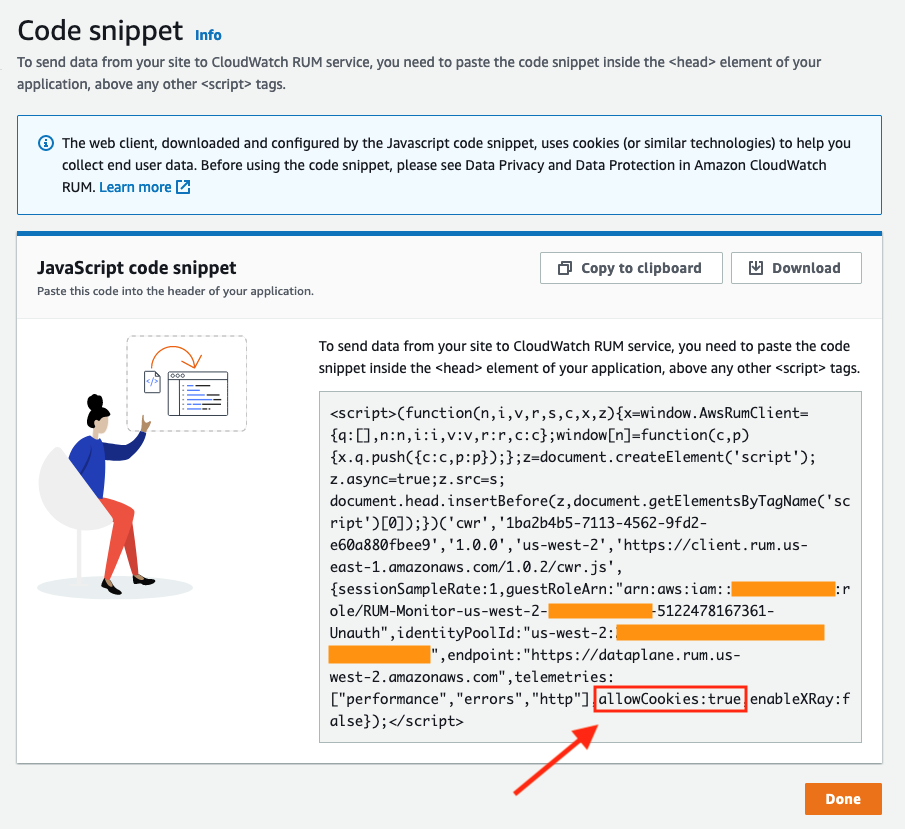
Figure 2: a sample of the output from the CloudWatch RUM app monitor creation page
How to enable cookies
When you create a new app monitor in the CloudWatch RUM console, you will be asked whether or not the CloudWatch RUM web client may use cookies.
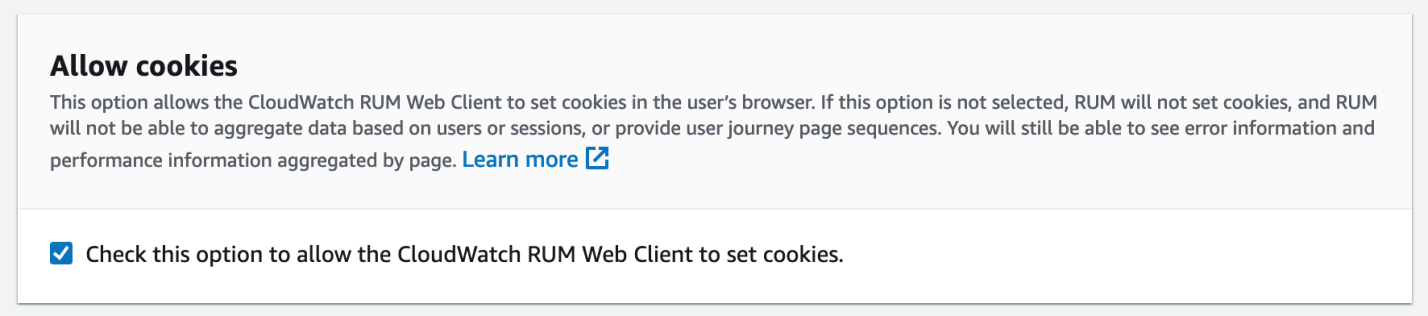
Figure 3: enabling cookies in the web client is configurable from the creation page
Checking this option adds the following configuration property to the code snippet provided to you after the app monitor has been created. And you will place it in your web application to install the CloudWatch RUM web client:
allowCookies: true
A complete example may look similar to the following (JSON expanded for readability):
<script>(function(n,i,v,r,s,c,x,z){x=window.AwsRumClient={q:[],n:n,i:i,v:v,r:r,c:c};window[n]=function(c,p){x.q.push({c:c,p:p});};z=document.createElement('script');z.async=true;z.src=s;document.head.insertBefore(z,document.getElementsByTagName('script')[0]);})
(
'cwr',
'cf16e469-bda3-4f8b-a9e3-64664dsample',
'1.0.0',
'us-east-2',
'https://client.rum.us-east-1.amazonaws.com/1.0.2/cwr.js',
{
sessionSampleRate:1, guestRoleArn:'arn:aws:iam::000000000000:role/RUM-Monitor-us-west-2-000000000000-1893821407361-Unauth',
identityPoolId:'us-west-2:f962e054-68c4-43ff-98d7-d98e33sample',
endpoint:"https://dataplane.rum.us-east-2.amazonaws.com",
telemetries:['errors','http','performance'],
allowCookies:true
}
);
</script>
This approach will let the web client use cookies as soon as it is initialized.
Alternatively, you can allow or disallow the web client to use cookies dynamically after it is initialized. Add the following JavaScript command anywhere in your application code after the snippet:
cwr('allowCookies', true);
And, with that, you can now emit session data into CloudWatch RUM!
How to use advanced cookie configurations
In some cases, the web application will need to override the default cookie attributes used by the web client. Such cases may include:
- The web application owns multiple sub-domains.
- The web application runs on a shared domain and uses a specific URL path.
- The web application does not use SSL.
For example, consider an application whose root URL is http://example.com/myapp. This application does not support SSL (is accessed using http only) and runs under the /myapp path, because it shares the example.com domain with other applications.
To enable RUM web client cookies for this application, we would add the cookieAttributes property to the web client configuration. The configuration argument of the code snippet would contain the following cookie configuration (truncated for readability):
{
...
allowCookies: true,
cookieAttributes: {
path: “/myapp”,
secure: false
}
}
You can learn more about the web client’s cookie configuration options from our documentation.
Results
Now that you have cookies enabled, you can take advantage of the user journey features of CloudWatch RUM.
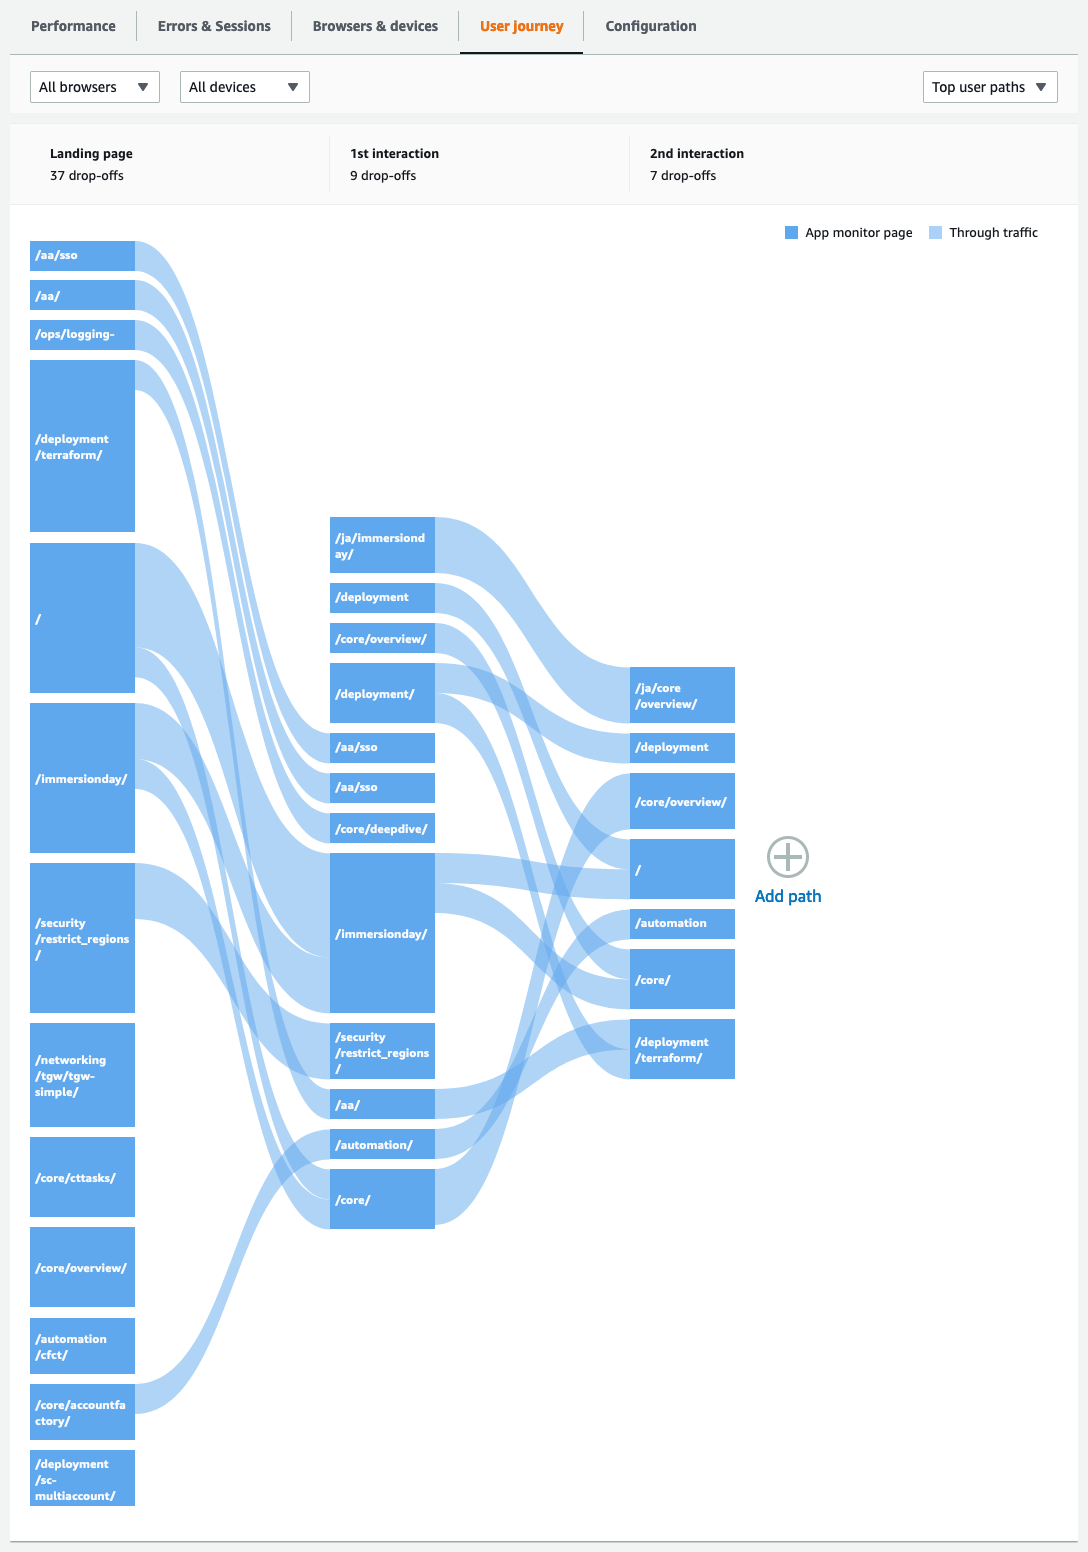
Figure 4: an example of the user journey view from within the CloudWatch RUM console
Next steps
Enabling cookies for CloudWatch RUM is only the beginning your journey with client-side telemetry, and there is a great deal more to learn from our documentation. Variable session sample rates, custom page view recording, configurable cookie domains, and variations in pages to include or exclude are all features that you can now take advantage of!
Migrate AWS Landing Zone solution to AWS Control Tower
=======================
Customers who wanted to quickly set up a secure, compliant, multi-account AWS environment had adopted AWS Landing Zone solution (ALZ). To reduce the burden of managing this ALZ, AWS has announced a managed service – AWS Control Tower (Control Tower).
AWS Control Tower creates your landing zone using AWS Organizations, thereby bringing together ongoing account management and governance, as well as implementation of best practices based on our experience of working with thousands of customers as they migrate to the cloud. AWS CT lets builders provision new AWS accounts in just a few clicks, while you have peace of mind knowing that your accounts conform to company-wide policies. AWS customers can implement AWS CT, extend governance into new or existing accounts, and quickly gain visibility into their compliance status.
ALZ is currently in long term support and will not receive any additional features. Therefore, it is recommended to migrate to the AWS Control Tower service from ALZ. In this post, we will go through different considerations for that migration and explain how you can plan a successful migration from ALZ to AWS CT.
Prerequisites and considerations:
New email addresses which have never been used in AWS Accounts:
1 for Log Archive account
1 for Audit/Security account
If you are using AWS SSO, then it must be in the same region where you are planning to deploy AWS CT.
The AWS management account can’t have trusted access enabled in the AWS Organization management account for either AWS Config or AWS CloudTrail. For information regarding how to disable trusted access, see the AWS Organizations documentation on how to enable or disable trusted access.
ALZ sets up Config recorder, delivery channel in member accounts, and you must remove these installations so that AWS CT can configure AWS Config on your behalf during landing zone setup.
Migration Process:
Step 1: Deploy AWS Control Tower
Before Control Tower sets up the landing zone (A landing zone is a well-architected, multi-account environment that’s based on security and compliance best practices), it automatically runs a series of pre-launch checks in your account that are mentioned here.
If AWS Single Sign-On (AWS SSO) is already enabled, then the AWS Control Tower must be deployed in the same region as AWS SSO. Control Tower will not delete an existing SSO configuration. If another directory (External Identity Provider, AWS SSO User Store, Active Directory) is set up, then Control Tower will not change the existing configuration. For more details, see Considerations for AWS Single Sign-On (AWS SSO) customers.
After making sure that you are in the same AWS region as AWS SSO, you can deploy AWS Control Tower in an existing AWS Organization as outlined in the AWS Control Tower User Guide, found at Getting Started, Step 2.
Control Tower comes out of the box with specific preventive guardrails to protect the Control Tower landing zone resources. Those mandatory guardrails will be applied on every organizational unit (OU) that will be registered by Control Tower.
External SCPs that are applied on the OU through AWS Organizations will co-exist along with Control Tower. However, you can’t see them or control them from the guardrails list as of today.
As there is a limit for SCPs in terms of size and number (maximum five policies per OU or account) of policies, Control Tower aggregate multiple SCPs in a single policy to be applied on the OU. Exceeding the maximum number of SCPs is not desired. Therefore, you must merge the policies to attach them to the OUs or accounts.
You must make sure that Control Tower roles has the rights to access and perform expected operations on the accounts and OUs. If you have applied very restrictive SCPs that might prevent Control Tower actions then we recommend removing it or excluding the AWS Control Tower roles from these SCP.
ALZ enables AWS Config in every member account, which creates a config recorder and delivery channel in regions specified in the manifest.
There are two ways to handle your existing AWS Config deployment and you can opt to one of these options:
- Delete AWS Config from existing accounts: Identify the member accounts that you want to enroll into Control Tower and delete the configuration-recorder and delivery channel from every Control Tower supported region. To delete Config from existing accounts, go to your the management account and navigate to AWS CloudFormation StackSets in the CloudFormation console and delete the stack instances of
AWS-Landing-Zone-Baseline-EnableConfig StackSet.
Note that EnableConfig StackSet deletion will stop resource change recording until the member account is enrolled into Control Tower. To minimize this time, plan this activity when there are fewer changes. Furthermore, try to enroll the account in Control Tower as soon as the prerequisites are met for the account.
Here are some example AWS Config CLI commands that you can use to determine the status of your configuration recorder and delivery channel. Replace the <aws-region> with the region you are working on. Run the following commands for every AWS member account and region where you have the deployed ALZ resources.
View commands (Optional):
aws configservice describe-delivery-channels --region <aws-region>
aws configservice describe-delivery-channel-status --region <aws-region>
aws configservice describe-configuration-recorders --region <aws-region>
If you have AWS Config enabled in an AWS region that is currently unsupported by Control Tower, then enable Config there later once the account is enrolled in Control Tower. You can use the methodology mentioned in this blog to extend Config Conformance Packs to newly enrolled accounts in Control Tower.
- Modify Config settings: Due to compliance requirements, if you don’t want to delete your existing Config deployment, then follow the steps outlined here to enroll AWS accounts in Control Tower that have existing AWS Config resources.
Note that Config is enabled using AWS-Landing-Zone-Baseline-EnableConfig CloudFormation StackSet, and the Config IAM role is deployed with the AWS-Landing-Zone-Baseline-ConfigRole StackSet. Therefore, to modify Config in every account, you must modify both the CloudFormation templates (aws-landing-zone-enable-config.template & aws-landing-zone-enable-config-role.template) as per the change in Config resources outlined in the documentation referred here and then update the StackSet. For the Config aggregation authorization (Step# 5c- from previous link), you will also need to run the AWS CLI command as outlined in that step.
Please follow method #2 only in case you don’t want to stop Config recording, otherwise it’s better to adopt method #1 that deletes the existing Config StackSet and let Control Tower deploy it again for you.
Step 4: Enrolling accounts and OUs
There are two ways to register accounts and OU to become managed by Control Tower. This is done either by relying on the native functionality from Control Tower to register an OU with every account under that OU, or by enrolling account by account.
In general if you are using the standard Account Vending Machine (AVM) and there are no customizations to it, then we recommend using the Register OU process described below.
In this section, we will explain both mechanisms and when to use each one.
-
Register OU:
This is the efficient way to extend the governance of multiple existing accounts within an OU under Control Tower. When you register an OU, its member accounts are enrolled into the Control Tower landing zone.
The two considerations to ensure with this mechanism are:
If you have nested OUs, then you need to register the parent OU first and the child next as per the hierarchy.
The OU should not exceed 300 accounts.
For more information on how to proceed with registering OUs from the Control Tower console, review the documentation.
When registering an OU, note that it takes time to register each account. Therefore, we recommend scheduling a maintenance window for registering OUs even if that doesn’t affect the running workload within the account.
Currently, there are two limitations you should be aware of while OU registration is in progress:
It’s not possible to create a new account via Account factory.
Creation or registration of another OU is not possible.
-
Enroll account by account:
Control Tower leverages AWS Service Catalog for account creation by using the “AWS Control Tower Account Factory” which is a Service Catalog Product.
⚠️If you have customized the AVM CloudFormation template for creating accounts (For example chaining within same service catalog product or customization related directly within account vending resource), then you might want to keep the existing AWS Service Catalog Product as well as the Provisioned product. You must update the section that trigger account provisioning with a new one for Control Tower Account Factory for example:
AccountVending:
Type: AWS::ServiceCatalog::CloudFormationProvisionedProduct
Properties:
ProductName: "AWS Control Tower Account Factory"
ProvisionedProductName: !Ref AccountName
ProvisioningArtifactName: "AWS Control Tower Account Factory"
ProvisioningParameters:
- Key: SSOUserEmail
Value: !Ref SSOUserEmail
- Key: AccountEmail
Value: !Ref AccountEmail
- Key: SSOUserFirstName
Value: !Ref SSOUserFirstName
- Key: SSOUserLastName
Value: !Ref SSOUserLastName
- Key: ManagedOrganizationalUnit
Value: !Ref ManagedOrganizationalUnit
- Key: AccountName
Value: !Ref AccountName
The two caveats to consider for this mechanism are:
Don’t update or change the Control Tower Service Catalog Portfolio or Product. These are managed by Control Tower and they will be reverted back to their original configuration.
Currently account enrollment or creation is single threaded (one account enrollment per time).
Step 5: Security, Shared Services, and log-archive accounts
Security Account:
Control Tower creates new member accounts called Audit/Security accounts that provide functionality similar to the Security account in an ALZ. You can’t retain or select an existing ALZ Security account when deploying Control Tower. If you have deployed any additional services, such as GuardDuty, Security Hub, and/or any third-party installations in the Security account then consider migrating them to the new Control Tower Audit account. Also, if you have configured any paging or alerting system for security notifications from a Amazon Simple Notification Service (SNS) topic in the Security account, then move that to the Audit account as well.
Log Archive Account:
Control Tower creates a new member account called a Log Archive account that is similar to the ALZ’s Log Archive account. You can’t retain or select existing ALZ Log Archive accounts while deploying Control Tower. Therefore, if you want to retain the logs from the ALZ log bucket, you can copy the existing logs from the ALZ log archive Amazon Simple Storage Service (S3) bucket (aws-landing-zone-*) to a new S3 bucket in the Control Tower Log Archive account. However, you can’t put these logs in the Control Tower Log Archive’s log bucket due to access restrictions. Furthermore, if you have setup any log analytics solutions to fetch the logs from the ALZ Log Archive S3 bucket, then they must be migrated to the new Control Tower Log Archive account. If you don’t want to bring the old logs from ALZ to Control Tower, then you can ignore this step and, in that case, you can just empty the ALZ S3 logs bucket and delete it later.
Shared Services Account:
Unlike in an ALZ, Control Tower doesn’t create a Shared Services account. You can choose to retain this account as-is in Control Tower. In that case, you will need to enroll this account in Control Tower using Account factory.
Step 6: Decommission ALZ
Before decommissioning ALZ resources, make sure that you have moved all your required resources from ALZ to the Control Tower environment.
From the management account, disable the transition between the source stage and build stage for the ALZ’s AWS CodePipeline pipeline. This will prevent inadvertent updates from source files from initiating a pipeline run and redeploying resources that you are trying to remove.
⚠️Attention
If you have deployed Landing Zone Add On products, please don’t terminate the associated AWS Service Catalog provisioned products.
Do not remove the CloudFormation stacks or StackSets, which are used to deploy the base line infrastructure in your accounts, such as VPC or IAM roles if they’re being used.
Delete Provisioned Products from the Service Catalog
If they are not in use by your workloads, then terminate the following prefixed Provisioned Products by clicking the three dots next to the product.
lz_core_*
Remove Products from Portfolios in the Service Catalog
For each portfolio in “Portfolios List”, i.e., “AWS Landing Zone – Baseline”, “AWS Landing Zone - Core” (ALZ 1.0) or “AWS Landing Zone - Add-On Products” (ALZ 2.0)
Remove all Constraints
Remove all Users and Groups
Remove the product from the portfolio
Navigate to the Portfolios List
Delete the portfolio
Delete Products from Service Catalog
For each product in “Products List”, i.e., “AWS-Landing-Zone-Account-Vending-Machine” and any other non-provisioned product with AWS-Landing-Zone-* select and delete them
Manually delete any remaining CloudFormation AVM Stacks with “(SO0045)” in the Description (there may be none if Service Catalog cleaned up correctly).
Delete any other Landing Zone CloudFormation Stacks EXCEPT the initiation template (SO0044) manually. Make sure you are not deleting any baseline infrastructure critical to your running workload.
If resources from below StackSets are not in use by your workloads, then delete them
        AWS-Landing-Zone-Baseline-EnableCloudTrail
AWS-Landing-Zone-Baseline-EnableConfig
AWS-Landing-Zone-Baseline-EnableConfigRules
AWS-Landing-Zone-Baseline-ConfigRole
AWS-Landing-Zone-Baseline-EnableConfigRulesGlobal
AWS-Landing-Zone-Baseline-EnableNotifications
AWS-Landing-Zone-Baseline-IamPasswordPolicy
AWS-Landing-Zone-Baseline-SecurityRoles
AWS-Landing-Zone-Baseline-PrimaryVPC
For the remaining unused StackSets which may still have stack instances, you may need to Manage those StackSets. Identify the accounts and enter the account numbers, regions, and delete the stack instances. Make sure that these StackSets don’t have the infrastructure currently in use by your workloads. After confirmation, if there are no Stack Instances, then you can simply delete the StackSet.
Delete the Logging Buckets in the Logging Account.
If you already copied the existing logs to a new AWS CT Log Archive account bucket, then delete the ALZ log bucket aws-landing-zone-*
Delete the following S3 buckets in the Master Account:
        aws-landing-zone-configuration-*
landingzone-landingzonepipelineartifacts*
Delete the Landing Zone initiation template
Delete the CloudFormation stack (you likely have to “Change termination protection” to allow deletion). If there are issues with the deletion of resources, then delete them manually and retry the stack deletion until successful. If retaining any resources from ALZ StackSets, then retain this IAM role “AWSCloudformationStacksetExecution”.
Clean up Organizations
Delete the core OU created by ALZ. Don’t delete any other OU which is created by AWS CT.
Go to the Policies tab to delete the Service Control Policy. Select the protect-cloudtrail-config, and select “Delete Policy”.
Delete all of the Landing Zone SSM Parameters
Navigate to Systems Manager -> Parameter Store, and delete all of the landing zone related parameters.
Make sure that the Landing Zone KMS Keys have been deleted
Navigate to IAM -> Encryption Keys, and Confirm that there are no keys.
If the key exists, then delete the alias using the CLI:
aws kms delete-alias --alias-name alias/AwsLandingZoneKMSKey
Terminate the ALZ Log Archive and Security account
Once you migrate the logs and the required settings to the newly created AWS CT accounts, then you may close these accounts.
Conclusion
In this post, we have outlined steps and best practices for migrating from the AWS Landing Zone (ALZ) solution to AWS Control Tower. Control Tower lets customers provision new AWS accounts with just a few clicks from the console while providing you with the peace of mind of that your new accounts will conform to company-wide policies. A reporting dashboard also quickly provides you visibility into your account’s compliance status.
Page 1|Page 2|Page 3|Page 4