Contents of this page is copied directly from AWS blog sites to make it Kindle friendly. Some styles & sections from these pages are removed to render this properly in 'Article Mode' of Kindle e-Reader browser. All the contents of this page is property of AWS.
Page 1|Page 2|Page 3|Page 4
SLOs Made Easier with Nobl9 and Amazon CloudWatch Metrics Insights (Preview)
=======================
This post was written by Natalia Sikora-Zimna, Product Owner at Nobl9
Amazon CloudWatch has recently launched Metrics Insights – a fast, flexible, SQL-based query engine that lets customers identify trends and patterns across millions of operational metrics in real time. Metrics Insights allows customers to easily query and analyze metrics to gain better visibility into the health and performance of their infrastructure and large-scale applications.
Nobl9 and Amazon Web Services (AWS) have collaborated to extend the existing Nobl9 CloudWatch integration with CloudWatch Metrics Insights (Preview). This will help users to retrieve metrics even faster and gain added flexibility in querying raw service level indicator (SLI) data to use for your SLOs.
Nobl9 launched the first version of its CloudWatch integration in September 2021, giving customers a versatile tool to monitor their products. CloudWatch collects data from over 70 AWS services, thereby providing AWS users with access to valuable infrastructure metrics. In addition, users can create their own custom metrics. Moreover, Nobl9’s CloudWatch integration provides customers with the power to translate these metrics into actionable SLOs. This means that companies have all of the information that they need to maintain a balance between cost and reliability, and to keep their customers happy.
CloudWatch Metrics Insights takes the SLO game to the next level. It’s an innovative analytics tool that works for both types of CloudWatch metrics: infrastructure and custom. The introduction of this feature lets Nobl9 customers benefit from using a powerful, SQL-based query engine for grouping, aggregating, and filtering metrics by labels in real time. This also helps them better organize their business insights. Furthermore, it gives users broad possibilities in defining metrics and choosing the granularity of insights that best fits their needs.
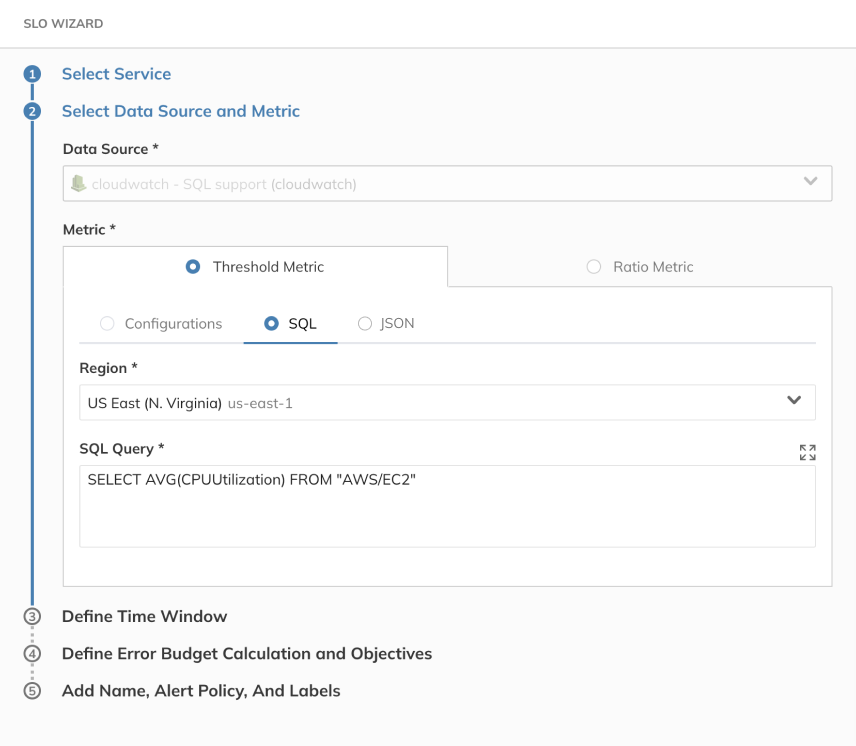
Metrics Insights comes with a query builder that lets customers select their metrics of interest, namespaces, and dimensions visually. Then the console automatically constructs Metrics Insights SQL queries based on their selections. Metrics Insights also provides a SQL query editor, where customers can type in raw SQL queries or edit the ones that they’ve created earlier and get down to the finest level of granular detail. Note that CloudWatch Metrics Insights comes with auto-completion support, which gives smart suggestions throughout the composition of the queries.
Once customers create their SQL queries, they can use them in the Nobl9 platform to set up SLOs that provide actionable data about multiple aspects of their business. Nobl9 keeps the integration as simple as possible: just choose the data center’s Region, and paste in the metric SQL query, exactly as it was created in CloudWatch.
CloudWatch Metrics Insights is available in all AWS Regions, except China.
If you’d like to learn more about Nobl9 and SLOs, then visit nobl9.com. If you’d like to try out the Nobl9 console and see how it can help your business, then sign up for a free 30-day trial.
To learn more about Metrics Insights, please refer to the CloudWatch Metrics Insights documentation.
The content and opinions in this blog are those of the third-party author and AWS is not responsible for the content or accuracy of this blog.
Use AWS Flexible Licensing options to optimize cost
=======================
License Flexibility
Many organizations have an existing investment in Microsoft licenses. This includes licenses for the Windows Server Operating System and Microsoft SQL Server. Customers who have decided to migrate to AWS often want to leverage their existing investment in Microsoft licenses to reduce the costs associated with the move. However, many customers also need additional flexibility in how their licenses are deployed on AWS, especially during the migration, or during times of fluctuating workloads.
AWS makes it possible to leverage your existing investment in Microsoft licenses through the use of Bring Your Own License (BYOL). BYOL lets customers deploy their existing Microsoft licenses in AWS and only pay for the underlying compute.
As of June 14th 2021 customers now have the flexibility to change the way that they license both Windows Server and Microsoft SQL Server products on existing Amazon Elastic Compute Cloud (EC2) Instances. Customers can change the license purchase option for their instances in AWS as business needs change. This lets them fully optimize existing licenses, and purchase licenses from AWS to cover additional requirements.
“AWS BYOL to LI conversion tool allowed us the flexibility to pay for on demand licensing and gradually pair down our SQL Server Licenses. This had a huge impact on our Microsoft renewal.”
– Luis Teixeira – Vistaprint
Per-second Billing
In addition to offering flexibility in the way that Microsoft licenses are used, AWS now offers per-second billing for license-included versions of Windows and SQL Server. Effective June 10th, customers using the License Included pricing model for the Windows Server Operating System and Microsoft SQL Server will now be billed in one-second increments. There are no changes required to receive this benefit, and customers are automatically converted to per-second billing for all instances.
Requirements for using Bring Your Own License:
Media
To bring your own license for either Windows Server or SQL Server, you must use your own media for the components that you want to leverage your own licenses for. This means that if you want to use your own Windows Server licenses, you must base the instance off of an Amazon Machine Image (AMI) that was created from your own Windows install media. You can create a BYOL AMI by importing a Virtual Machine to AWS using the BYOL licensing model. Available options for importing Virtual Machines to AWS AMIs include:
The AWS VM Import/Export service
The AWS Application Migration Service
To BYOL SQL Server, you must download the SQL Server installation media from Microsoft and install it on an EC2 instance.
Note that while you cannot use Amazon provided install media for instances that you want to leverage BYOL licensing, you can use Amazon provided licenses on media created from your own install media. This means that if you base your AMIs off of images created from your own install media, then you can easily swap licensing as needed.
Windows Server
In addition to the media requirement, to use your existing licenses for Windows Server on AWS, you must meet the following requirements:
The licenses must have been purchased prior to October 2019, or as a True-Up on a licensing agreement that was active prior to October 2019.
The EC2 instances must be hosted on Amazon EC2 Dedicated Hosts (not Dedicated Instances)
The Windows Server Licenses cannot have been obtained through MSDN or a Visual Studio subscription.
SQL Server
Determining eligibility for using BYOL SQL Server on AWS is more complicated. We strongly suggest getting in touch with an AWS Expert on Microsoft licensing to review your situation and determine the best way forward.
A post describing how to create your own AMIs for the Windows Server Operating System that are eligible for use via BYOL can be found here.
Additionally, for the required commands for license switching to be run on the EC2 instances, the instance must have the AWS Systems Manager (SSM) agent installed and running on your instances. The instance must also have an instance profile that lets it be managed via Amazon SSM. Requirements for this profile can be found here.
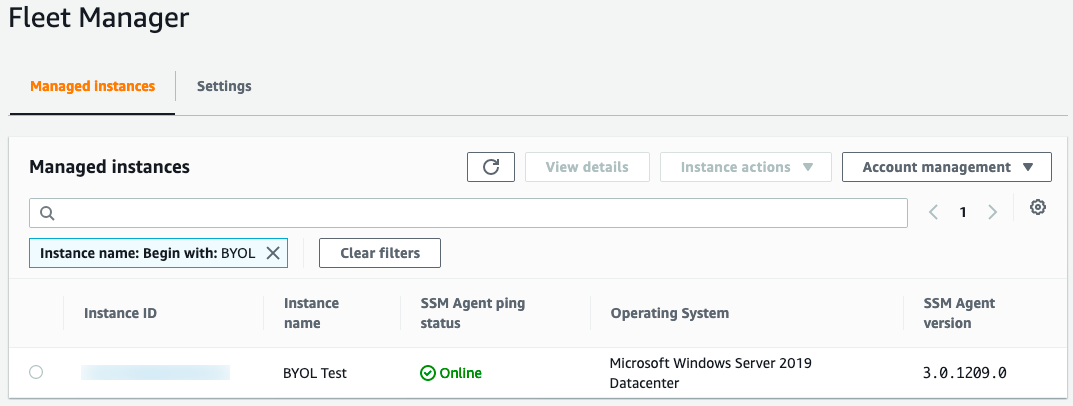
You can validate the Amazon SSM requirement by going to the Systems Manager section of the AWS Management Console, selecting Fleet Manager, and ensuring that the instance you want to change the license for appears in the list of Managed Instances.
Amazon EC2 instances created from AWS AMIs can only leverage the AWS Default License Included purchasing option. However, instances that have been created from AMIs based on your own install media can leverage either the License Included or BYOL purchasing options. As a result, you may want to consider using imported AMIs for instances that are not currently leveraging BYOL, but may be candidates for BYOL in the future.
Customers may find that their Windows licensing needs change over time. Licenses that were originally deployed in AWS via BYOL may need to be redeployed on premises due to changing business needs. Alternatively, customers may find that, as they migrate, they free up Windows Server licenses on-premises that can now be deployed into AWS to further optimize costs. Customers can temporarily or permanently change the license purchasing options associated with their infrastructure by using the new license switching feature.
This post assumes that you already have existing Amazon EC2 Instances configured and running in AWS.
How to change the licensing type for the instance
The following steps will walk you through the process of updating the license type for an instance currently running as BYOL. You can use a similar process to change the licensing type for other combinations of both SQL Server and Windows Server.
Log in to the AWS Management Console with full access to AWS EC2.
Find the instance that you want to convert the license for, and ensure that the instance is stopped. If the instance you want to convert does not appear in this list, then refer to the conversion prerequisites documentation here.
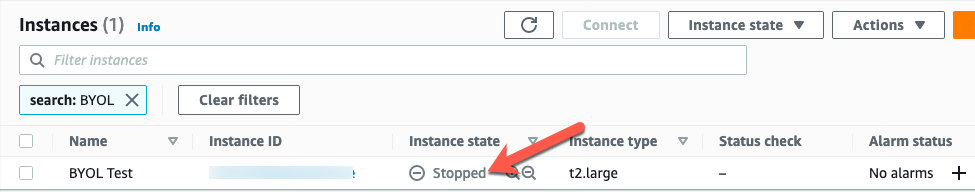
Note the instance details for the instance currently running under a BYOL license:
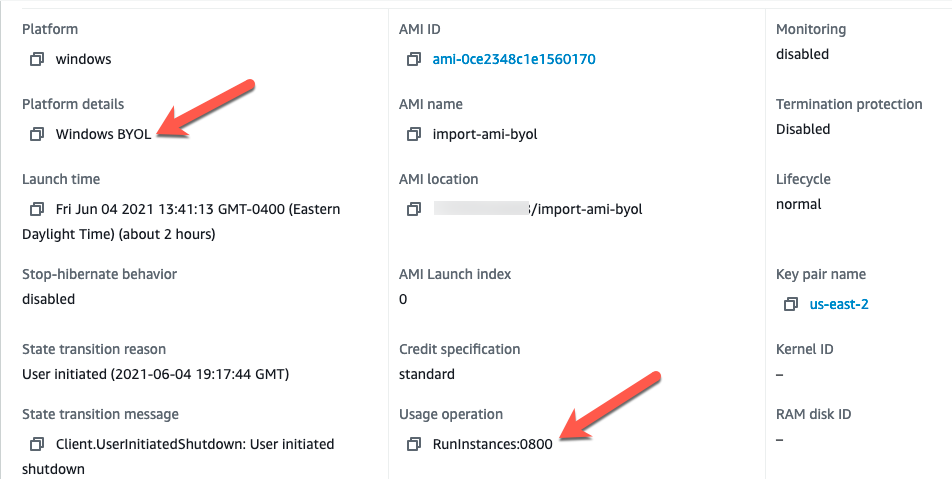
The Platform Details indicate ‘Windows BYOL’ and the Usage Operation code is set to ‘RunInstances:0800’.
Details about the Usage operation codes can be found here.
| Platform details |
Usage operation |
| SQL Server Enterprise |
RunInstances:0100 |
| SQL Server Standard |
RunInstances:0004 |
| SQL Server Web |
RunInstances:0200 |
| Windows |
RunInstances:0002 |
| Windows BYOL |
RunInstances:0800 |
| Windows with SQL Server Enterprise |
RunInstances:0102 |
| Windows with SQL Server Standard |
RunInstances:0006 |
| Windows with SQL Server Web |
RunInstances:0202 |
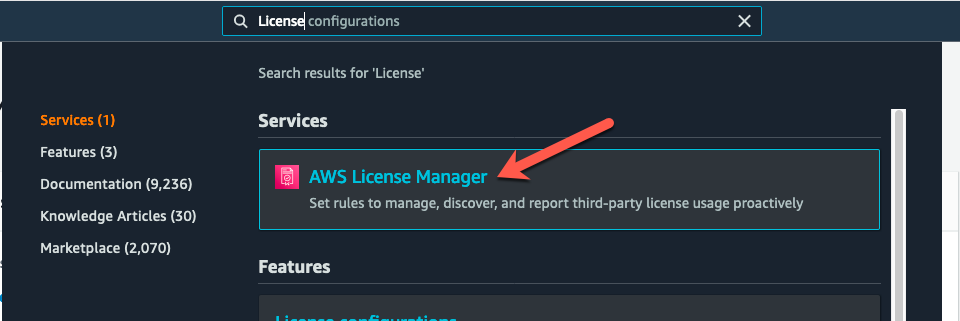
License switching is accomplished in the AWS Management Console, under the License Manager service. From the console, select License Manager.
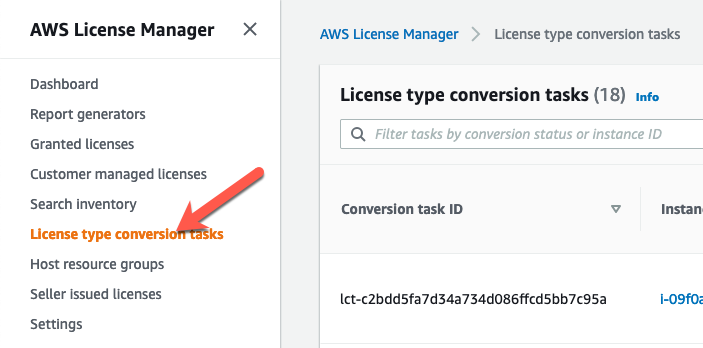
Once in License Manager, select License Conversion Tasks.
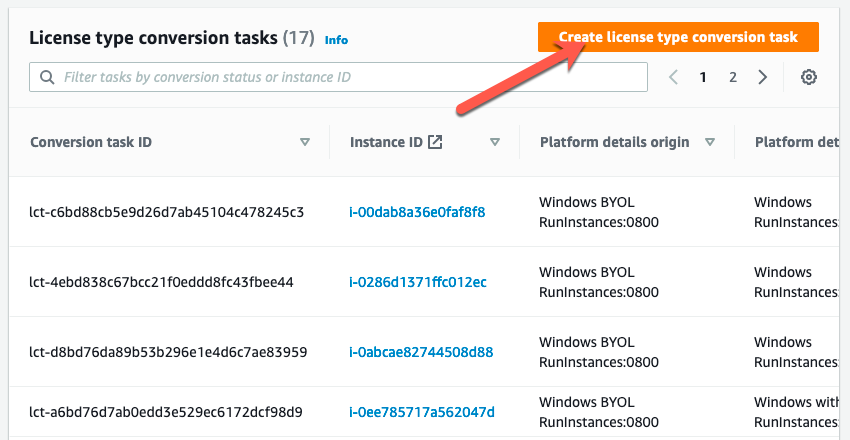
You can see a list of any license conversion tasks that you have run in the past, along with an option to create a new conversion. Choose “Create license conversion task”.
You will be presented with an option that lets you select the instance that you want to convert the license for.
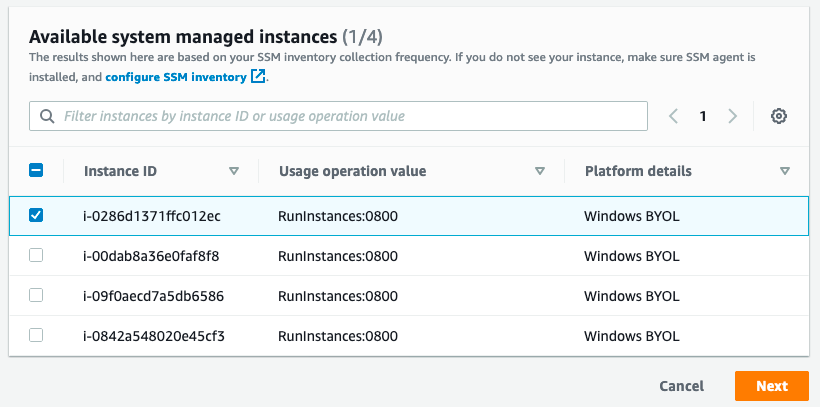
An instance that you want to convert may not show up in this list for a few reasons:
The instance is currently running.
The instance does not have an instance profile with the “AmazonSSMManagedInstanceCore “policy.
The instance may not have access to the Amazon SSM service either through outbound access to the internet or a private endpoint.
Once the instance you want to convert is present in the list, select the instance ID from the list, and then select Next.
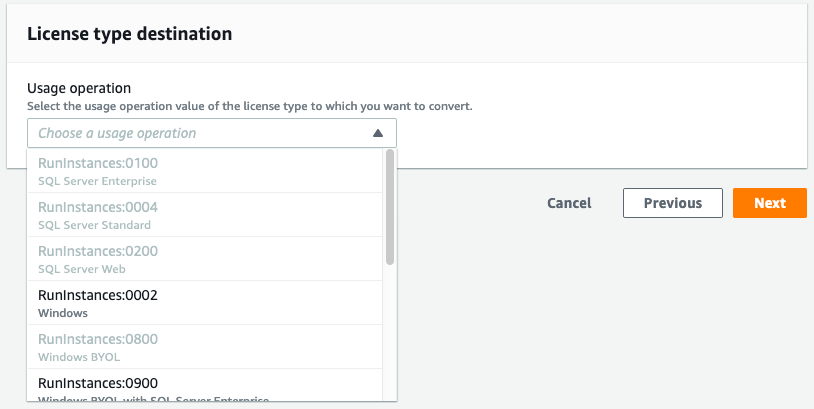
The next dialog box will let you select the destination license type. Only valid conversion options will be made available to you. For example, the image that I am currently converting is a Windows BYOL instance. Therefore, I have the option to convert this instance to “Windows”, which means Windows License included, but not to Windows BYOL.
If you select an option that includes SQL Server, for example Windows BYOL with SQL Server Standard, then the conversion process will validate that you have SQL Server installed, and that it is the correct version of SQL Server for the license that you selected.
Options exist for both SQL Server and Windows to be licensed in any combination of BYOL and LI. For example, you may choose to bring your own Windows License, but license SQL Server from AWS. In the event that you want to use either Windows BYOL, or Windows BYOL and SQL Server BYOL, then you should select the option for “Windows BYOL”, as this option does not include licensing for either the Windows OS or SQL Server.
Select the option that you want to convert to, and then choose Next.
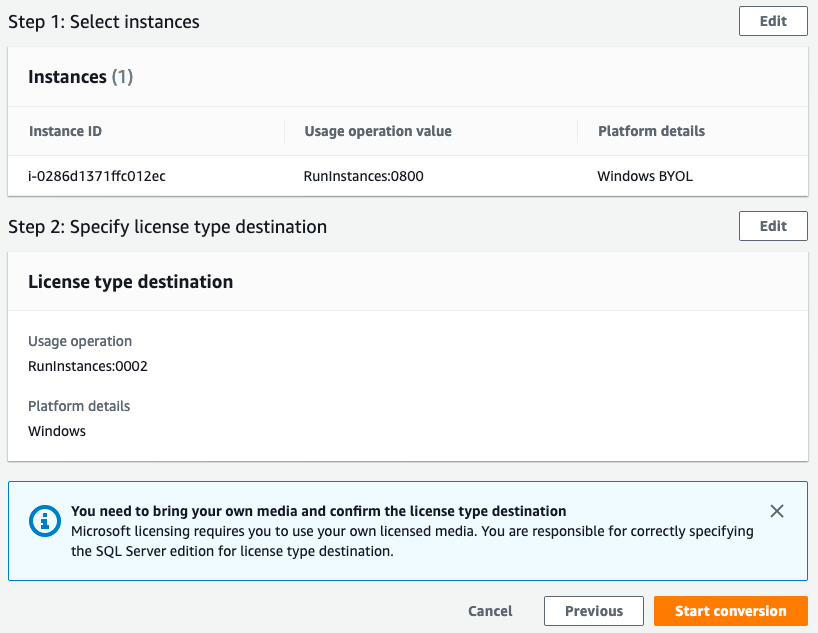
You will be presented with a confirmation dialog that shows the conversion task that will be performed. Click Start the conversion task to make the licensing change.
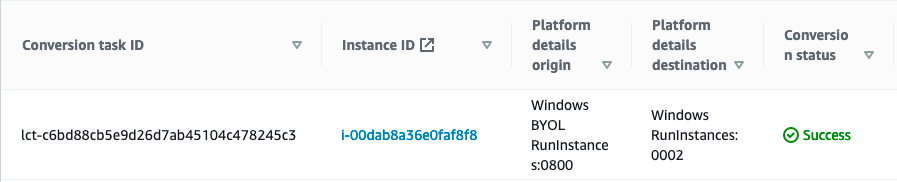
Once the conversion task has been completed, you will see the results in the list of conversion tasks. While the license conversion task is being completed, the instance may be started and stopped multiple times to validate configuration items, such as license type, media source, and SQL Editions.
The amount of time that a license conversation task takes will vary depending on the conversions being made. Converting a Windows license will be a fast process, while converting the license for an SQL Server instance will take longer due to the SQL Server validation that occurs.
Conversion tasks may fail if it is determined that the instance was based off of AWS supplied media, or that you are trying to convert the license for SQL Server to a different version than what is installed on the instance.
Once your license conversion task has been completed, you can start the instance and run with the new licensing model in place.
Customers can use the license conversion functionality multiple times as their licensing needs change so long as they meet the media requirements. In addition to changing the license type, customers may have to change the hosting tenancy to remain complaint with licensing terms. See documentation for details.
Summary
In this post, we covered two new changes that increase the flexibility for customers running Microsoft workloads on AWS. This added flexibility will help customers maximize the use of existing licenses on AWS, as well as reduce the costs for instances that are used for short periods of time.
While this change to per-second billing will result in price reductions for many workloads, it also opens up flexibility to customers in the ways that they use Windows and SQL Server.
If you have questions about Microsoft Licensing on AWS, contact your account team or our dedicated team of Microsoft Experts at: microsoft@amazon.com.
AWS attendee guide for Cloud Operations track at re:Invent 2021
=======================
AWS re:Invent is a learning conference hosted by Amazon Web Services (AWS) for the global cloud computing community. We are super excited to join you at the 10th annual re:Invent to share the latest from AWS leaders and discover more ways to learn and build. Let’s celebrate this milestone which will be offered in person in Las Vegas (November 29-December 3) and virtually (November 29–December 10). The health and safety of our customers and partners remains our top priority, and you can learn more about it in health measures page. For details about the virtual format, check out the virtual section. If you haven’t already registered, then don’t forget to register and save your spot at your favorite sessions.
The AWS Cloud Operations track at re:Invent offers you sessions that help you enable, provision, and operate your cloud environments for speed with built-in governance control. The sessions vary from intermediate (200) through expert (400) levels, and they help you accelerate the pace of innovation in your business. This post highlights the sessions from the Cloud Operations track that you shouldn’t miss.
Breakout Sessions
AWS re:Invent breakout sessions are lecture-style and one hour long. These sessions are delivered by AWS experts, customers, and partners, and they typically include 10–15 minutes of Q&A at the end. For our virtual attendees, breakout sessions will be made available on-demand in the week after re:Invent.
Level 200 – Intermediate
COP201 Gain enterprise visibility with AWS Cloud operation dashboards
Learn the tools of the trade in operating your AWS environment at scale. Whether you are in Cloud Operations, Application Administration, Compliance, Security or all of the above, AWS has the tools and technology solutions to enable you to manage your cloud operations reliably and with observability. In this session, you will learn what tools are available to manage and operate your AWS landscape that is compliant by design at all times.
COP202 Improving cost visibility and allocation
Improve financial transparency and define a cost-allocation strategy tailored to meet the complex needs of your business. Join this session and learn how to organize cost and usage for even the most complex organizations across dimensions specific to your workload. Through AWS products such as AWS Cost Explorer, AWS Cost and Usage Report, AWS Cost Categories, and AWS Application Cost Profiler, you can establish the necessary cost visibility and accountability within your organization and start running your IT shop like a business.
COP203 Cost control and governance at scale
Govern cloud usage and avoid cost surprises, all without slowing down innovation within your organization. In this session, learn how to set up guardrails, such as auto-cost-control actions in AWS Budgets or the ML-powered product AWS Cost Anomaly Detection. Discover the latest enhancements in the cost-control space, and learn how you can establish these safeguards to let your builders focus on what they do best—build!
COP205 Cloud operations at scale with AWS Managed Services
In early 2021, AWS Managed Services (AMS) added AMS Accelerate, a capability that lets AWS operations engineers work alongside customer and partner engineering teams to deliver AWS operations services, such as monitoring, backup, patch, and security operations, via AWS security, management, and governance services. In this session, hear from GE about why they chose to add AMS to their operations suite and the outcomes that they’ve realized, followed by an overview of AMS Accelerate.
COP206 Observability, the open-source way
In this session, learn about best practices and real-world use cases for Amazon Managed Service for Prometheus (AMP), Amazon Managed Grafana (AMG), and AWS Distro for Open Telemetry(ADOT) to gain observability. Setting up observability is critical to managing and maintaining your application and infrastructure health. Open-source-based solutions such as AMP, AMG, and ADOT can help you easily set up observability for your workloads on containers, Amazon EC2, and on-premises environments, to name a few.
COP207 Inside Amazon operations: How Amazon Alexa gains observability
In operations, observability can be hard to achieve due to sheer system complexity. However, AWS observability services, such as Amazon CloudWatch, let you detect, investigate, and remediate problems for both AWS and non-AWS resources to increase your operational health. In this session, learn about the latest observability capabilities and how Amazon Alexa uses CloudWatch to maximize its return on investment, matching daily costs and usage versus budget. Using CloudWatch, Alexa gains visibility, identifying high spend and budget variances, managing overspending risk, highlighting trend forecasts, and using data for forecasting.
COP219 AWS Cloud Operations Model panel discussion: A 360-degree view
In this session, industry leaders from AWS, as well as an AWS customer and an AWS Partner, share their paths to success with the Cloud Operations Model on AWS. Built on Amazon’s 20+ years of experience in operations management, as well as customer feedback, the Cloud Operations Model describes the roles, processes, and tools that can help you build and operate securely and successfully on the cloud. Join this session to hear how AWS has enabled cloud operations internally, enterprises have used the model to drive operational outcomes, and AWS Managed Services (AMS) and AWS Partners are supporting customers as they move to the cloud.
COP220 Automate account provisioning and customization with AWS Control Tower
Do you need to create many accounts or create accounts regularly while making sure that they meet user needs and your business and security policies? If so, then join this session to learn how to provision and customize an AWS Control Tower managed account before delivering it to end users.
COP221 Gain health and performance insights using Amazon CloudWatch
To achieve your operational and business objectives, you can’t afford to have low data visibility. You must be able to answer a wide range of questions (for example, “Is my system up or down?” or “Is it fast or slow, as experienced by my end users?”). Observability solutions can help you collect and analyze data from applications and infrastructure so that you can understand their internal states and be alerted to, troubleshoot, and resolve issues with application availability and performance to improve the end user experience. Join this session to learn the latest on Amazon CloudWatch.
COP222 Maintain application availability and performance with Amazon CloudWatch
Avoiding unexpected user behavior and maintaining reliable performance is crucial. This session is for application developers who want to learn how to maintain application availability and performance to improve the end user experience. Also, discover the latest on Amazon CloudWatch.
COP223 Optimize your applications through user insights with Amazon CloudWatch
In this session, learn how you can get insight into your application’s client-side performance and enhance your end user experience. Then, discover how to use Amazon CloudWatch Synthetics to proactively monitor endpoints and simulate end user workflows 24/7, while also getting alerted for issues. Finally, learn how Booking.com is evolving their web application monitoring for complete insights using CloudWatch.
COP224 Operate applications in cloud and hybrid environments using Systems Manager
When moving to the cloud, many enterprises run application workloads in both cloud and hybrid environments. Use the proven AWS approach to deploy a few (or a few thousand) applications to the cloud rapidly, while ensuring continued operation with your on-premises investments. In this session, learn how to use AWS Systems Manager to manage servers and to view and automate operational data on AWS and in your on-premises data centers with a single interface.
Level 300 – Advanced
COP301 Cloud compliance, assurance, and auditing
In this session, learn how to continuously assess, manage, and maintain compliance for formalized standards, such as those required by the Federal Risk and Authorization Management Program (FedRAMP), National Institute of Standards and Technology (NIST), and others. Also, learn about various auditing options, including auditing privileged access across services like Amazon S3 and Amazon DynamoDB. Dive deep into how you can achieve governance and compliance using preventive and detective guardrails and other AWS services.
COP302 Best practices for centralized operations management on AWS
In this session, learn how to build, manage, and operate your mission-critical applications in a secure, automated, reliable, and cost-effective way. This session covers how you can use a single control plane across multiple AWS solutions to manage and govern resources on AWS, on premises, and in hybrid environments. Join this session to learn how to streamline application management, incident management, and compliance management to manage mission-critical applications and services better.
COP312 Securing and governing your AWS environment at any scale
In this session, learn best practices to manage the security of your AWS accounts and govern your AWS environment. These best practices apply to organizations of any size, whether you are a small startup just getting started, or a large enterprise looking to learn and implement the latest from AWS. Services discussed include AWS Organizations, AWS Control Tower, AWS Single Sign-On, Amazon Security Hub, AWS Identity and Access Management Access Analyzer, and more!
COP313 Inside Amazon operations: Operations automated at scale
In this session, learn about Amazon’s CloudRanger solution that uses AWS Systems Manager to automate operations, including the deployment of security agents to more than 1.2 million Amazon EC2 instances. CloudRanger agents collect telemetry on Amazon EC2 instances and take necessary action when issues are detected. Discover how Amazon handles incident management to enable faster resolution of critical application availability and performance issues, as well as new developments with the Systems Manager service.
Level 400 – Expert
COP401 Customizing and scaling your AWS Control Tower environment
AWS Control Tower provides the easiest way to set up and govern a secure, multi-account AWS environment. Users can further customize their AWS Control Tower landing zones with the Customizations for AWS Control Tower (CfCT) solution. In this session, discover best practices for deploying a scalable CfCT pipeline that lets you test your customizations in a lower environment before promoting them to a production landing zone. Learn about some of the most common CfCT customizations that you should consider for your landing zone, including identity and network management and governance.
Builders’ Sessions
Builders Sessions are small-group sessions led by an AWS expert who guides you as you build the service or product. Each builders’ session begins with a short explanation or demonstration of what you are going to build. Once the demonstration is complete, use your laptop to experiment and build with the AWS expert.
Level 300 – Advanced
COP320 Application management on AWS
In this builders’ session, learn how you can use the AWS application in AWS Service Catalog AppRegistry to group and manage resources. See an overview of application management in AWS and learn about AWS Service Catalog AppRegistry and AWS Systems Manager Application Manager. Then, get hands-on to create a three-tier web application using AWS Service Catalog, associate metadata to the application, and use Amazon CloudWatch to generate application insights, create a dashboard, and execute an AWS Systems Manager Automation Runbook.
COP321 Observability for your cloud operations
In this hands-on builders’ session, learn about observability for your cloud operations. Select your own challenge from Amazon CloudWatch and AWS X-Ray use cases. Discover how to get started with observability, review common use cases, and explore advanced topics such as CloudWatch metric math. Bring your laptop to this session.
COP322 Best practices for operational excellence
In this builders’ session, dive deep into how to use AWS cloud operations services to maintain operational excellence in a modern enterprise. Discover the many options available, such as automation, through services like AWS Systems Manager, configuration compliance via AWS Config, maintaining observability and auditability with Amazon CloudWatch and AWS CloudTrail, and more.
Chalk Talks
Chalk Talks are highly interactive sessions with a small audience. Experts lead you through problems and solutions on a digital whiteboard as the discussion unfolds. Each begins with a short lecture (10–15 minutes) delivered by an AWS expert, followed by a 45- or 50-minute Q&A session with the audience.
Level 200 – Intermediate
COP204-R1 and COP204-R2 Eight Ways to control and manage AWS costs
Take control of your AWS spend and make the best out of AWS billing and cost management services. Join our discussion and explore ways to improve budget setting and detect and address cost spikes proactively. Learn about resources you can use to select and track your purchase commitment and curtail spend based on your spend pattern.
COP208 AWS Managed Services: Security, compliance, and operations
AWS Managed Services (AMS) helps hundreds of organizations operate their AWS infrastructure more efficiently and securely. Are you wondering how we do it? In this chalk talk, discover the AWS tools, processes, and people that AMS uses to help operate and secure the AWS infrastructure of our customers. Whether you need help from AMS or want to gain a new perspective on cloud operations, this session gives you a high-level overview of how AMS detects, investigates, and resolves issues with organizations’ AWS infrastructures while continuing to scale.
Level 300 – Advanced
COP303-R1 and COP303-R2 How to prepare your cloud environment for scale and migrations
According to Gartner, 80% of enterprises are planning data center closures by 2025, versus 10% today. Join this chalk talk to learn best practices from cloud foundations and the AWS Well-Architected Framework Management and Governance Lens on the importance of having a well-architected AWS environment for migrations, operational efficiency, and the ability to scale in meeting your business needs.
COP304 Application management best practices on AWS
In this chalk talk, learn how to simplify application management by standardizing cloud patterns and reducing development time while remaining compliant. Learn how to use AWS Service Catalog AppRegistry and AWS Systems Manager Application Manager to incorporate governance and version control for your applications while maintaining developer speed. Learn how cloud engineering teams across the organization can build and deploy applications consistently using AWS Systems Manager, Amazon CloudWatch, AWS Service Catalog, and AWS Organizations.
COP305-R1 and COP305-R2 Cloud compliance and auditing best practices on AWS
In this chalk talk, learn the various ways that you can achieve industry and configuration compliance with the help of AWS Cloud operations services. Also, learn the best practices for auditability, including ways that you can maintain appropriate auditing for formalized compliance standards, such as the Federal Risk and Authorization Management Program (FedRAMP) and National Institute of Standards and Technology (NIST).
COP306-R1 and COP306-R2 Observability best practices on AWS
In this chalk talk, learn observability best practices that let you efficiently run your applications on AWS. Learn how to monitor your end user experiences with solutions such as Amazon CloudWatch Synthetics, which help you gain visibility into application components and identify bottlenecks using CloudWatch ServiceLens and AWS X-Ray. Also, learn how to manage workloads on containerized and serverless infrastructures using CloudWatch Container Insights and CloudWatch Lambda Insights. Looking for better ways to cut the chaos and dive deep into your observability telemetry? Learn more about CloudWatch Logs Insights, X-Ray Analytics, and metrics analytical capabilities to isolate issues across your application and infrastructure.
COP314 Best practices for operating in a modern enterprise
In this chalk talk, learn how to use AWS cloud operations services to maintain operational excellence in a modern enterprise. Discover the many options available, such as automation through services like AWS Systems Manager, configuration compliance via AWS Config, maintaining observability and auditability with Amazon CloudWatch and AWS CloudTrail, and more.
COP315 Observability on a single platform on AWS
In this chalk talk, learn how Amazon CloudWatch collects monitoring and operational data in the form of logs, metrics, and events, providing a unified view of resources, applications, and services running on AWS and on-premises servers. Explore how CloudWatch is used to detect anomalous behavior, set alarms, visualize logs and metrics side-by-side, take automated actions, troubleshoot issues, and provide insights to keep your applications running smoothly. Discover how AWS X-Ray can help you understand how your application and its underlying services are performing to identify and troubleshoot root cause issues and errors.
COP316-R1 and COP316-R2 Open-source observability
In this chalk talk, dive deep into how Amazon Managed Service for Prometheus (AMP) automatically scales as your workloads grow or shrink and integrates with AWS security services to enable fast and secure access to data. Discover how Amazon Managed Service for Grafana (AMG) can be used to analyze your metrics, logs, and traces without having to provision servers; configure and update software; and do the heavy lifting involved in securing and scaling Grafana in production.
COP317 Governance and application management on AWS
In this chalk talk, dive deep into how applications can be used to manage AWS resources in a logical group that operates as a unit. Learn how these logical groups can be used to represent different versions of an application, ownership boundaries for operators, or developer environments, to name a few. Discover how to manage resources like container clusters, Amazon EC2, and AWS CloudFormation; create repositories of your applications and associated resources; and define and manage your application metadata, which can be used to understand the applications and resources across your environments.
COP318 Best practices for effective application management at AWS
This session introduces best practices for end-to-end management of the resources within applications. We discuss organizing resources with AWS Service Catalog AppRegistry applications, using tags, and tag-based Resource Groups. We also explore attribute-based access control for managing applications. We also show you AWS Systems Manager Application Manager to monitor operational and compliance status, and execute runbooks against your applications. We demonstrate how to synchronize console and API changes to your CloudFormation Stacks. Lastly, we show you how to use synchronized Stacks to redeploy a clone to new environment, migrating from manually created resources.
COP319 Best practices for multi-account environments
In this chalk talk, discover the key decision points for setting cloud governance to reduce complexity and time to market. Learn how to govern a secure, multi-account cloud environment and best practices for account management, security boundary isolation and structure, and gaining visibility into configuration compliance. Explore the importance of extending AWS Control Tower to new and existing accounts, considerations for AWS Organizations structure, and best practices for guardrail management across the enterprise.
Workshops
Workshops are two-hour interactive learning sessions where you work in small group teams to solve problems using AWS services. Each workshop starts with a short lecture (10–15 minutes) by the main speaker, and the rest of the time is spent working as a group. Come prepared with your laptop and a willingness to learn!
Level 300 – Advanced
COP307 Observability best practices for modern and traditional applications
Observability can be hard to achieve due to sheer system complexity. Whether in data centers or in the cloud, to achieve operational excellence and meet business objectives, you must understand how your systems are performing. This workshop dives deep into ways that you can use observability to detect and investigate problems while gaining and maintaining observability of your modern and traditional applications. Get hands-on experience with the most common use cases, understand when to use observability, learn about and implement the newest features available, and learn about the growing range of observability solutions, both AWS-native and open source.
COP308 Cloud operations on AWS
In this hands-on workshop, dive deep into ways that you can operate your cloud and on-premises environments, including infrastructure and applications. Pick your own hands-on challenge to focus on managing and automating infrastructure, application management and governance, and compliance management and assurance.
COP309 Managing multi-account environments following best practices
Most customers use multiple AWS accounts to consume AWS Cloud services. This workshop teaches you foundational multi-account concepts and patterns that many large AWS customers have used to scale their cloud environments. Learn to create and organize your AWS accounts following AWS recommended practices. Also, learn how to tackle the four core foundational elements of any cloud environment by implementing identity and guardrails, tag governance, networking, and logging capabilities.
COP310 Cloud compliance and assurance
In this hands-on workshop, learn how to assess and manage compliance and security drift in the cloud. Explore how to map the three lines of defense to automated compliance management, continuous oversight, continuous assessment, and automated evidence gathering and reporting. Also, receive guidance on how to break down silos between business owners, operations, security, compliance, and audit teams using services related to cloud compliance and assurance.
COP311 Build your own customizable cost reporting dashboards
Get actionable insights to track your AWS cost and usage performance, drive cost-efficient consumption behavior in your organization, and make cost-aware architectural decisions. Join this workshop to learn how you can integrate AWS Cost and Usage Reports with Amazon QuickSight, and build your own dashboards to visualize specific KPIs and savings opportunities that are meaningful to you and your business.
In addition to these sessions, we offer leadership sessions through which you can hear directly from AWS leaders as they share the latest advances in AWS technologies, set the future product direction, and motivate you through compelling success stories. Also, expect to hear about the launch of new and exciting AWS services and features throughout the event.
Still looking for more?
We have an extensive list of curated content on AWS Management and Governance, including case studies, white papers, previous re:Invent presentations, reference architectures, and how-to instructional videos. Check it out here! Subscribe to our AWS Management and Governance YouTube channel to get updates when new videos are added.
How to validate authentication using Amazon CloudWatch Synthetics – Part 2
=======================
In the second post of this two-part series, I will demonstrate how to utilize the Amazon CloudWatch Synthetics canary that uses the multiple HTTP endpoints blueprint in order to monitor an application requiring an authentication certificate. The first post Multi-step API monitoring using Amazon CloudWatch Synthetics provided steps to create an Amazon CloudWatch Synthetics script for executing a multi-step API verification. I also provide an additional reading section in this blog post that discusses certificate validation methods in the context of canaries.
Solution Overview
In the solution, I demonstrate the steps to create an API canary blueprint by using the HTTP Steps feature that incorporates a certificate to test an HTTP endpoint.
Creating the HTTP steps
CloudWatch Synthetics lets you utilize blueprint scripts that are ready to be consumed. However, we must utilize the editor in the console to add the extra code snippets in order to authenticate with a certificate.
To simulate how CloudWatch Synthetics handles authentication we will use the client.badssl.com website. You can also use your own HTTP endpoint to simulate the same output. The first call will return a failure response, as the certificate has not yet been added. However, the error will be fixed in the next steps.
To create an HTTP steps script:
- Open the Synthetics menu of the CloudWatch console.
- Choose Create Canary.
- Choose API canary from the blueprints list.
- Under Name, enter a name for your canary – for example, http-steps-test.
- Under HTTP requests, choose Add HTTP request.
- Under method, select the method GET.
- Enter the URL https://client.badssl.com/ under the Application or endpoint URL.
- Choose save.
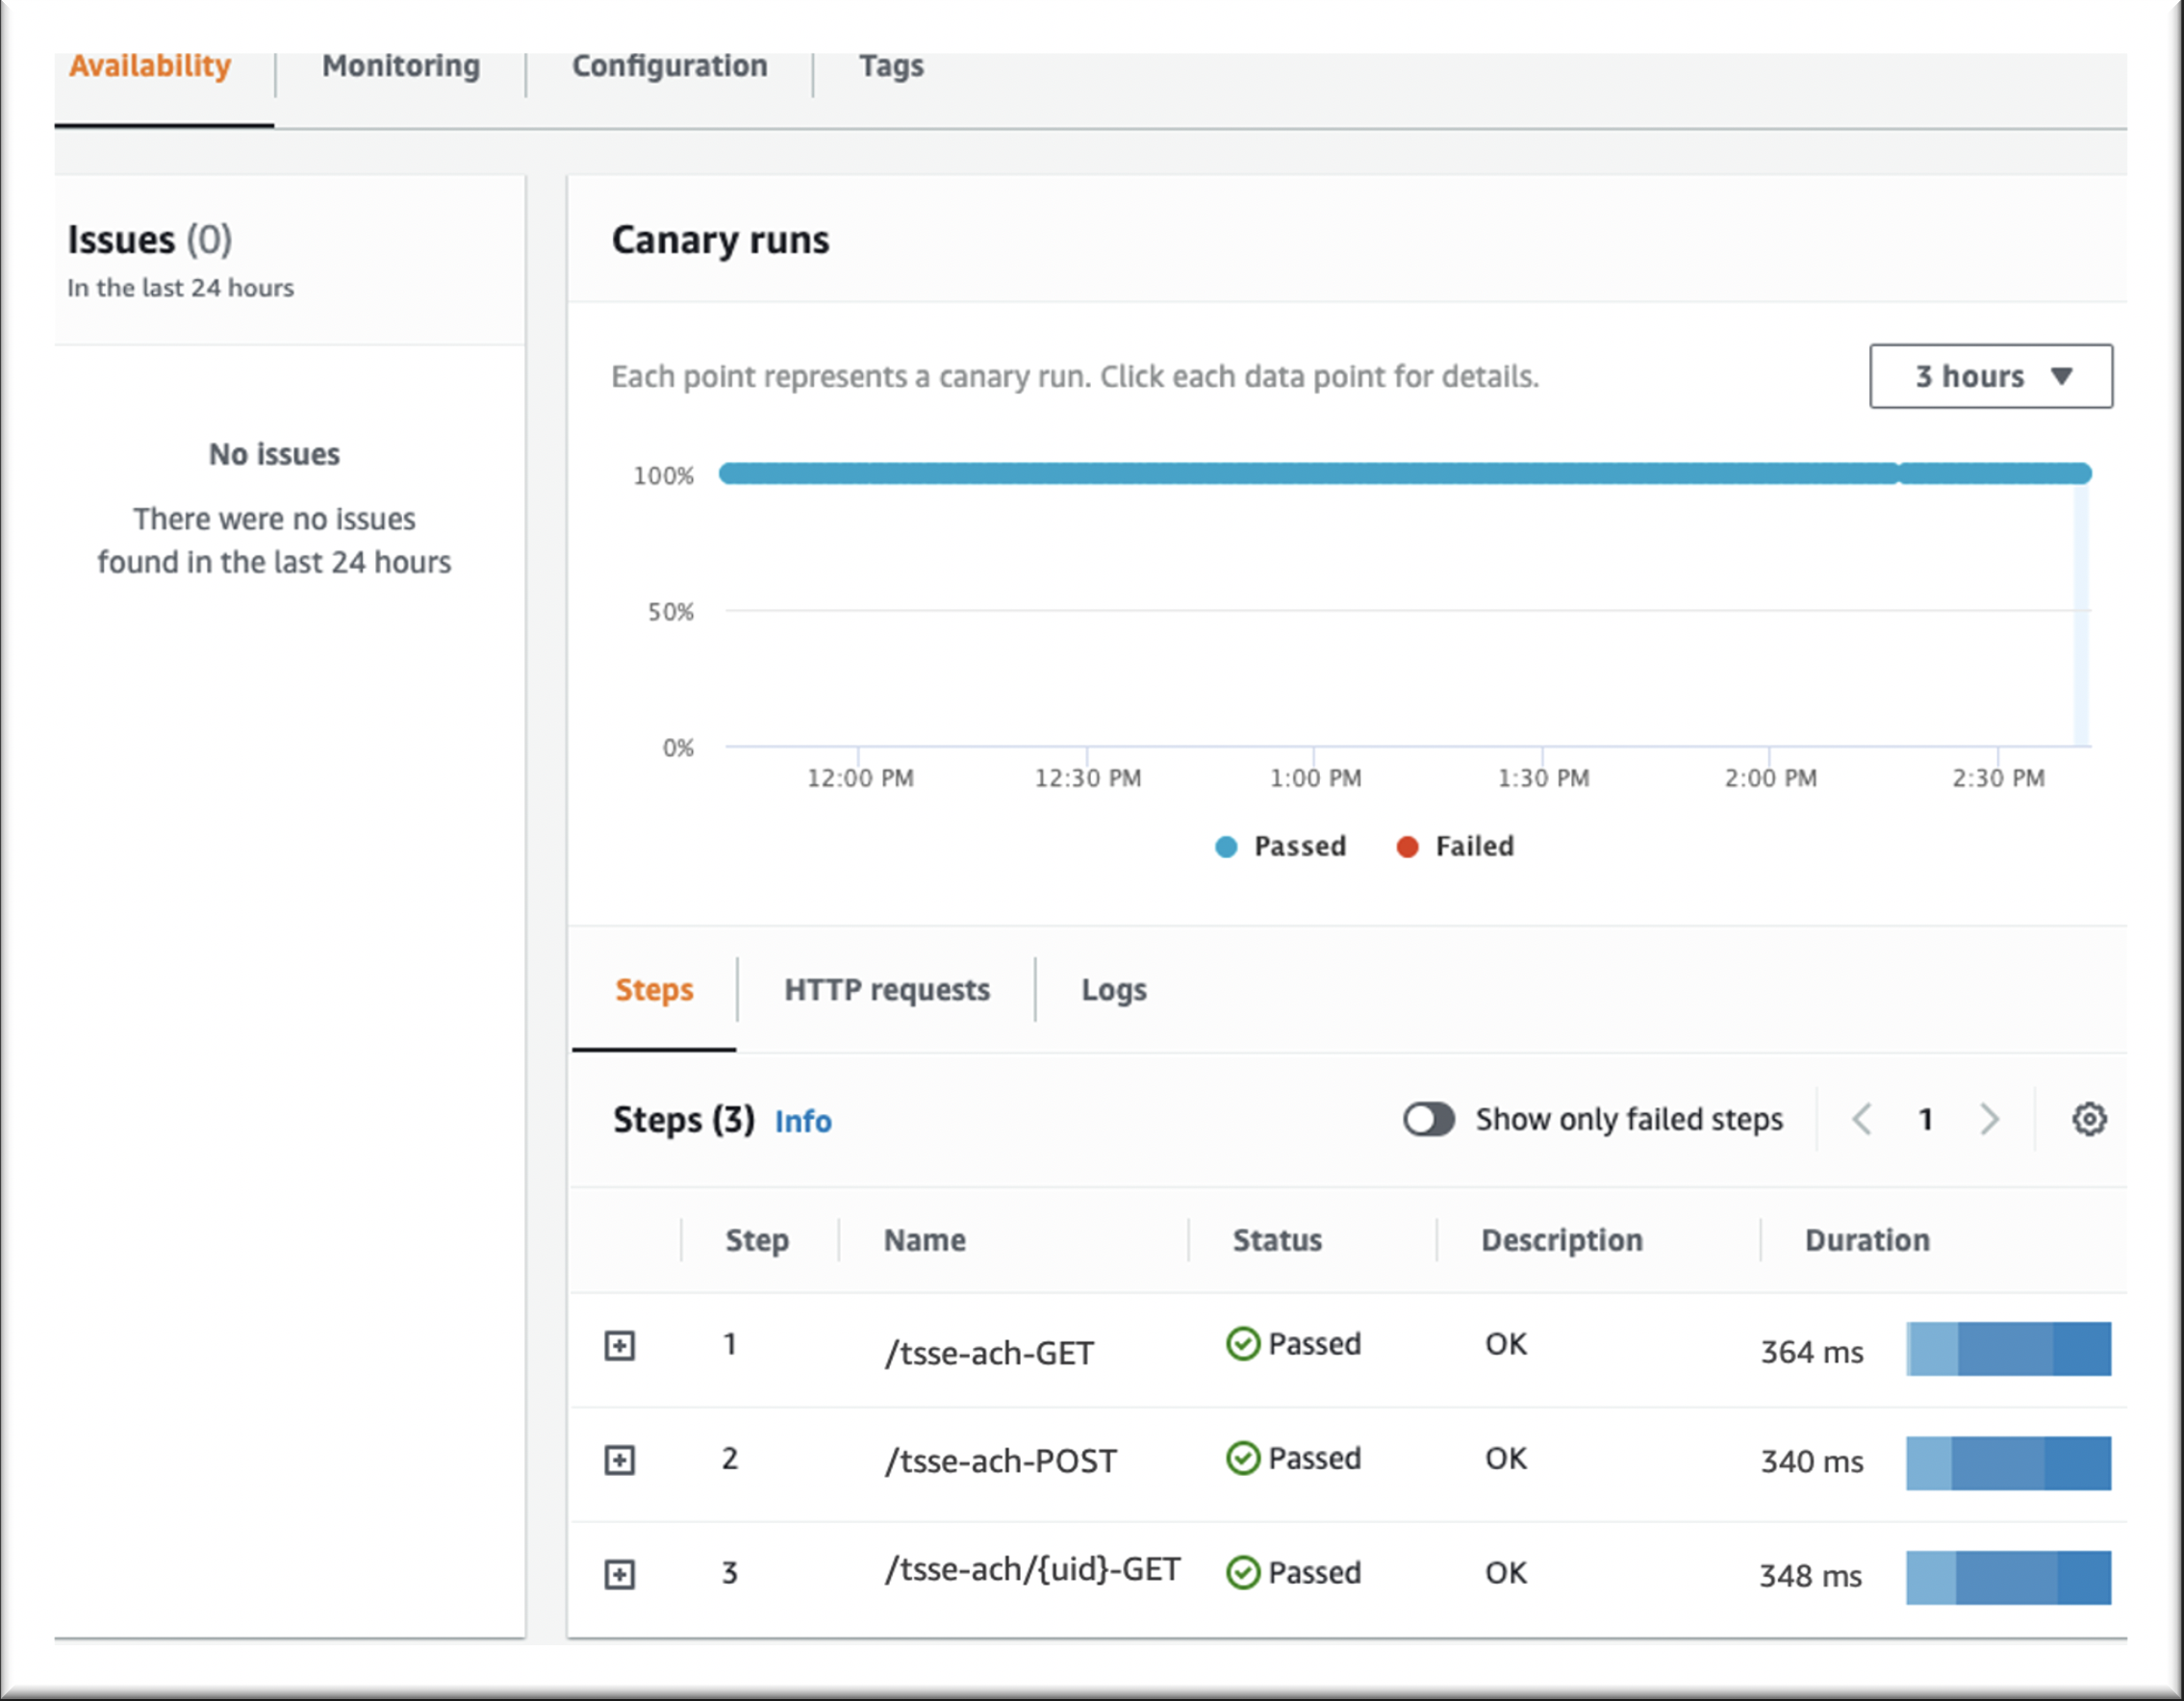
On the Canaries page, choose Create canary. When the canary is created, it will be displayed in the Canaries list, as shown in Figure 1. For information about utilizing the API canary blueprint, see API canary in the Amazon CloudWatch User Guide.
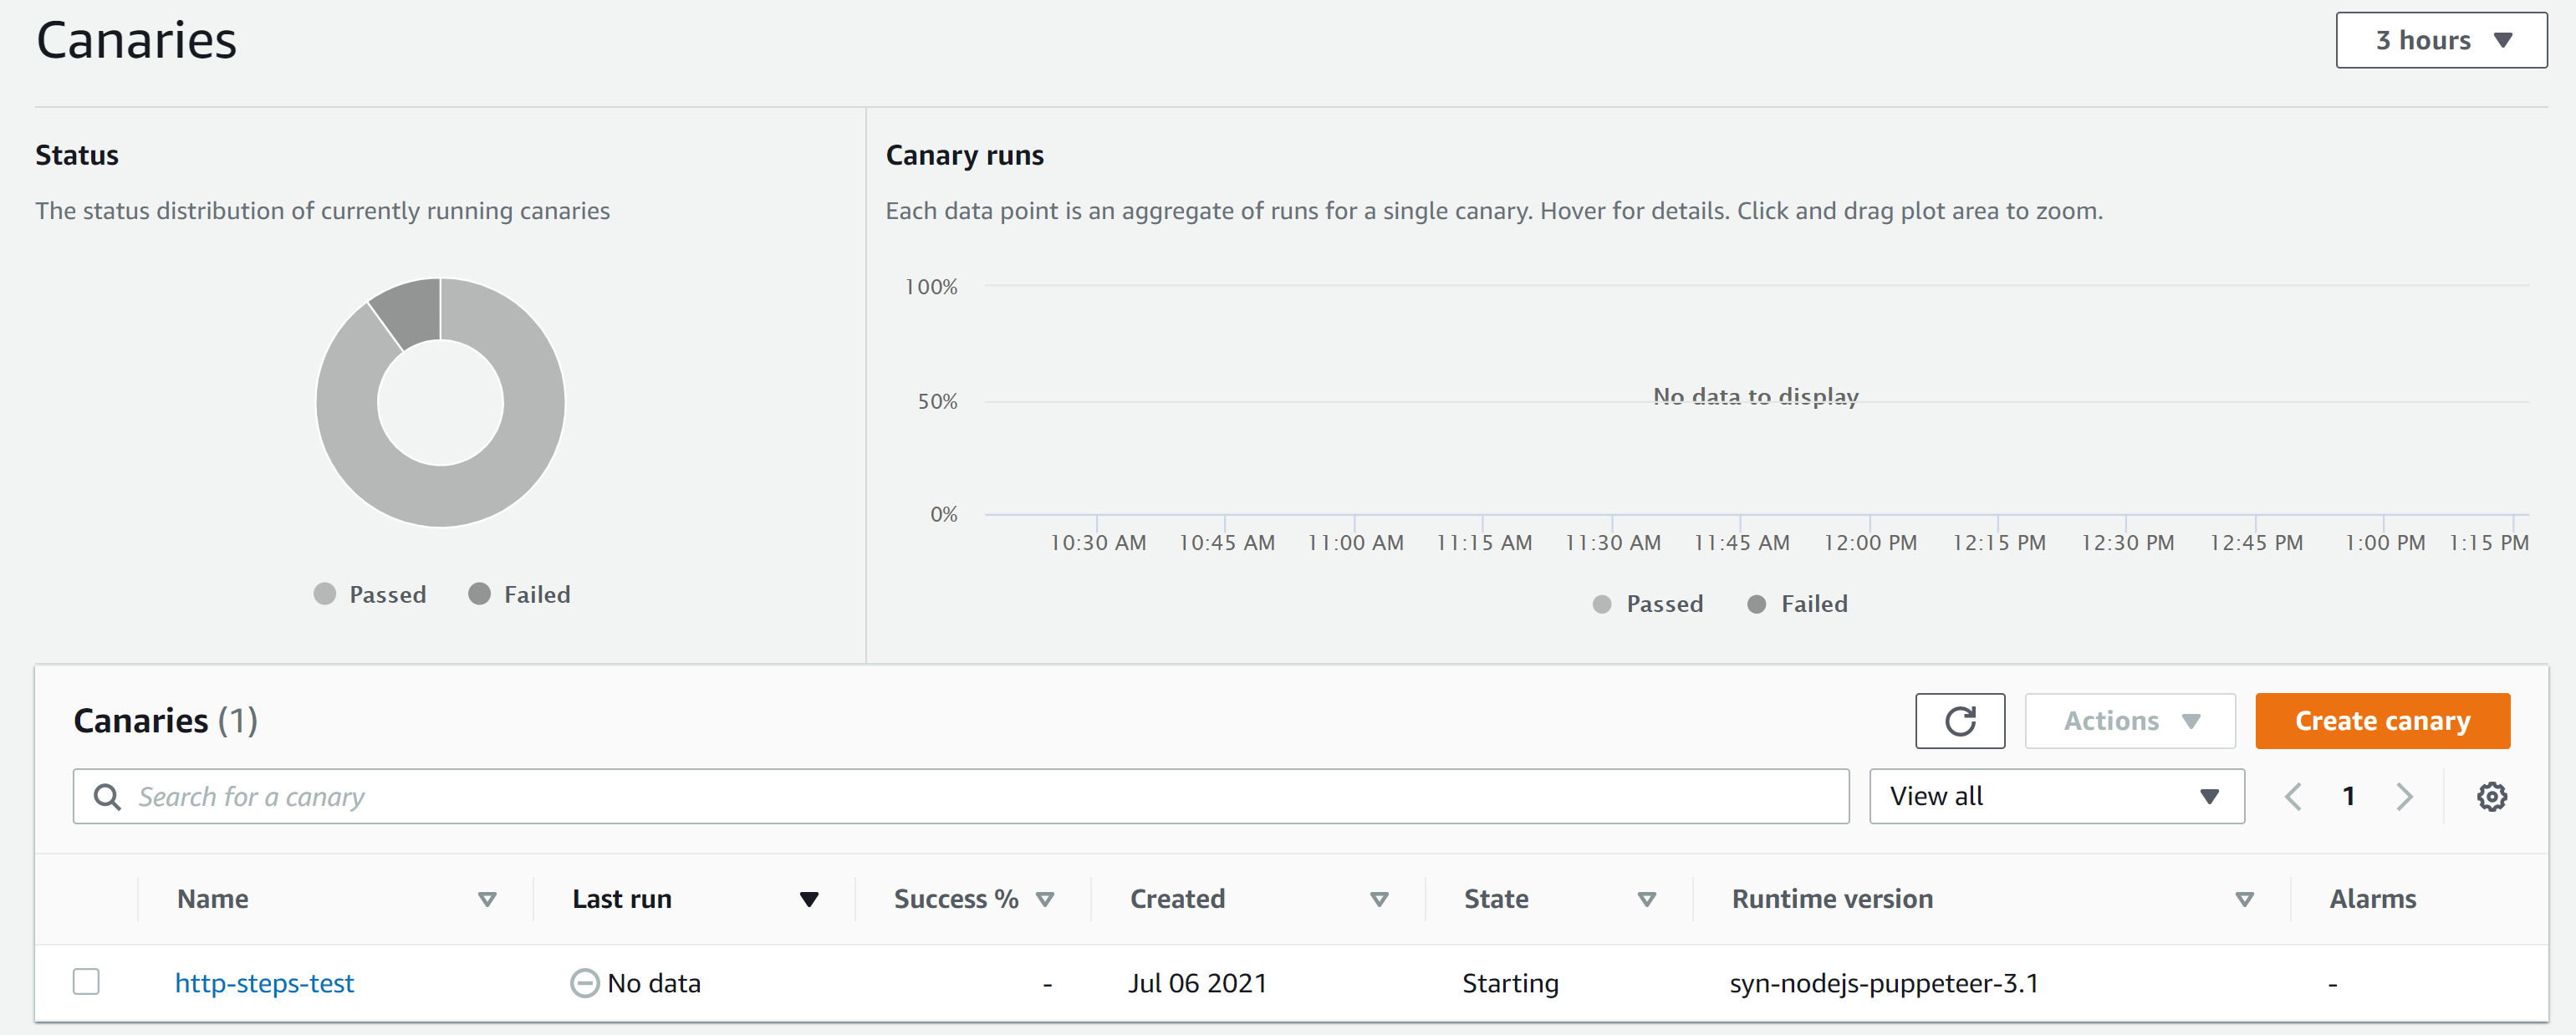
Figure 1: Canaries page of the CloudWatch console
Checking reports
The canary reports show every step and result of the calls. In this case, the canary returned the 400 Bad Request error as shown in Figure 1. This error is expected, as the endpoint requires a certificate in order to return a valid response.
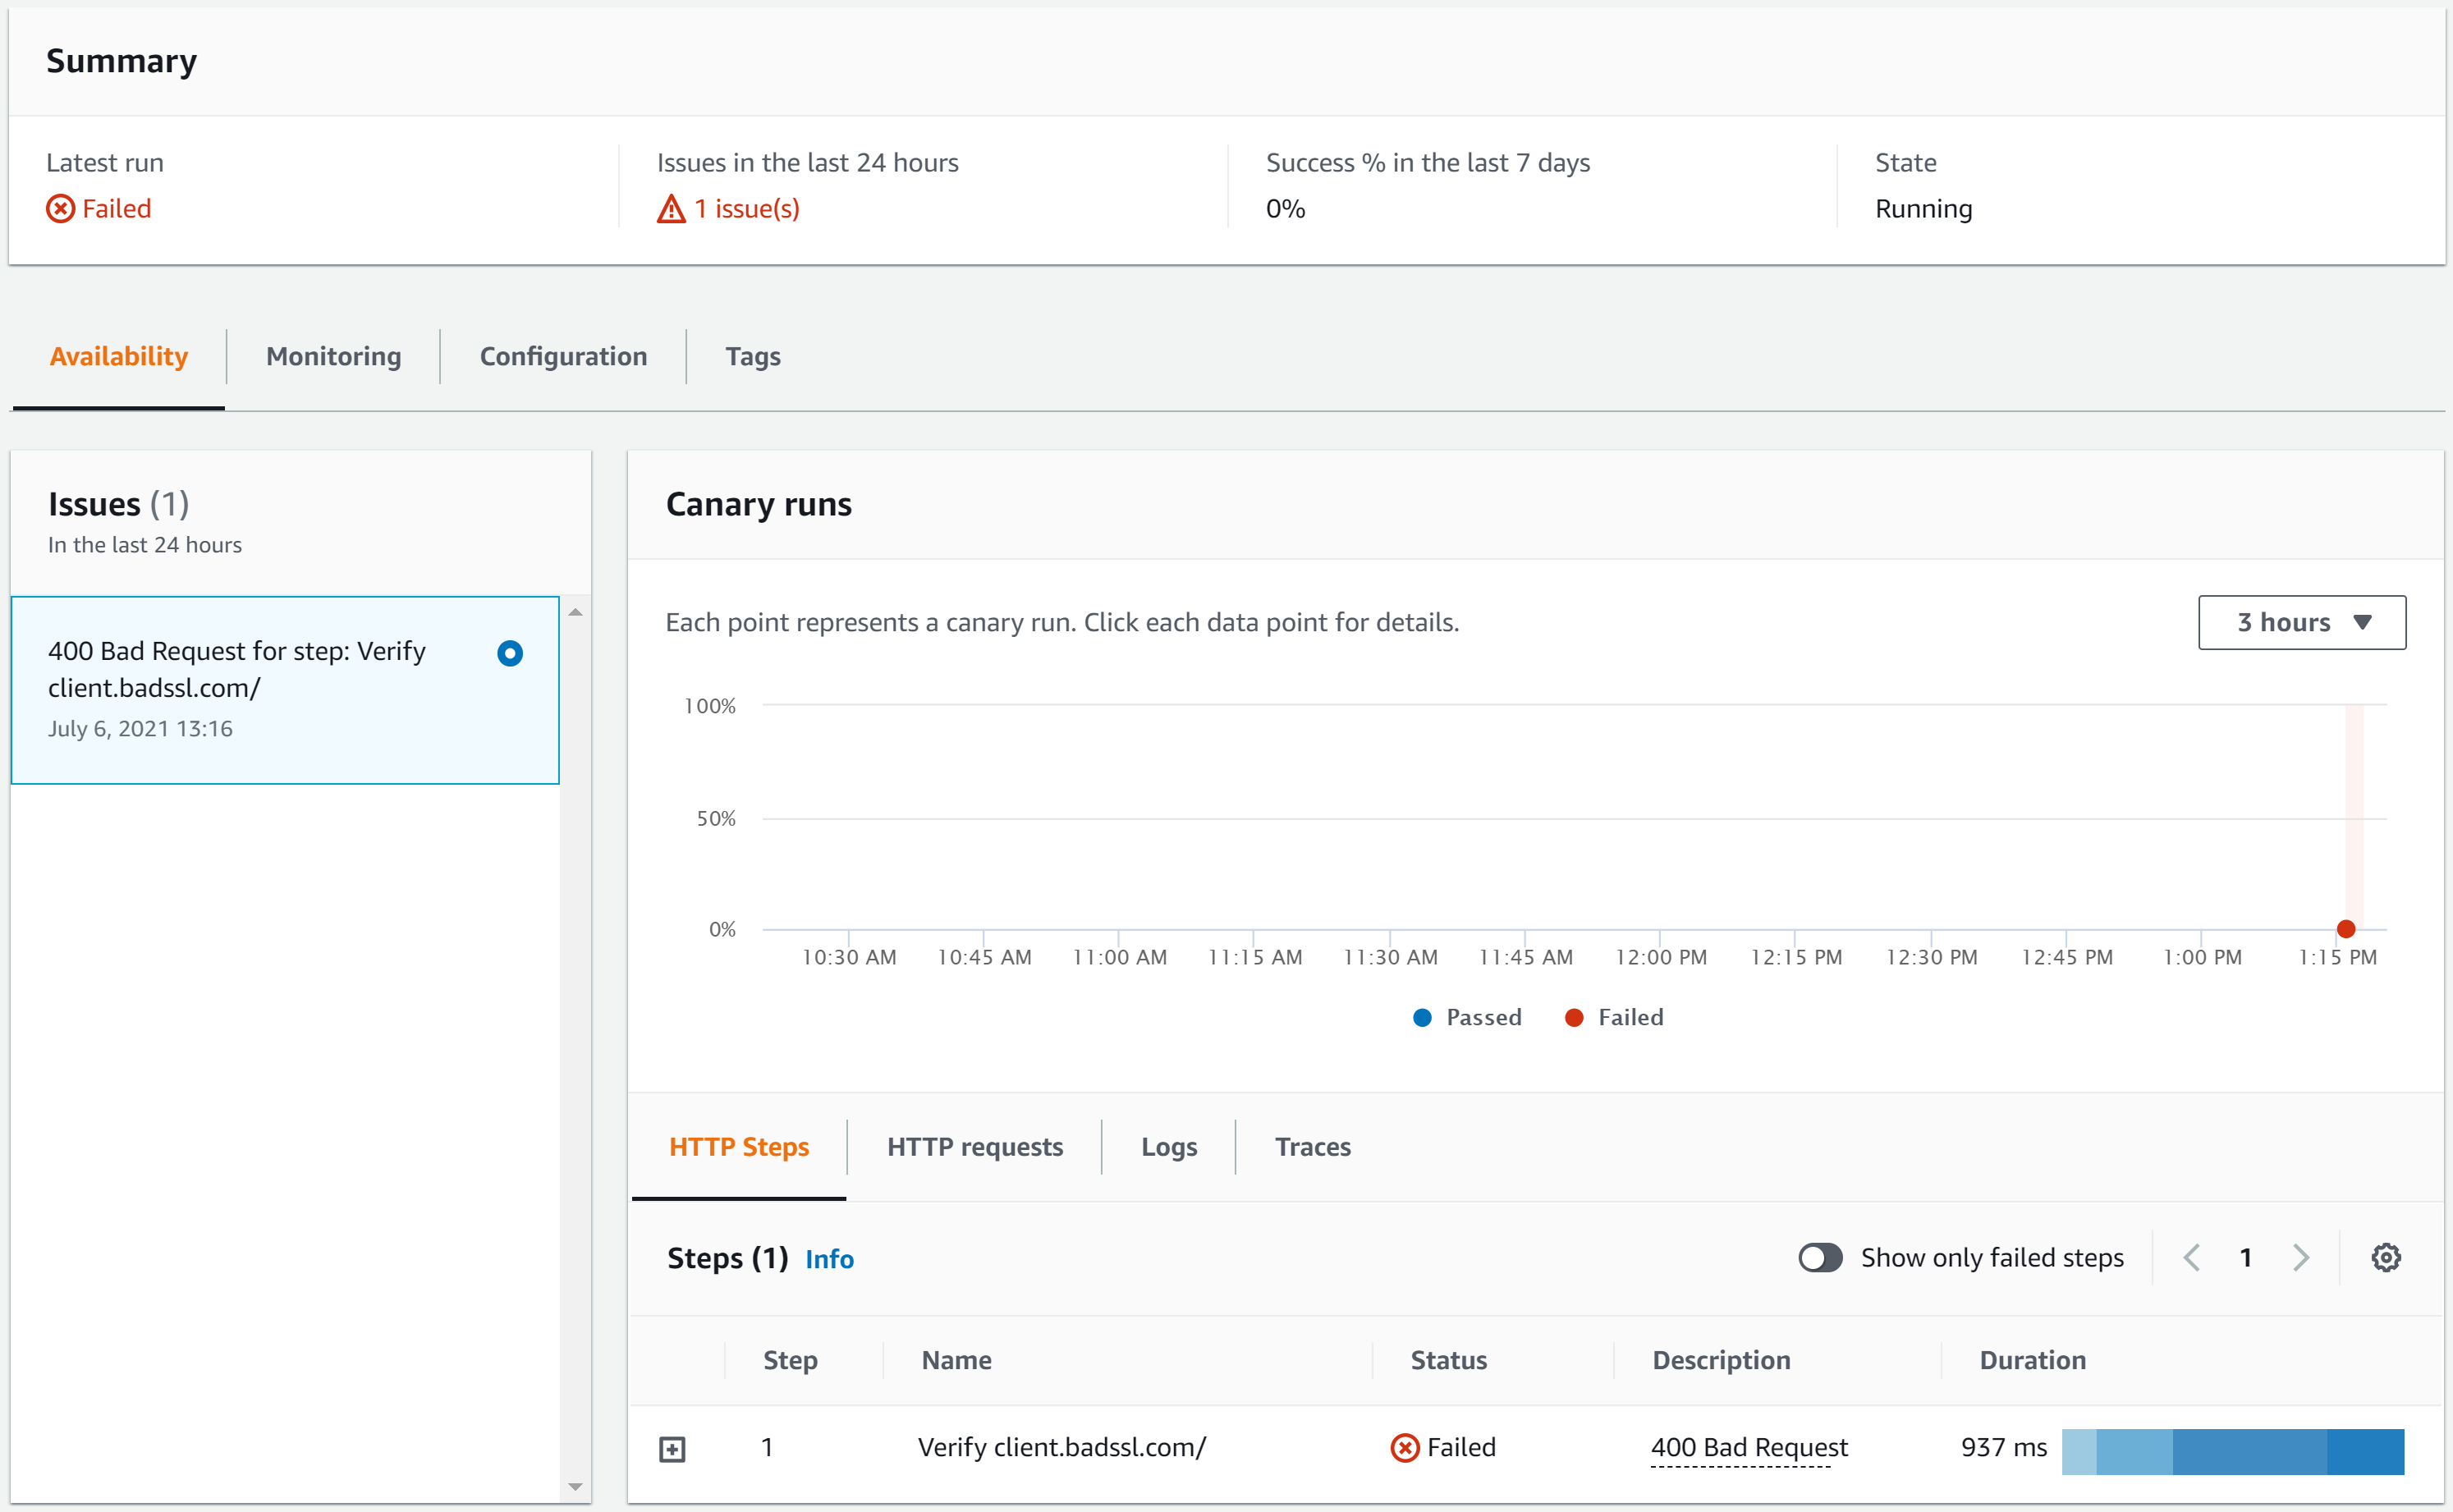
Figure 2: http-steps-test report
Adding the certificate
To solve the 400 Bad Request issue, the client key and certificate must be safely stored using AWS Secrets Manager. This will be utilized by the canary to authenticate the API request that calls the client.badssl.com. These certificates can be downloaded here and manually uploaded by using the AWS Management Console. However, it can also be done programmatically, as provided in the steps below.
Importing the key and certificate from badssl.com
I use AWS CloudShell, a browser-based shell that makes it easy to securely manage, explore, and interact with your AWS resources. We recommend CloudShell to run the scripts below. However, you can use your own command line for the same output.
CloudShell isn’t available in every region, but the environment variable AWS_REGION lets the commands be executed in the region where you are creating your canary. See Supported AWS Regions for AWS CloudShell for more information about the regions supported by the CloudShell.
The script below downloads the .pem file from badssl.com, creates a secret for the key and cert generated out of the .pem file, adds environment variables, and then lets the IAM role for the canary read the secret. Ensure the user is running the script has permissions to create a secret, get and update a canary, and attach policies to the canary role.
To deploy the script, follow these steps:
- Open the CloudShell console.
- Wait for the environment to be created.
- Copy and paste the script below – ensure that you adjust the AWS_REGION if needed.
# Variables
# Set the aws region, name of the canary and the name of the secrets
export AWS_REGION=us-east-2 //ATTENTION - change to region where your canary was create
export SYN_NAME="http-steps-test"
export SECRETBADSSLKEYNAME=badsslkey
export SECRETBADSSLCERTNAME=badsslcert
export THRESOLDCERTDAYEXP=5
# Updating the AWS CLI v2
curl "https://awscli.amazonaws.com/awscli-exe-linux-x86_64.zip" -o "awscliv2.zip"
unzip awscliv2.zip
sudo ./aws/install --bin-dir /usr/local/bin --install-dir /usr/local/aws-cli --update
# Install openssl if you don't have that installed
# Ubuntu users -> sudo apt-get install openssl
sudo yum install openssl -y
# Download the client.badssl.com certificate
mkdir badsslcert
cd badsslcert
wget https://badssl.com/certs/badssl.com-client.pem
# Export the key and cert from the .pem file
# Based on the badssl.com, the key is encrypted using the pass badssl.com
# The password is in plain text for the purposes of this lab; however, it is not recommended
# You can use a secret manager or any other service that would encrypt the password in real-life scenarios, so avoiding clear text passwords.
openssl rsa -in badssl.com-client.pem -out badssl.com-client.key -passin pass:badssl.com
openssl x509 -in badssl.com-client.pem -trustout -out badssl.com-client.cert
# Create a secret for the key and cert generate above
badsslkeyarn=$(aws secretsmanager create-secret --name $SECRETBADSSLKEYNAME --secret-string file://badssl.com-client.key --output text --query ARN)
badsslcertarn=$(aws secretsmanager create-secret --name $SECRETBADSSLCERTNAME --secret-string file://badssl.com-client.cert --output text --query ARN)
# Get the role name used by the canary
synrole=$(aws synthetics get-canary --name $SYN_NAME --query Canary.ExecutionRoleArn --output text)
synrole=$(echo $synrole | cut -d "/" -f3)
# Create a policy to allow the canary role to access the secrets
# The policy use the least privilege concep, allowing only the key and cert secrets
echo "{
\""Version\"": \""2012-10-17\"",
\""Statement\"": [
{
\""Effect\"": \""Allow\"",
\""Action\"": \""secretsmanager:GetSecretValue\"",
\""Resource\"": [
\""$badsslkeyarn\"",
\""$badsslcertarn\""
]
}
]
}" >> inline-policy.json
# Add an inline policy to the canary role, allowing the script to read the key and cert
aws iam put-role-policy --role-name $synrole --policy-name "allow-get-secrets-certs" --policy-document file://inline-policy.json
# Load the fingerprint of the certificate issued to httpbin.org
badsslsha256=$(openssl s_client -connect client.badssl.com:443 < /dev/null 2>/dev/null | openssl x509 -fingerprint -sha256 -noout -in /dev/stdin)
badsslsha256=$(echo $badsslsha256 | cut -d "=" -f2)
# Updating the Canary Environment Variables
# The update-canary call can also be done via console while editing the script
# CERTSHA256 - used to check if the certificate is correct
# BADSSLKEY & BADSSLCERT - key and cert used to connect to the client.badssl.org
# THRESOLDCERTDAYEXP - thresold to flag the certificate as close to expire
aws synthetics update-canary --name $SYN_NAME --run-config 'EnvironmentVariables={BADSSLKEY='$SECRETBADSSLKEYNAME',BADSSLCERT='$SECRETBADSSLCERTNAME',CERTSHA256='$badsslsha256',THRESOLDCERTDAYEXP='$THRESOLDCERTDAYEXP'}'
# Delete the badsslfolder
cd ..
rm -r badsslcert/
echo "Script finished"
- Choose Paste, and wait for the script to finish.
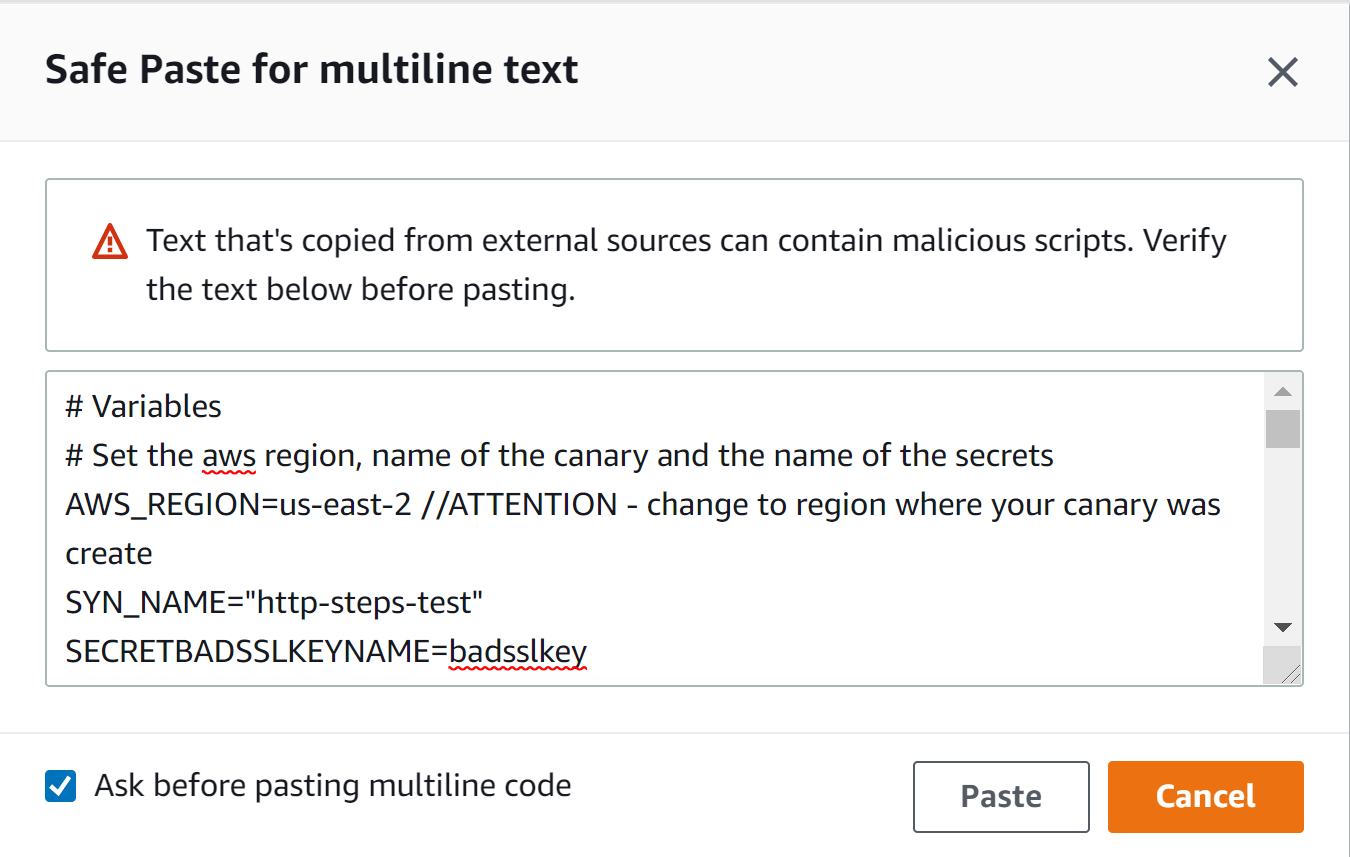
Figure 3: CloudShell popup to paste multiline text
Updating the script to collect key and certificate from Secrets Manager
The blueprint provided by the CloudWatch Synthetics must be updated in order to load the secrets from Secrets Manager and then connect using the client.badssl.com key and certificate.
To edit the code, follow these steps:
- Open the Synthetics menu of the CloudWatch console.
- Choose the canary created above – for example, http-steps-test.
- Choose Actions.
- Choose Edit.
- Using the Script Editor box, paste thecode snippet below at the beginning of the script.
In short, this snippet loads the Secrets Manager client and defines the getKeyCert() in order to collect the secrets.
// Load the AWS SDK and the Secrets Manager client.
const AWS = require('aws-sdk');
const secretsManager = new AWS.SecretsManager();
// Connect to the Secrets Manager the load the Key and Cert
// These are the secrets created previously
// The code is dynamic and load the secrets name via environment vars
const getKeyCert = async () => {
var params = {
SecretId: process.env.BADSSLKEY
};
const key = await secretsManager.getSecretValue(params).promise();
var params = {
SecretId: process.env.BADSSLCERT
};
const cert = await secretsManager.getSecretValue(params).promise();
// returning Key and Cert
return [ key.SecretString, cert.SecretString ]
}
To collect the secrets, call the function getKeyCert() inside of the canary function apiCanaryBlueprint().
...
const apiCanaryBlueprint = async function () {
// Add the line below to load the key and cert from the function getKeyCert()
const [ key, cert ] = await getKeyCert();
...
Lastly, the key and cert must be added to the requestOptions of the client.badssl.com request.
...
// Set request option for Verify client.badssl.com
let requestOptionsStep1 = {
hostname: 'client.badssl.com',
method: 'GET',
path: '',
port: '443',
protocol: 'https:',
body: "",
headers: {}, //don't forget to add the comma
key: key, //client.badssl.com key from Secrets Manager
cert: cert //client.badssl.com cert from Secrets Manager
};
...
After modifying the code, save and wait for the canary to run again. Next, canary run should be PASSED with the steps tab showing the request status as PASSED.
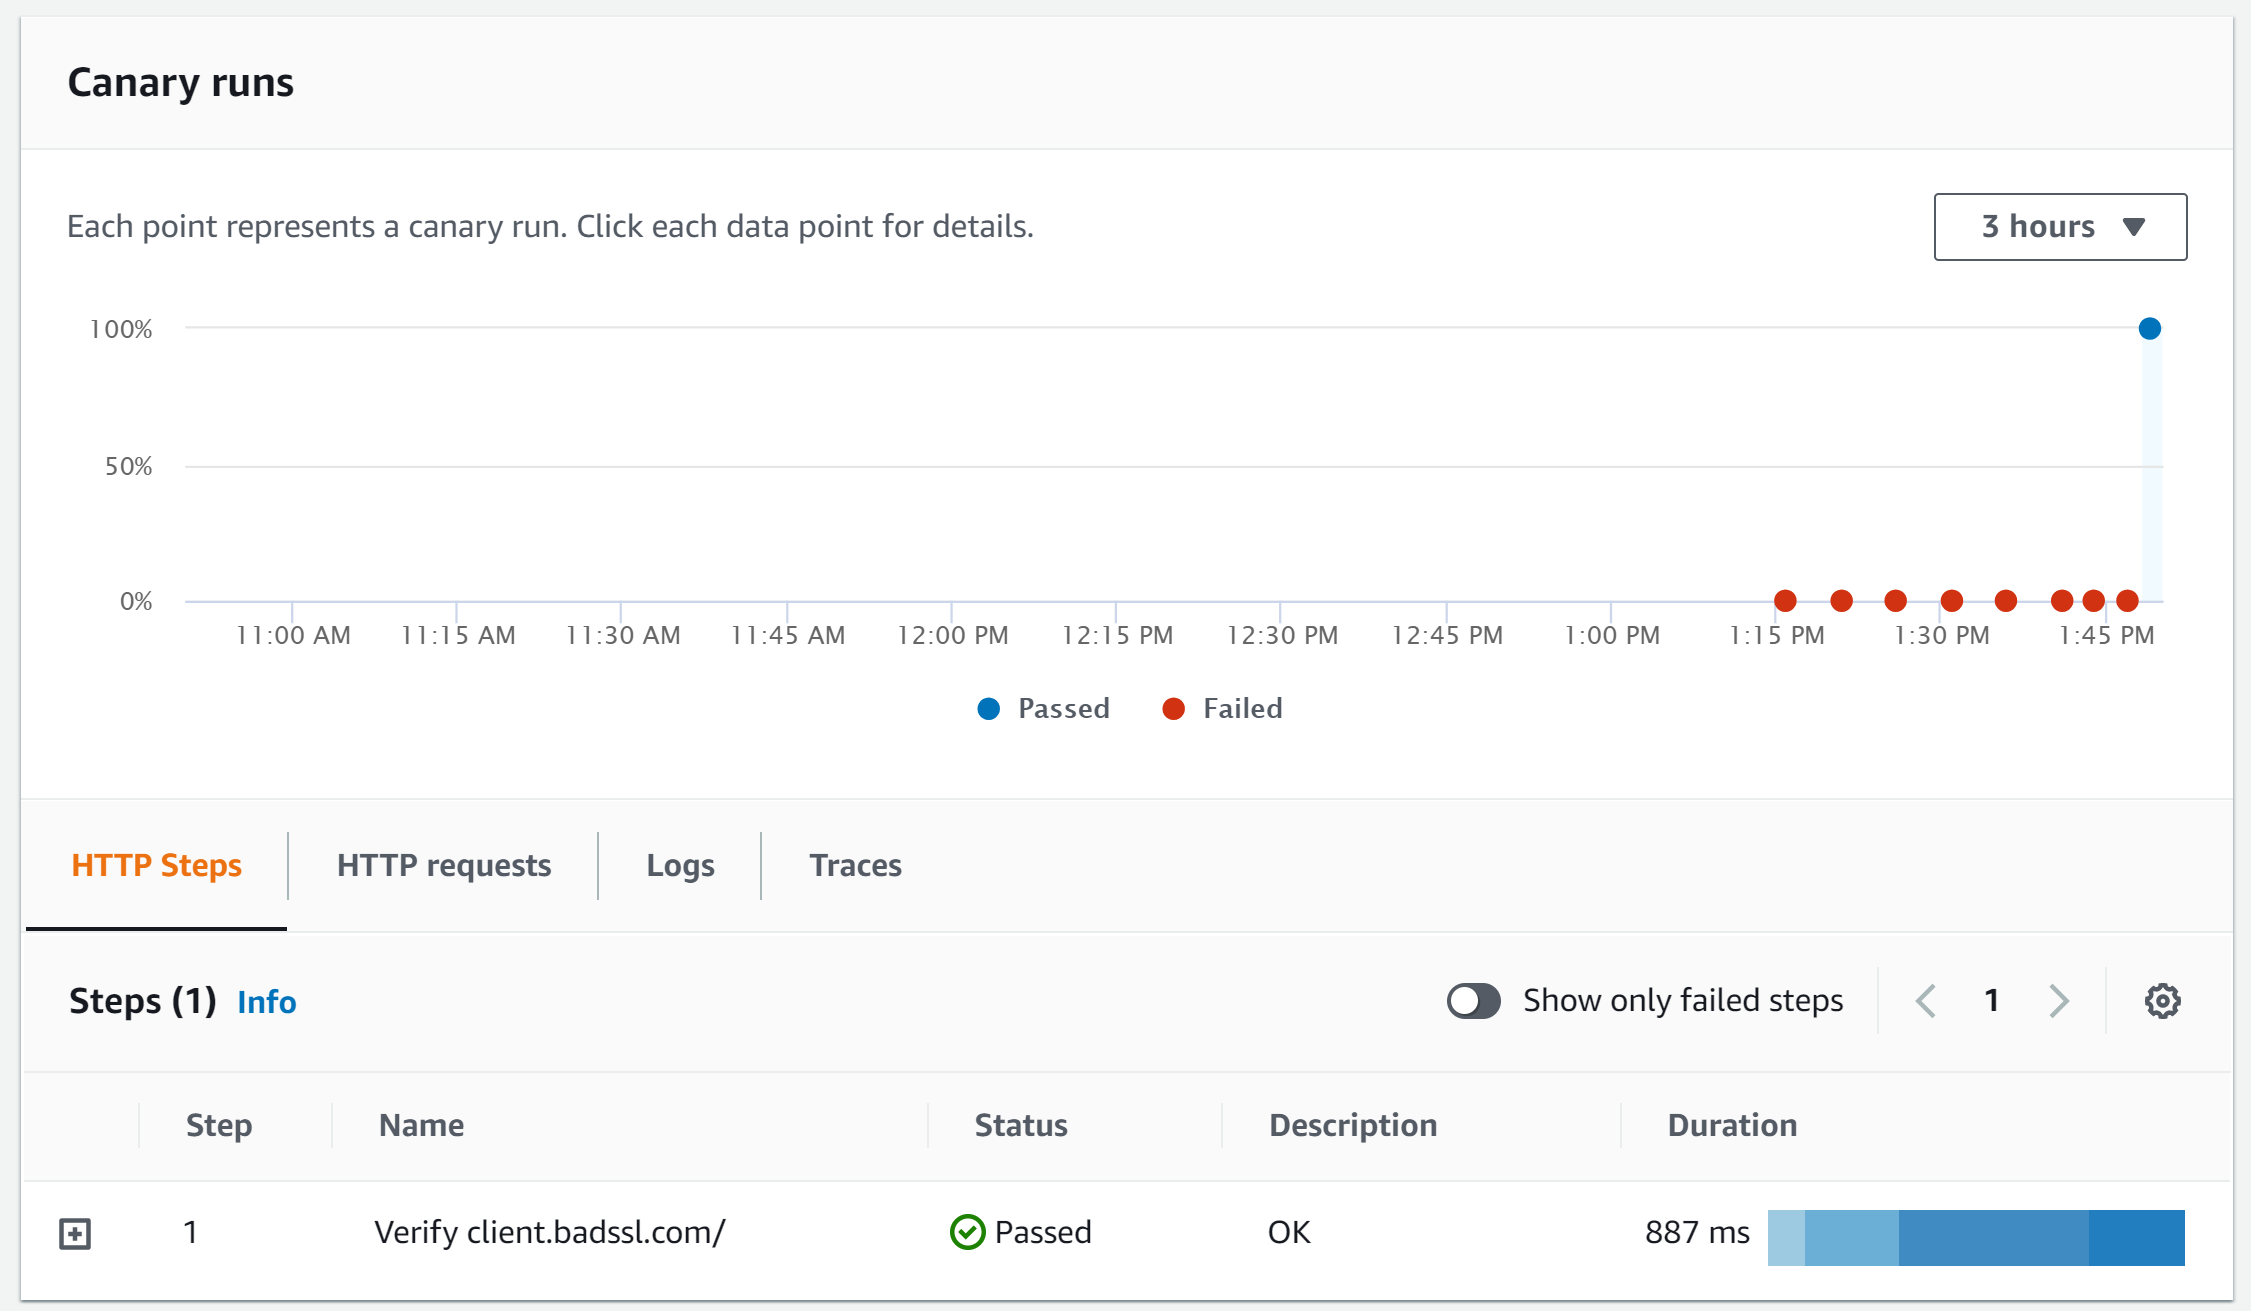
Figure 4: http-steps-test report showing the status as Passed
Additional Reading
NodeJS library options can be extended to check the server identity. Moreover, the function can also be utilized to check if the certificate is about to expire or check any other validation to the endpoint certificate properties.
The code below shows how to check if the certificate is issued to the host that the script is connecting. It also checks if the certificate is not close to its expiry date.
To edit the code, follow these steps:
- Open the Synthetics menu of the CloudWatch console.
- Choose the canary created above – for example, http-steps-test.
- Choose Actions.
- Choose Edit.
- Using the Script Editor box, paste the code snippet below at the beginning of the script.
...
const tls = require('tls');
...
Add the highlighted checkServerIdentity to the requestOptionStep1 variable.
...
// Set request option for Verify httpbin.org/status/500
let requestOptionsStep1 = {
hostname: 'client.badssl.com',
method: 'GET',
path: '/',
port: '443',
protocol: 'https:',
body: "",
headers: {},
key: key,
cert: cert,
checkServerIdentity: function(host, cert) {
// Make sure the certificate is issued to the host we are connected to
const err = tls.checkServerIdentity(host, cert);
if (err) {
throw msg;
}
// Calculate how many days left to expire the certificate
const validTo = new Date(cert.valid_to);
const now = new Date();
const utc1 = Date.UTC(now.getFullYear(), now.getMonth(), now.getDate());
const utc2 = Date.UTC(validTo.getFullYear(), validTo.getMonth(), validTo.getDate());
const _MS_PER_DAY = 1000 * 60 * 60 * 24;
const diffDays = Math.floor((utc2 - utc1) / _MS_PER_DAY);
// You can also emit a CloudWatch metric with the time remaining and set and alarm on the metric.
if (diffDays <= process.env.THRESOLDCERTDAYEXP){
throw `The certificate ${cert.subject.CN} is about to expire - threshold ${process.env.THRESOLDCERTDAYEXP} days.`;
}
// Pin the exact certificate, rather than the pub key
if (cert.fingerprint256 !== process.env.CERTSHA256) {
const msg = 'Error: ' +
`Certificate of '${cert.subject.CN}' with the fingerprint '${cert.fingerprint256}' ` +
`does not correspond to the fingerprint provided '${process.env.CERTSHA256}'`;
throw msg;
}
else {
const msg = 'OK: ' +
`Certificate of '${cert.subject.CN}' with the fingerprint '${cert.fingerprint256}' ` +
`correspond to the fingerprint provided '${process.env.CERTSHA256}'`;
log.info(msg);
}
}
...
Save the canary and check the report after running the script.
The script utilizes the environment variables created earlier to check that the certificate was issued to the correct hostname, the expiry date is not close, and sb56, which throws an exception if any of these checks fail. See TLS (SSL) documentation for more information about how the TLS library works.
Cleanup
After finishing this lab, I recommend removing the canary and the resources created by the canary in order to avoid unnecessary charges. The following script deletes the CloudWatch Synthetic script, the secrets manager, lambda, and IAM role. These steps can also be conducted via console. For future reference, read the page Editing or deleting a canary in order to learn how to delete a canary.
# Variables
# Set the aws region, name of the canary and the name of the secrets
export AWS_REGION=us-east-2 //ATTENTION - change to region where your canary was created
export SYN_NAME="http-steps-test"
export SECRETBADSSLKEYNAME=badsslkey
export SECRETBADSSLCERTNAME=badsslcert
# Collect details about the canary before deleting
synCode=$(aws synthetics get-canary --name $SYN_NAME --output text --query Canary.Code.SourceLocationArn | cut -d ":" -f7)
synRole=$(aws synthetics get-canary --name $SYN_NAME --output text --query Canary.ExecutionRoleArn | cut -d "/" -f3)
synS3=$(aws synthetics get-canary --name $SYN_NAME --output text --query Canary.ArtifactS3Location)
# Stop and delete the canary
# Added a sleep to wait for the API to complete the deletion
aws synthetics stop-canary --name $SYN_NAME
sleep 30
aws synthetics delete-canary --name $SYN_NAME
# Delete the secret
aws secretsmanager delete-secret --secret-id $SECRETBADSSLKEYNAME --recovery-window-in-days 7
aws secretsmanager delete-secret --secret-id $SECRETBADSSLCERTNAME --recovery-window-in-days 7
# Delete the lambda and layers
aws lambda delete-function --function-name $synCode
for layerVersion in $(aws lambda list-layer-versions --layer-name $synCode --query 'LayerVersions[*].Version' --output text) ;do aws lambda delete-layer-version --layer-name $synCode --version-number $layerVersion ;done
# Delete the policies and role
for policyName in $(aws iam list-attached-role-policies --role-name $synRole --query AttachedPolicies[*].PolicyArn --output text) ;do aws iam detach-role-policy --role-name $synRole --policy-arn $policyName ;done
for policyName in $(aws iam list-role-policies --role-name $synRole --output text --query PolicyNames[*]) ;do aws iam delete-role-policy --role-name $synRole --policy-name $policyName ;done
aws iam delete-role --role-name $synRole
# To avoid mistakes, the S3 bucket won't be deleted via code, but you can do it manually
# It is because you may have used a pre-existing bucket that may contain files that cannot be deleted
echo "S3 bucket $synS3"
Conclusion
This post walked you through an example of how to monitor an endpoint requiring a client certificate authentication by using the tool badssl.com.
To learn more about how to use this feature and all other capabilities, read the CloudWatch Synthetics documentation. Also, the AWS Command Line Interface (CLI) documentation for Synthetics can be found here.
Share your Amazon CloudWatch Dashboards with anyone using AWS Single Sign-On
=======================
Amazon CloudWatch enables customers to collect monitoring and operational data in the form of logs, metrics, alarms, and events, thereby allowing easy workload visualization and notifications. Traditionally, operational health data access was only viewable for technical support staff, thereby making operational health opaque to a wider business audience. However, actionable and valuable business insights can be gained by expanding CloudWatch data access to other people who are not deeply knowledgeable about the technical details of their cloud or on-premises environments.
Meaningful business metrics examples include the rate of purchases made on an e-commerce application, overall web applications response times, or alerts showing impacts to overall datacenter infrastructure. CloudWatch is a multi-purpose timeseries, log, event, and alarm-management system that can be easily utilized to power observability into business KPIS. Now, exposing this data to stakeholders is easier than ever before.
To help manage this information access, Amazon CloudWatch has introduced CloudWatch dashboard sharing. This allows customers to easily and securely share their CloudWatch dashboards with people outside of their organization, in another business unit, or with those with no access AWS console access. This blog will demonstrate how a dashboard can be shared across the enterprise via a SAML provider in order to broker this secure access.
For this example, we will provide an overview of how to integrate Amazon CloudWatch with AWS Single Sign-On (AWS SSO), as well as the components required. This blog will not focus on setting up AWS Single Sign-On, and it requires that you have a working implementation of AWS Single Sign-On or another configured SAML provider. We have guidance for how to set up and operate AWS SSO here.
Solution Overview
The solution will rely on AWS Single Sign-On as the entry point for users to gain access to CloudWatch dashboards. AWS Single Sign-On will act as a SAML provider that will federate with an Amazon Cognito user pool granting users read-only access to CloudWatch dashboards. While we are leveraging AWS SSO today, you can utilize other identity providers of your choosing, and you do not need to include AWS SSO in your environment. AWS SSO controls who has access to the dashboard by assigning groups to the CloudWatch dashboard applications that you publish.
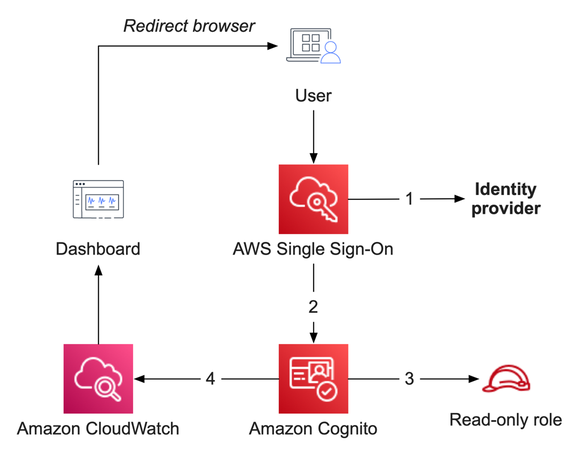
Figure 1: Solution overview, showing the flow between AWS SSO, Amazon Cognito, and Amazon CloudWatch
Prerequisites
This blog assumes that you have fulfilled these prerequisites:
- AWS SSO is already configured to use an identity provider. We will utilize the email address of your users as a SAML attribute – your environment may differ slightly.
- A CloudWatch dashboard that you are prepared to share.
Services utilized in this solution
Amazon CloudWatch collects monitoring and operational data in the form of logs, metrics, and events, and then visualizes it via automated dashboards so that you receive a unified view of your AWS resources, applications, and services that run in AWS and on-premises.
AWS Single Sign-On (AWS SSO) is where you create, or connect, your workforce identities in AWS, as well as manage access centrally across your AWS organization. Choose to manage access just to your AWS accounts or cloud applications.
Amazon Cognito (Cognito) lets you quickly and easily add user sign-up, sign-in, and access control to your web and mobile apps. Amazon Cognito scales to millions of users and supports sign-in with social identity providers, such as Apple, Facebook, Google, and Amazon, as well as enterprise identity providers via SAML 2.0 and OpenID Connect.
Steps to enable dashboard sharing
Before proceeding, consider the following:
Enabling dashboard sharing will let all dashboards in this account and region be accessible by the SAML provider, and any user granted access to this application will have read-only access to all dashboards in that region.
CloudWatch is a regional service. So if you wish to share dashboards from multiple regions, you must repeat part of this procedure for each AWS region.
We are utilizing the default Identity and Access Management role created by CloudWatch. This does not allow default viewing of CloudWatch Logs data or composite alarms. If desired, these can be enabled later.
Implementation steps
- Open the AWS console and navigate to CloudWatch. From here, find Settings on the bottom-left. Click this to view the CloudWatch settings.
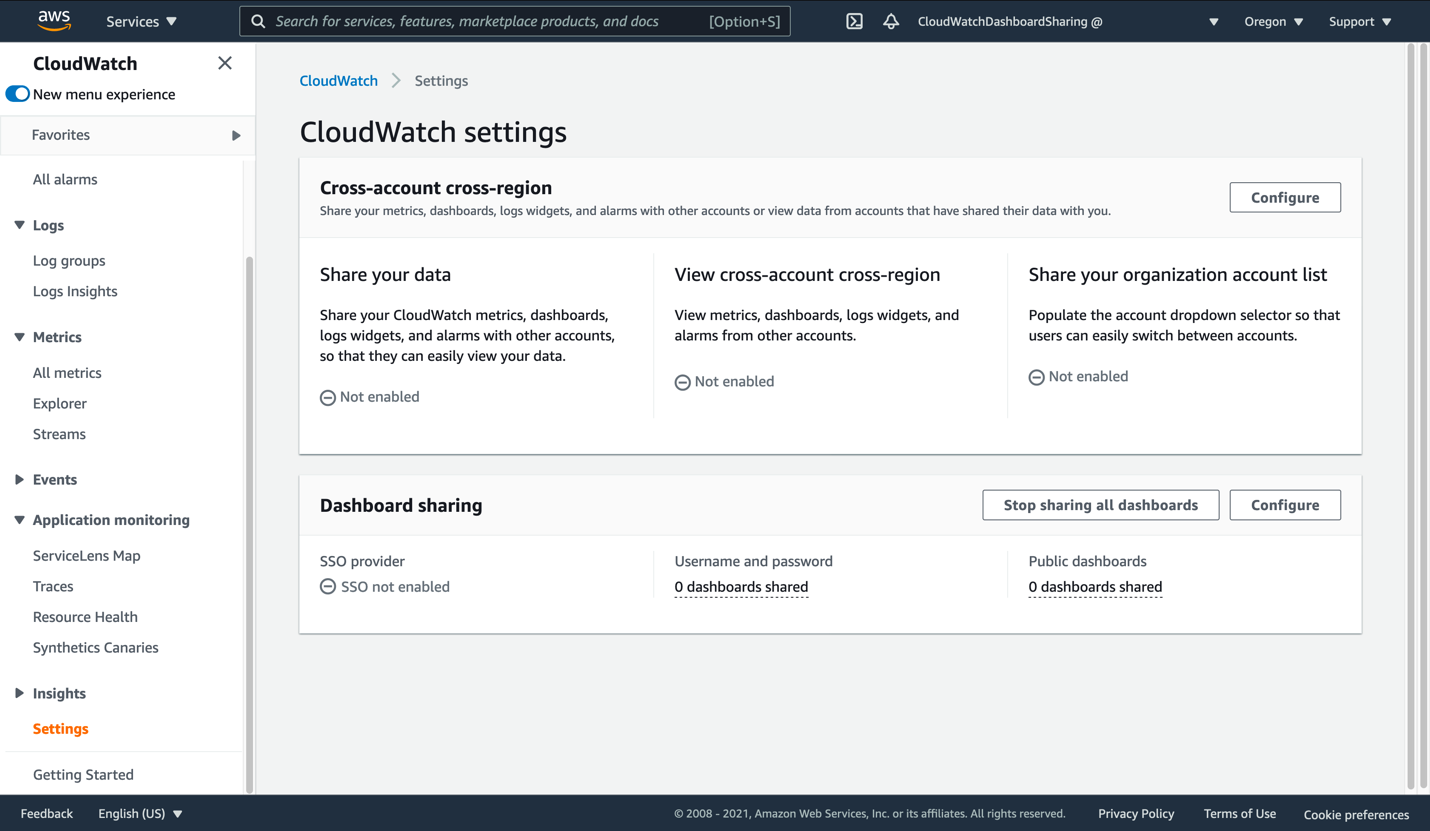
Figure 2: View of the CloudWatch settings page
- Click Configure in the Dashboard sharing section. This will take you to the SSO Provider dialog.
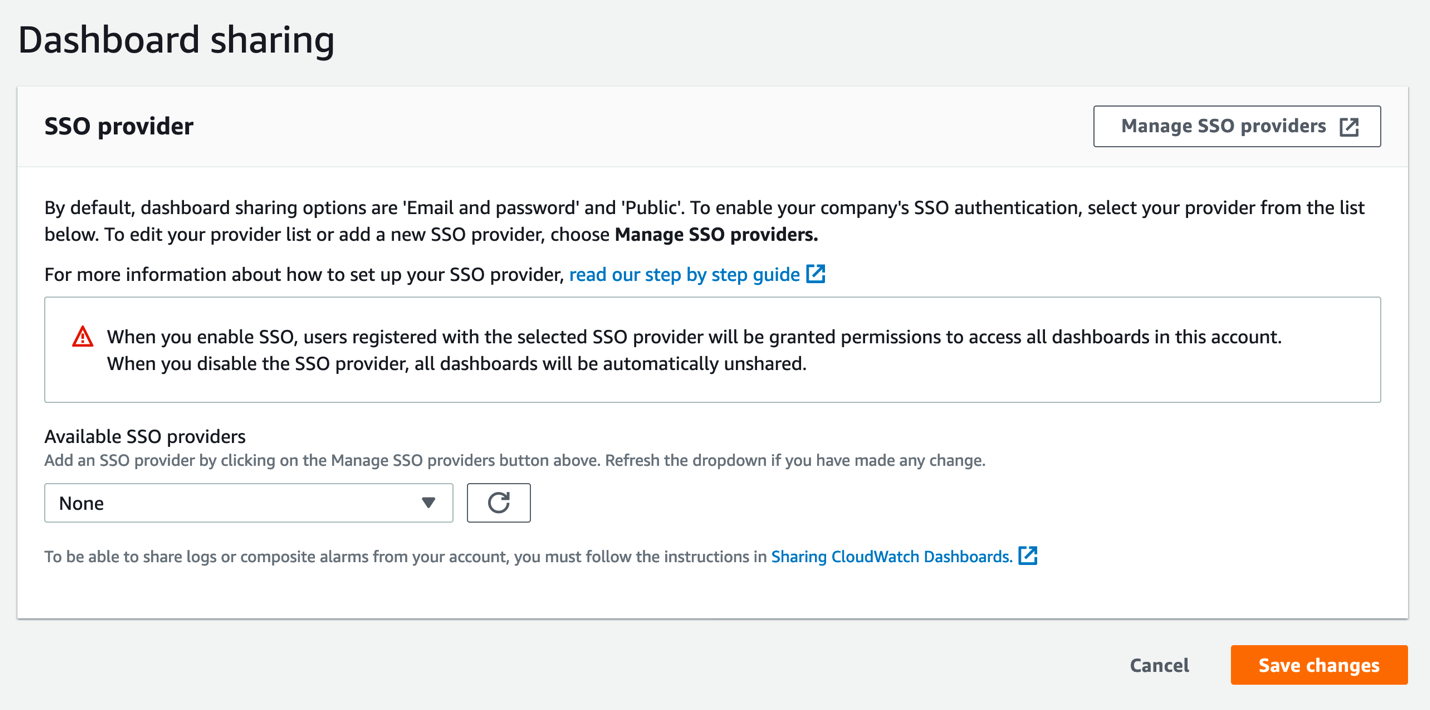
Figure 3: The CloudWatch SSO provider selection page
- Click Manage SSO providers to begin the next step. This opens the Cognito console in a new browser tab. Keep the CloudWatch console tab open, as you will be returning to it soon.
In the Cognito console, you should see a view similar to this:

Figure 4: First opening of the Cognito console
- The wizard has already created a Cognito user pool called CloudWatchDashboardSharing and partially configured it for you. Next, create the SAML integration that will allow AWS SSO to broker access for your users. Click the SAML box to open the SAML dialog.
Open the AWS SSO console in a new browser tab so that we can generate the Single Sign-On application that will allow access to a dashboard in your account. From the AWS SSO console, click Applications on the left. Your list of applications may be similar to this, or it may be empty if you are a new AWS SSO user.
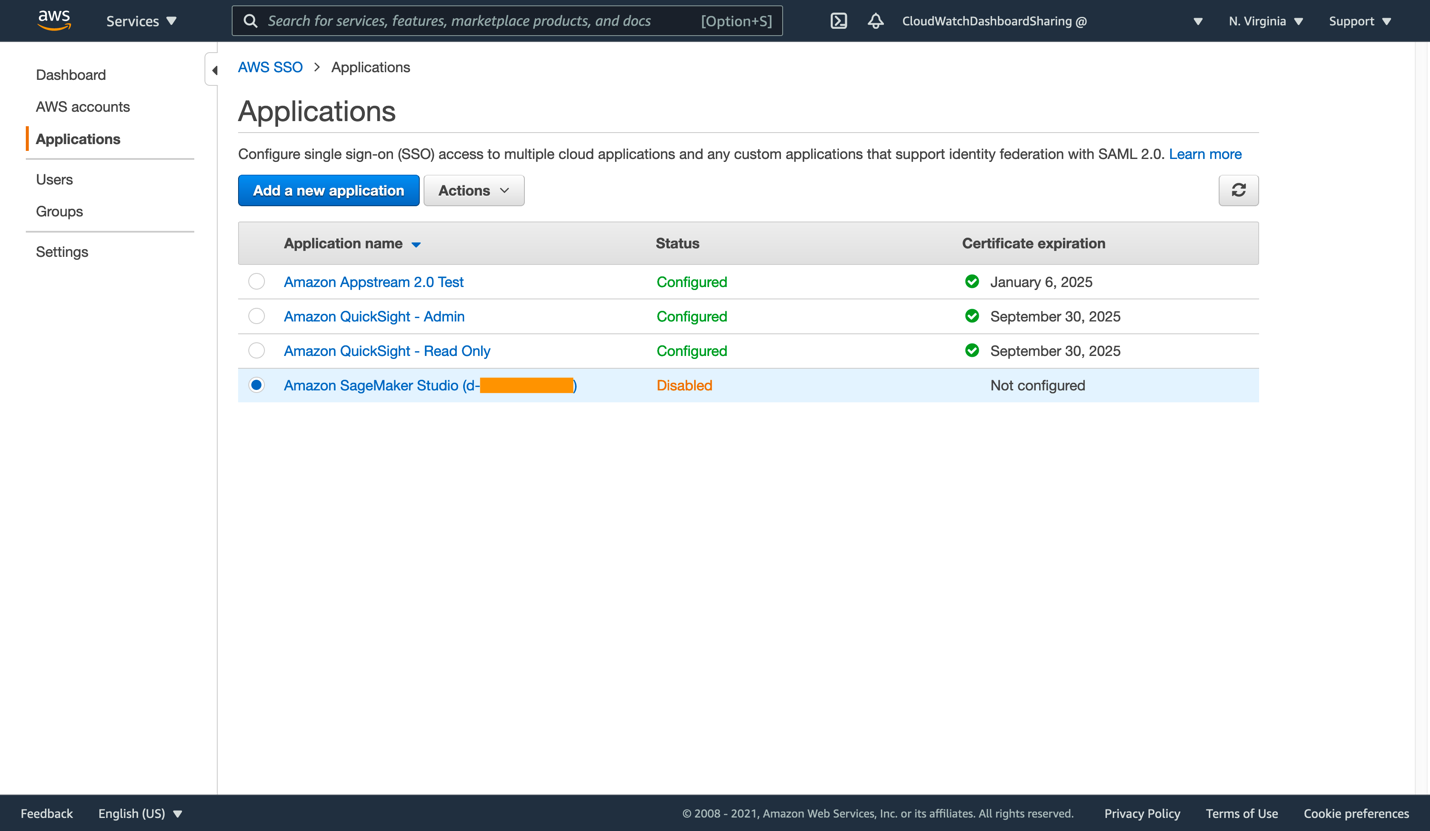
Figure 5: List of applications within AWS SSO
- Click Add a new application to proceed. There is no CloudWatch pre-configured application in AWS SSO, so we will be creating a custom SAML 2.0 application instead. Click Add a custom SAML 2.0 application.
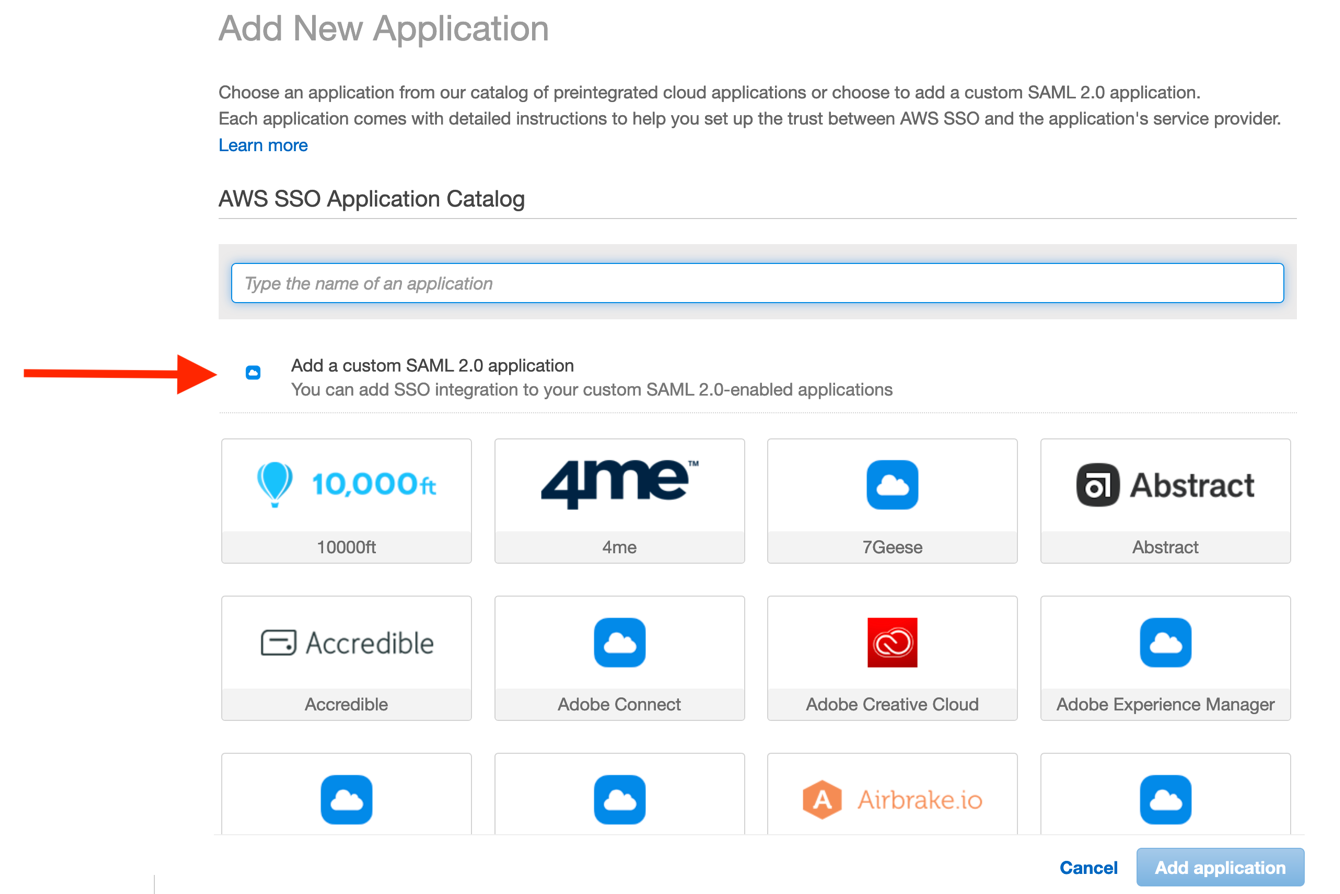
Figure 6: Beginning the custom SAML 2.0 application configuration
The configuration dialog requires that we copy some data from the CloudWatch and Cognito consoles. Likewise, you must copy some data back into the Cognito console, thereby creating the trust between both applications.
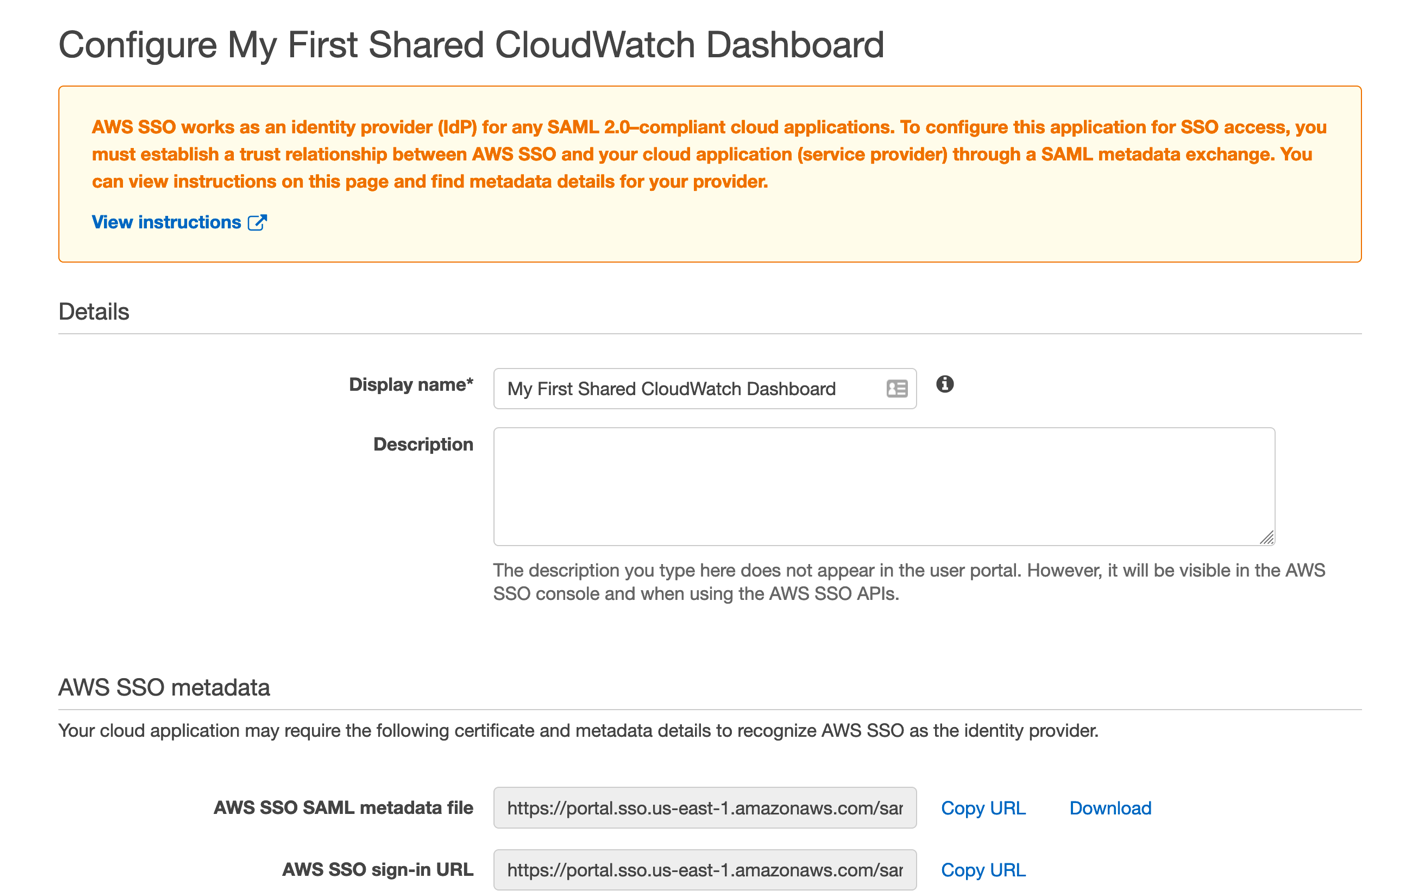
Figure 7: Enter the name of your new dashboard sharing application
- Give your new SSO application a name and description corresponding to the first dashboard you wish to share.
- Next, click Copy URL on the AWS SSO SAML metadata file line, and then paste this URL into the Cognito console’s Metadata document field. Complete the Provider name field as well, and then click Create provider in the Cognito console. Your new provider will now appear under the new Active SAML Providers section.
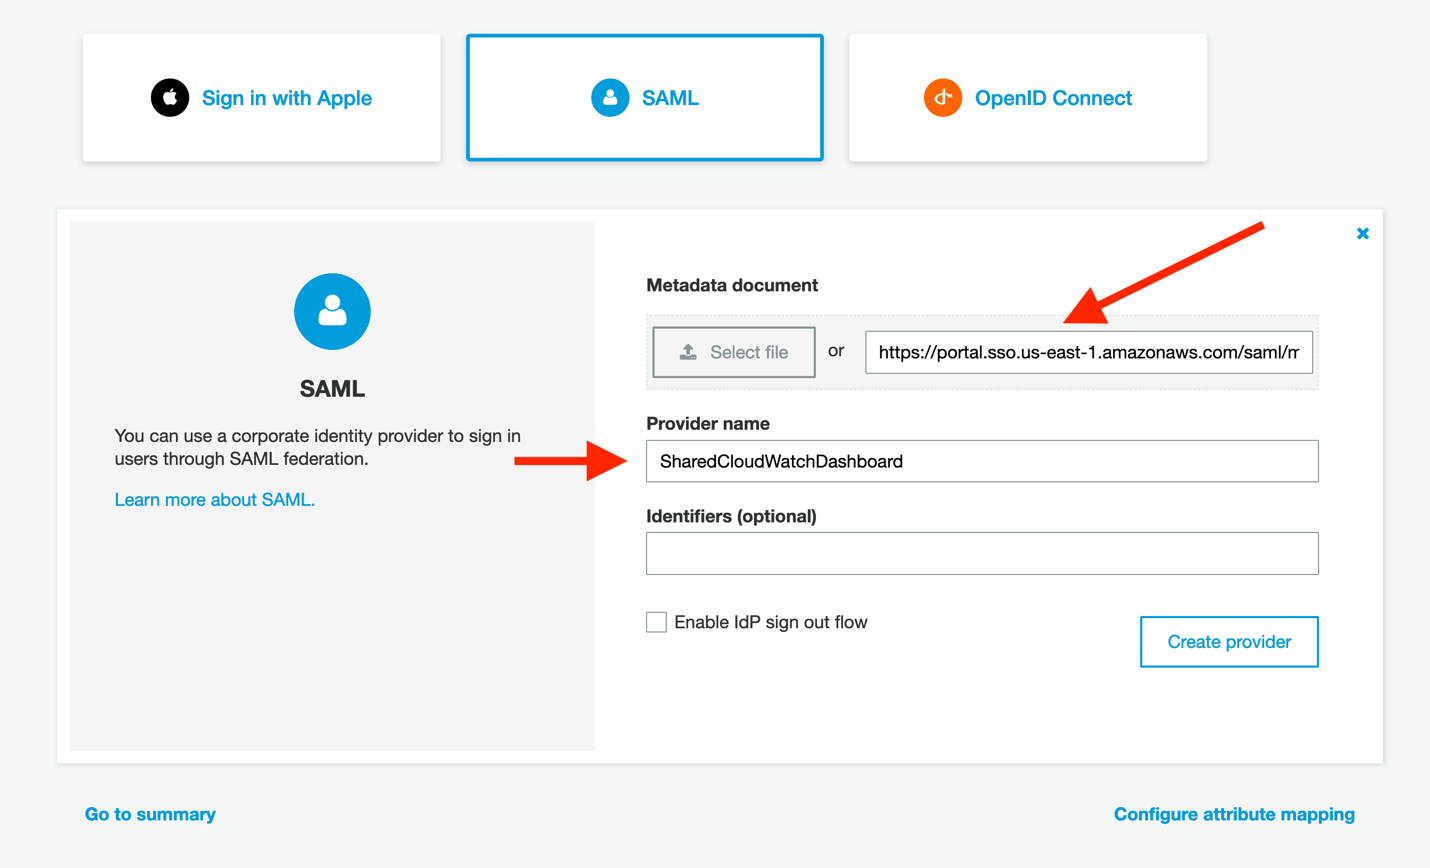
Figure 8: Configure Cognito to read the AWS SSO metadata document
- In the Cognito console, click on Attribute mapping on the left side of the screen. We must add a value here so that we can map the user identities consistently from your identity provider into Cognito. Click Add SAML attribute, ensure that Capture is checked, and then enter email for both the SAML attribute and the User pool attribute. Then, click Save changes.
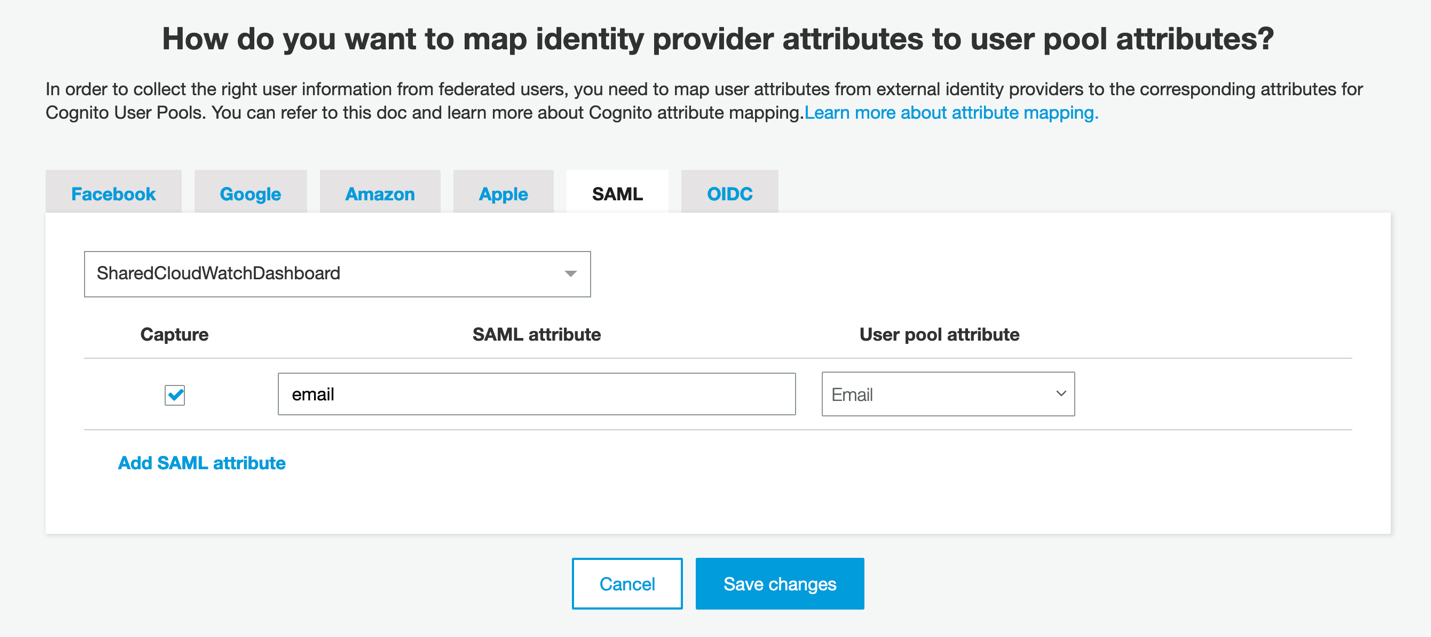
Figure 9: User identities using their email attribute
- Click App clients to continue the Cognito configuration, and then click Add an app client.
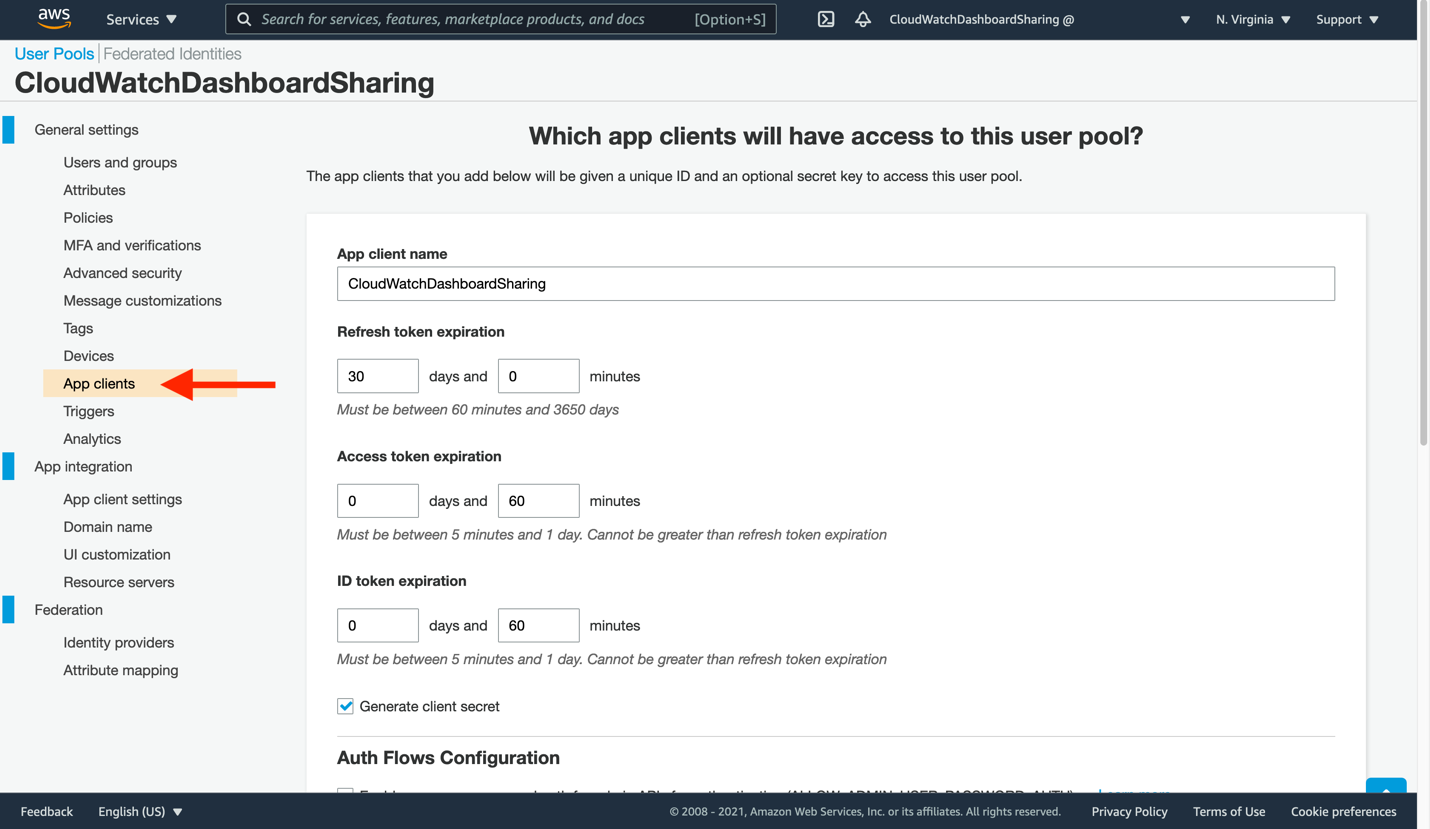
Figure 10: Create a new app client to consume your CloudWatch dashboard
- Enter a new App client name, and then leave the remaining settings unchanged. Click Create app client at the bottom to proceed.
- Now, you will tell our app client where to find the CloudWatch dashboard sign-in and sign-out URLs. Click App client settings on the left-side navigation. The app client you just created will be present here, though not yet ready for use. Make the following changes:
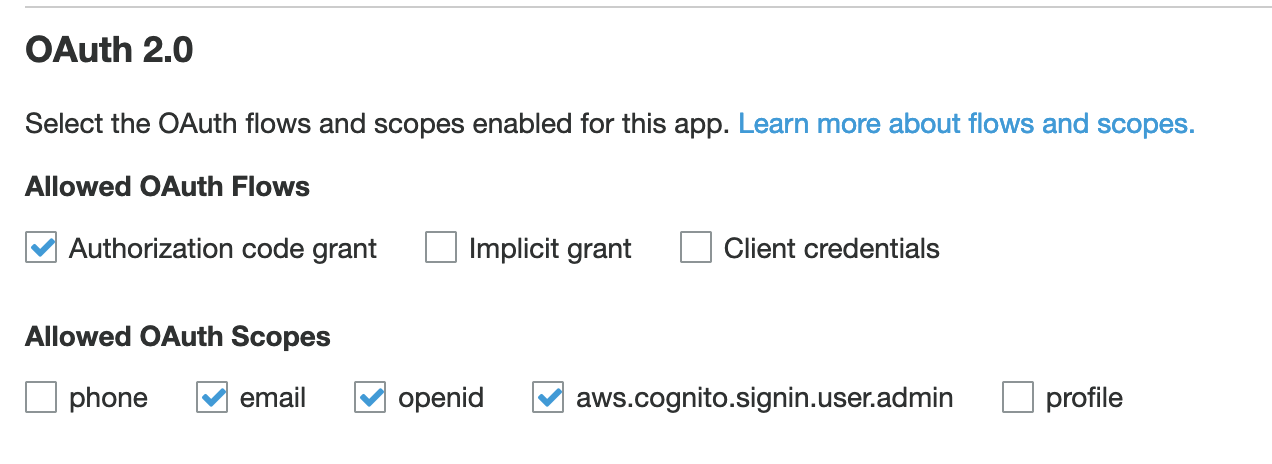
Figure 11: Configure your app client settings
Check the box to enable your identity provider
Enter https://cloudwatch.amazonaws.com/dashboard.html for both the Callback URL and Sign out URL. These indicate where your users will be redirected after a successful log in or log out.
Select the following OAuth flows: Authorization code grant
Select the following Allowed OAuth Scopes: email, openid, aws.cognito.signin.user.admin
- Click Save changes.
- You are nearly done! Return to the CloudWatch console, specifically to the Dashboard sharing page. Click the refresh icon in the Available SSO providers section, and then select your SSO application, followed by Save changes. This will provision the remainder of the Cognito user pool, and let us finalize the AWS SSO application.
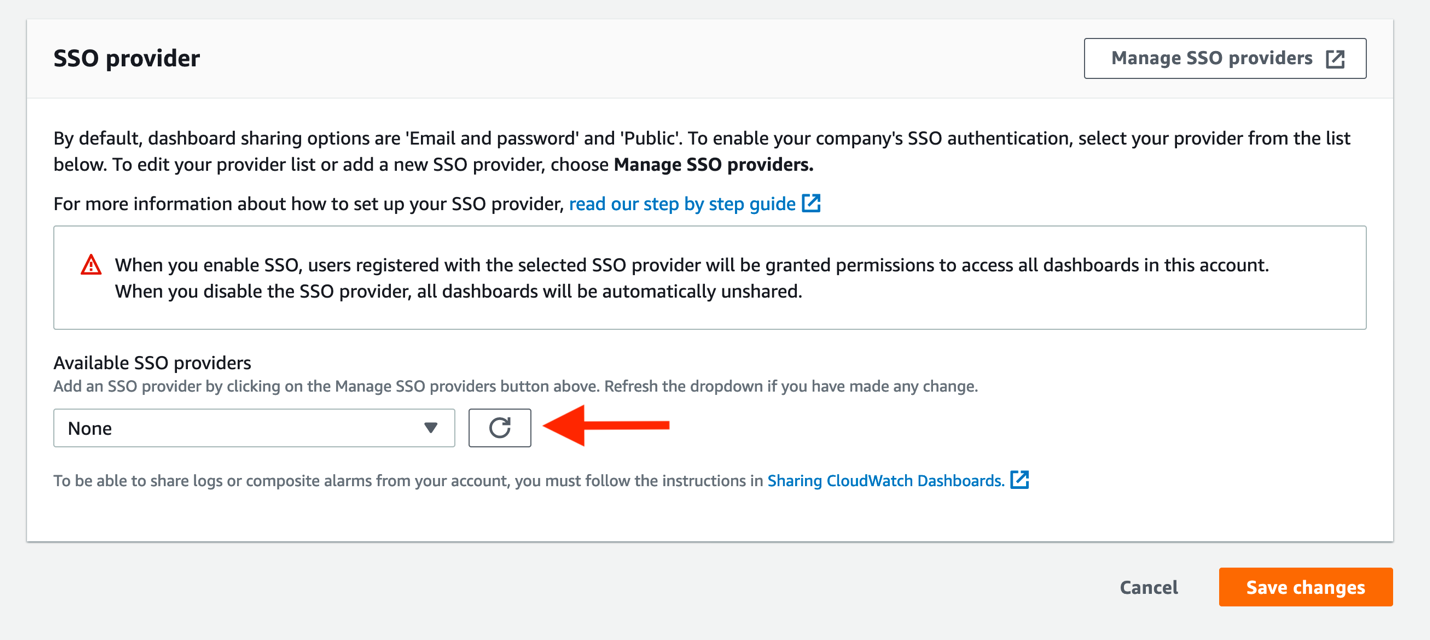
Figure 12: Attach your SSO provider to CloudWatch
- You must supply two pieces of information from Cognito back into the AWS SSO console, where our SAML application is not yet fully configured. First, click App integration in the Cognito console. You should now see a Domain value (which was not present before). Copy this to your clipboard.
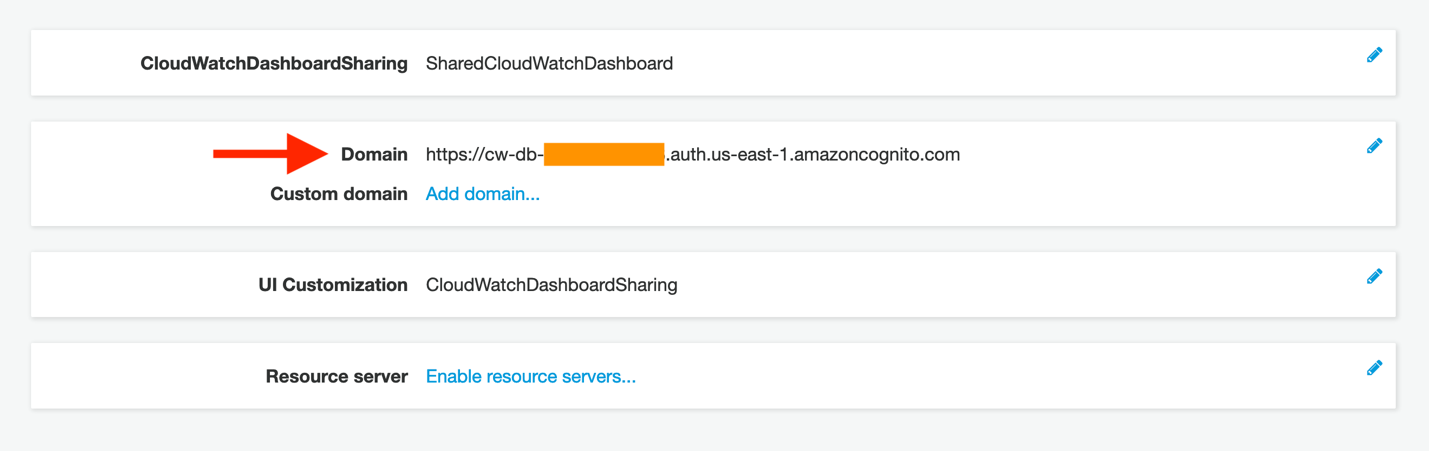
Figure 13: Copy the newly created domain name
- Return to the AWS SSO tab in your browser. Click the If you don’t have a metadata file, you can manually type your metadata values link. This will display the Application metadata section, seen here:
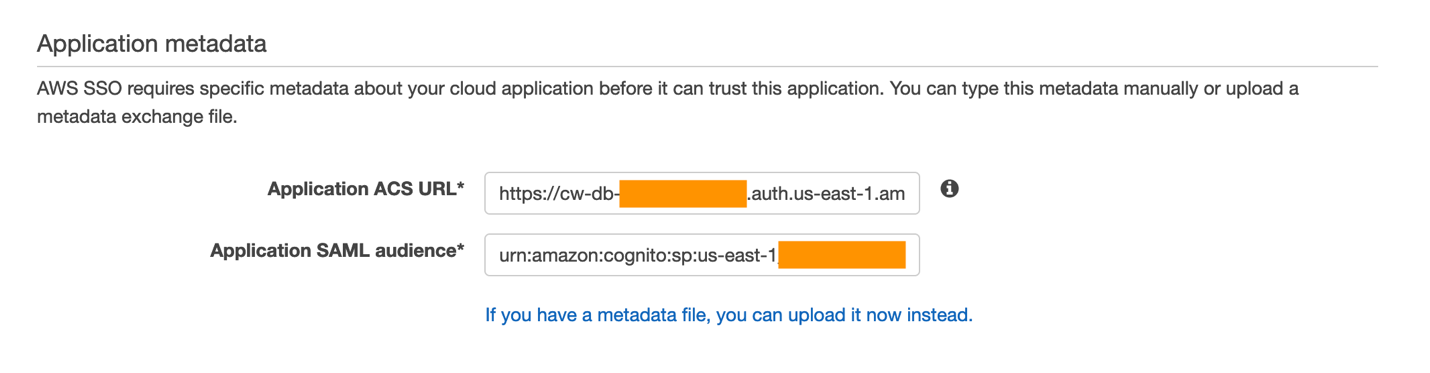
Figure 14: View of the Application metadata configuration portion of your AWS SSO application
- Paste this domain value into the Application ACS URL field in the AWS SSO console, but append the following to the end:
/saml2/idpresponse
A completed application start URL will look similar to this if you are submitting a POST binding in your SAML provider (such as in our example):
https://cw-db-XXX.auth.AWS-REGION-CODE.amazoncognito.com/saml2/idpresponse
- Next, enter the Application SAML audience. This will also need to be edited. In the Cognito console, click General settings on the left-side navigation.
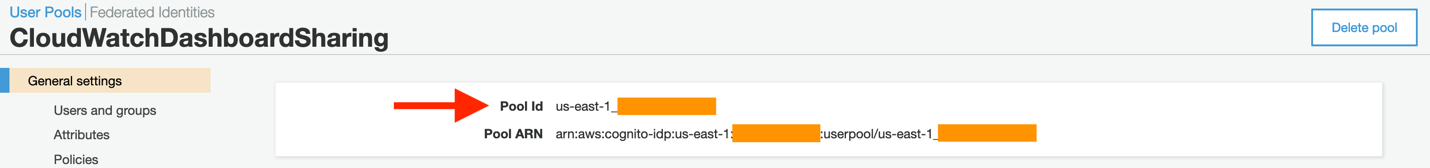
Figure 15: A sample view of the Cognito pool ID, as seen from the console
- Now copy this value into the AWS SSO page’s Application SAML audience field, with the following prefix:
urn:amazon:cognito:sp:
Your completed value will look similar to this:
urn:amazon:cognito:sp:AWS-REGION-CODE_xXXXXXXXX
- From the CloudWatch console, navigate to the dashboard that you wish to share. Each dashboard can now be published as a unique application with the same Application ACS URL and Application SAML audience. Only the actual dashboard start URL must be changed. Navigate to your target dashboard, click Actions, and then Share dashboard.
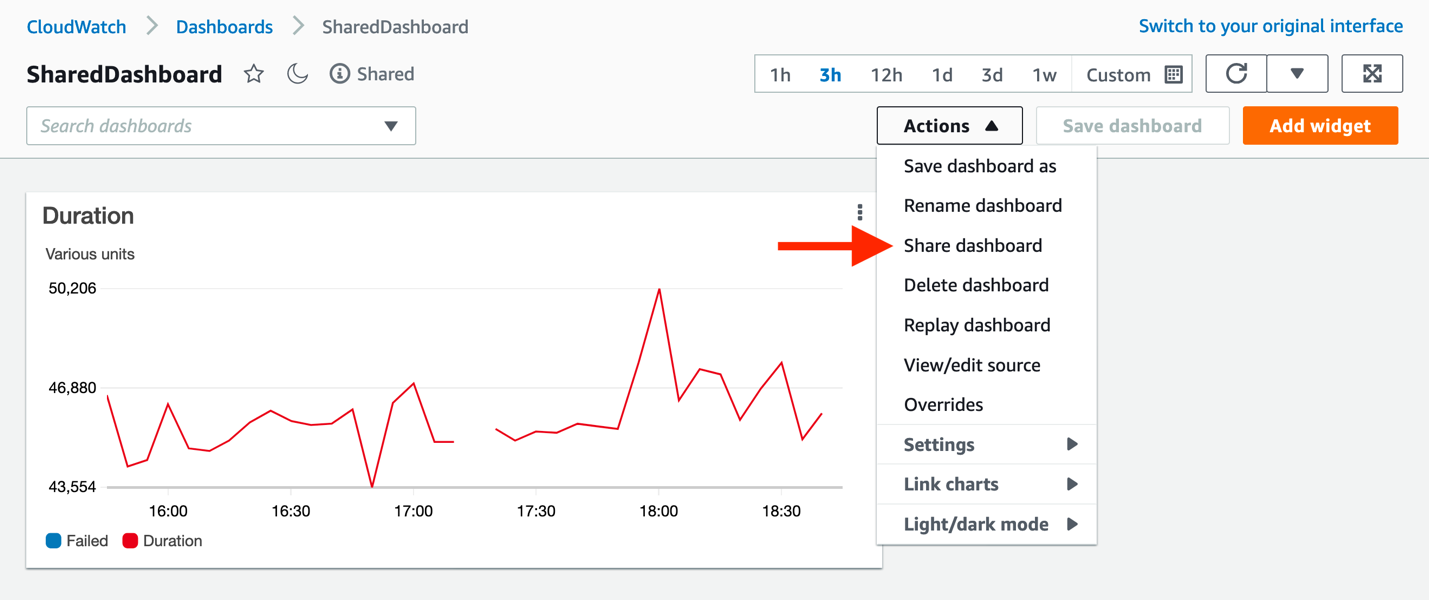
Figure 16: Finding the unique URL for the dashboard to be shared
- From this page, copy the Sharable linkand paste it into the Application start URL in the AWS SSO console, and then click Save changes in AWS SSO.
Click Attribute mappings, and enter the following:
Maps to this string value or user attribute in AWS SSO: ${user:email}
Format: emailAddress
Note: the SAML provider provides an email value in the assertions it creates when redirecting your users to the CloudWatch dashboard.
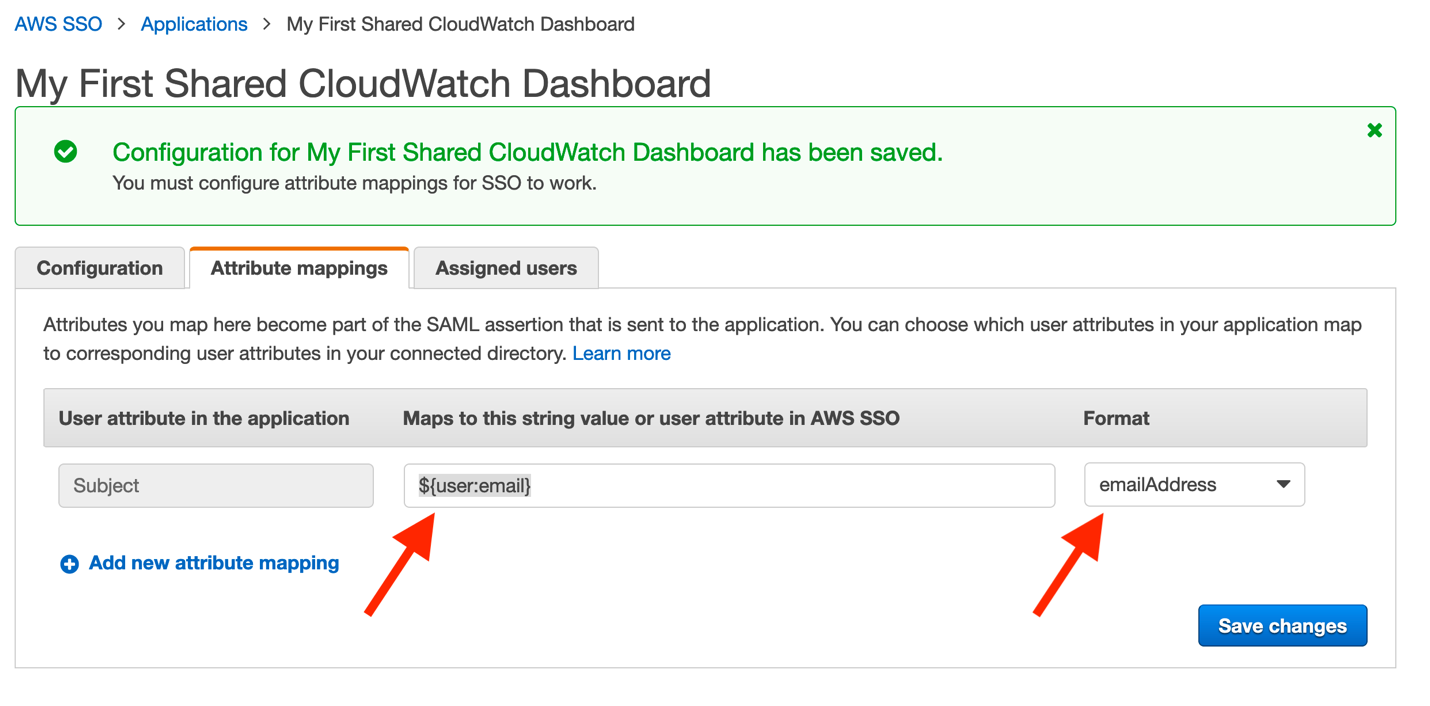
Figure 17: Mapping user’s email addresses within AWS SSO
- Finally, click Save changes. Configuration is now complete!
You must assign users to your new application. However, once completed, they will have access to your dashboard through the standard AWS SSO login page, similar to that seen here:
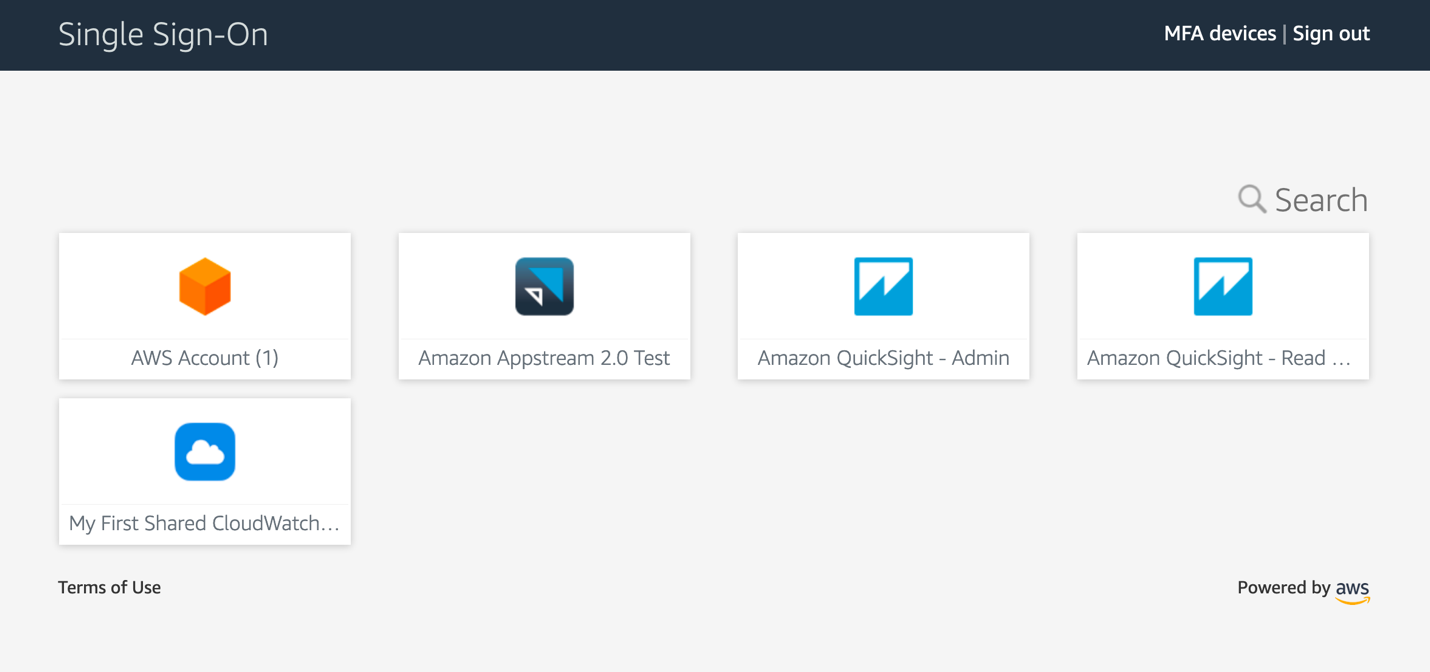
Figure 18: Standard view of the AWS SSO application page
Summary
Your users now have a non-console experience allowing them to view dashboards that you publish to them. Even a business audience can take full advantage of the data that CloudWatch contains. Their utilization of the platform does not require any AWS account access, roles, or special permissions, and it will enable users of corporate identity providers to consume operational metrics, logs, and alarms in a convenient and secure fashion.
Figure 19: Animated GIF of the login experience for a CloudWatch dashboard
How Projects Can be Tracked on AWS to Increase Accountability and Reduce Cost
=======================
This post was co-authored by Amy McVey and Jarrod Lewis from AER
As AWS usage within a business increases over time, it can become difficult to track the AWS resources that have been created (e.g. EC2 instances, S3 buckets) and who is responsible for them. This can lead to unnecessary costs from resources that are no longer used or sized incorrectly. If you can’t easily identify a resource owner, it can be a slow and painful process to clean things up. Instead, you need a mechanism that ensures every AWS resource has a clear owner, and the owner has visibility into their AWS resources and how much they cost, so that they can make frugal decisions.
In this post, we show a generalized version of how Atmospheric and Environmental Research (AER), a Verisk Business, created a project tracking solution that can be implemented by using tags, AWS Budgets, AWS Config, AWS Lambda, AWS Cost and Usage Report, Amazon Athena, and Amazon QuickSight to increase accountability and reduce cost. We’ll also show the impact that this project tracking solution has had at AER.
An overview of the project tracking solution
One commonly utilized method to track work units, particularly in a contracting business, is by project. A project typically has a clear owner and its own cost center, so it makes sense to track AWS resources by project. This solution can also be adapted to track products, cost centers, etc. as needed.
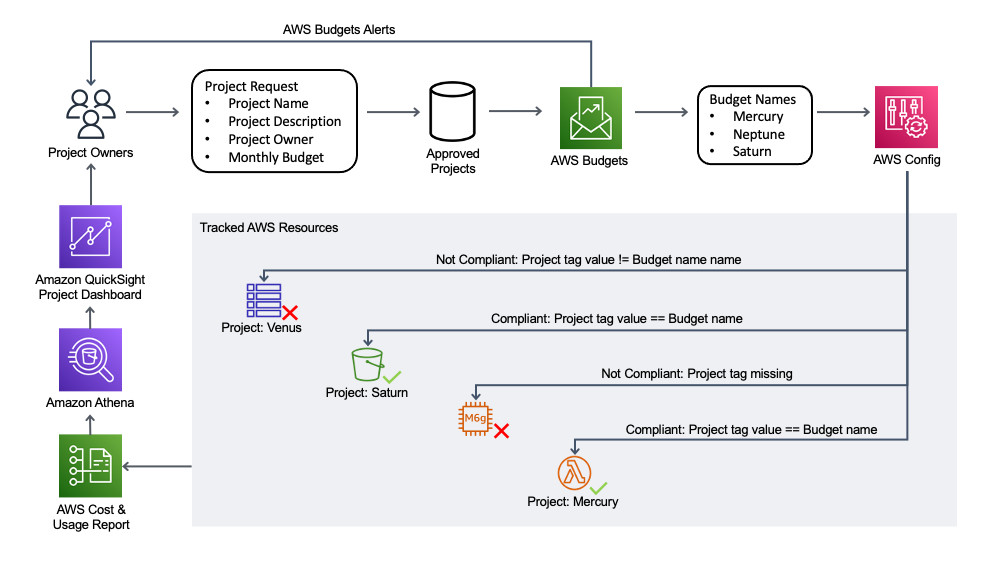
Figure 1: Project Tracking Solution Diagram that shows the three solution components. Project owners apply for new projects, which creates a new AWS Budget. AWS Config verifies that each AWS resource has a project tag with a value equal to the name of an AWS Budget. Project owners can access an Amazon QuickSight dashboard to view the resources associated with their projects, as well as the associated cost.
Figure 1 shows that the components of the project tracking solution are:
A project creation request process.
An AWS Budget for each project.
An AWS Config Custom Rule verifying that each AWS resource has a tag with a key equal to Project and a value equal to the name of an AWS Budget.
An Amazon QuickSight dashboard that uses data from an AWS Cost and Usage Report queried via Amazon Athena in order to show a dashboard that includes a per-resource breakdown of cost for a given project.
Together, these components create a feedback loop driving accountability and cost reduction.
The project creation request process
The first part of the solution is establishing a project creation request process. When a new project is needed, a project owner must go through a low-friction project application process. They will provide the project name, project description, estimated monthly budget, and project owner contact information. This part of the solution could easily be adapted to fit a given business’s existing processes and tools.
An AWS Budget for each project
For each approved project, an AWS Cost Budget is created with a Budget Filter that includes resources with a Project tag that has a value equal to the project name. The AWS Budget name must also match the project name. The project’s estimated monthly budget is used as the AWS Budget amount, with budget alerts sent to the project owner at predefined cost threshold percentages. Mandating the creation of an AWS Budget for each narrowly-defined project, and having a clearly defined project owner, helps reduce surprise costs at the end of each month. These AWS Budgets can be created programmatically as part of the project creation process.
An AWS Config Custom Rule to ensure that resources have valid project tags
An AWS Config Custom Rule is created that utilizes an AWS Lambda function to continually evaluate whether all taggable AWS resources have a Project tag with a value equal to an AWS Budget name. After all authorized projects have gone through the project creation request process and the associated AWS Budget is created, this AWS Config Custom Rule highlights all non-compliant AWS resources.
Project dashboards in Amazon QuickSight
The AWS Budget for a given project alerts the project owner of cost thresholds over the course of the month. But after that alert comes in, the project owner might want a detailed view of the cost associated with each AWS resource within the project in order to better understand the principal cost components or identify the unexpected cost’s driver. To accomplish this, an Amazon QuickSight dashboard is created showing the project owner a per-resource breakdown of cost over time for a given project, as seen in Figure 2. A default project dashboard is made available to all project owners, and they can modify and extend that default dashboard to suit their particular project. To provide this level of per-resource granularity, the data is taken from the AWS Cost and Usage Report and queried via Amazon Athena based on deployment instructions from AWS documentation.
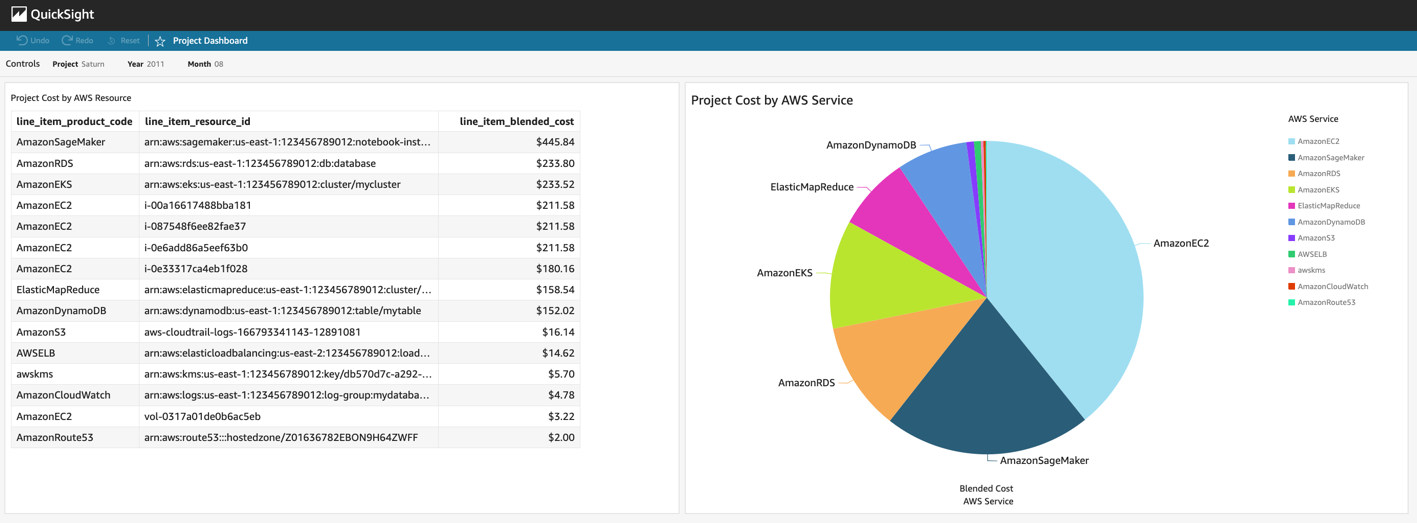
Figure 2: Amazon QuickSight Dashboard for Project Tracking. This dashboard shows data for a notional example project called Saturn from August, 2021. The figure on the left shows a per-resource breakdown of cost, and the pie chart on the right shows project cost per service.
Cost of the project tracking solution
The project tracking solution cost scales with the number of resources being tracked. AWS Config pricing is based on the number of configuration items recorded, as well as the number of active AWS Config rule evaluations. The AWS Lambda function utilized to evaluate the custom AWS Config rule is charged based on the number of requests and the duration of those requests. This scales with the number of resources being evaluated by AWS Config.
The AWS Cost and Usage Report (CUR) is free to generate, but you pay for the Amazon S3 storage that it consumes. Amazon QuickSight pricing is based on the number of users, so it scales with the number of project owners who want to access QuickSight directly. Amazon Athena pricing is based on the amount of data scanned, so its cost will scale with how frequently the Amazon QuickSight dashboards are utilized by project owners and how many resources are contained in the CUR.
How AER has implemented project tracking
AER helps governments and businesses analyze the world’s biggest weather and climate issues. AER utilizes AWS to run scientific computing workloads, such as numerical weather prediction and air quality modeling at scale. As AER’s AWS usage increased over time, they implemented the project tracking solution in order to help control costs and increase accountability.
As seen in Figure 3, when this tracking system was first deployed at AER, only 34% of AWS cost was associated with properly tagged AWS resources, while 66% of the resources did not have valid project tags. The visibility into non-compliant resources given by AWS Config allowed AER to increase this to 98% of the cost covered by properly tagged AWS resources in just four months. Some resources simply needed to be properly tagged, and some resources were found and removed that had been created accidentally or forgotten. Only allowing resources with a project tag, and having clear project ownership, had several benefits for AER:
Reduced cost from removing unnecessary AWS resources.
Reduced time that it takes to notify a resource owner of an operational issue.
Reduced time that it takes to audit AWS resources for compliance.
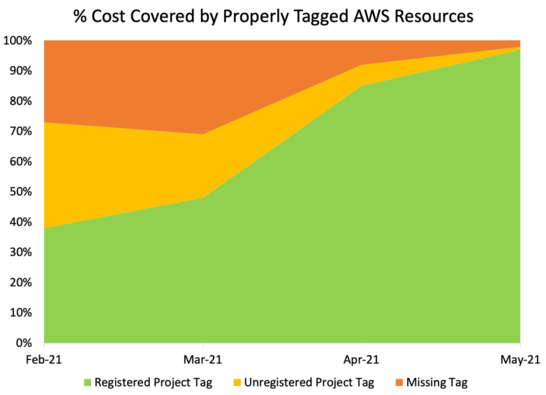
Figure 3: Shows the percentage of cost covered by properly tagged AWS resources over time, starting with the rollout of the above project tracking solution.
Conclusion
The project tracking solution shown above promotes localized accountability with granular cost centers at the project level. Keeping cost centers small and giving their owners tools to clearly track resources and associated cost helps prevent the accumulation of untracked resources and their cost. It also allows project owners to act continually in order to keep costs in line with expectations.
Furthermore, it ensures that every AWS resource has a clear owner, regardless of whether the resource was created directly by an IAM user or programmatically by a Continuous Integration/Continuous Deployment (CI/CD) process. This resource ownership mapping makes audits easier, and it reduces the necessary time to identify a resource owner during an operational event.
Since implementing the solution described above, AER has driven up project tagging compliance so that properly tagged resources account for 98% of their total cost. Most importantly, AER can operate confidently on AWS in order to deliver value to its customers.
To learn more about how AWS services and solutions can be utilized to organize resources and control costs, explore our AWS Management & Governance and AWS Cost Management blogs. In particular, if you are interested in additional strategies for controlling tags, read the recent post titled Implement AWS resource tagging strategy using AWS Tag Policies and Service Control Policies (SCPs).
Monitor Private VPC Endpoint Health in Hybrid DNS Environments Using CloudWatch Synthetics
=======================
We start by paying homage to the Amazon CloudWatch Synthetics canary naming convention, which nods to the original use of canaries to detect carbon monoxide in coal mines. The bird’s small size, high metabolism, and intensified breathing led to their early demise when exposed to the poisonous gas, thereby allowing miners to take corrective action before succumbing themselves. Aptly named, CloudWatch Synthetics canaries now let us detect customer experience and security challenges before our customers are directly impacted.
Canaries are configurable Node.js or Python scripts that let you monitor your REST API, URL, and website content on a recurring schedule, as they trace the same routes and conduct the same actions as your typical end-user. Continuous evaluation of endpoint availability and latency verifies your expected customer experience, either utilizing pre-built canary blueprints or custom scripts you’ve written.
To further actualize the CloudWatch Synthetics canary value, we will explore a real-world customer use-case, implementation strategy, and adoption outcome. Our spotlight customer supports an internal title search solution allowing analysts to evaluate ownership and claims on a real estate asset before a transaction involving the asset can occur. Their solution leverages a set of underlying microservices exposed via Amazon API Gateway. This requires a method for configuring cross-region disaster recovery (DR) traffic swings based on the health of their private API Gateway Endpoints within a hybrid DNS environment, where their REST APIs can only be accessed from their Amazon Virtual Private Cloud (VPC) using VPC interface endpoints.
Solution Overview
With private Amazon API Gateway Endpoint health as our air quality, and 4XX/5XX status codes as our indicator of dangerous gases, the following solution details out how to create and configure CloudWatch Synthetics canaries in order to monitor VPC Endpoint Health with hybrid DNS enabled between on-prem and AWS.
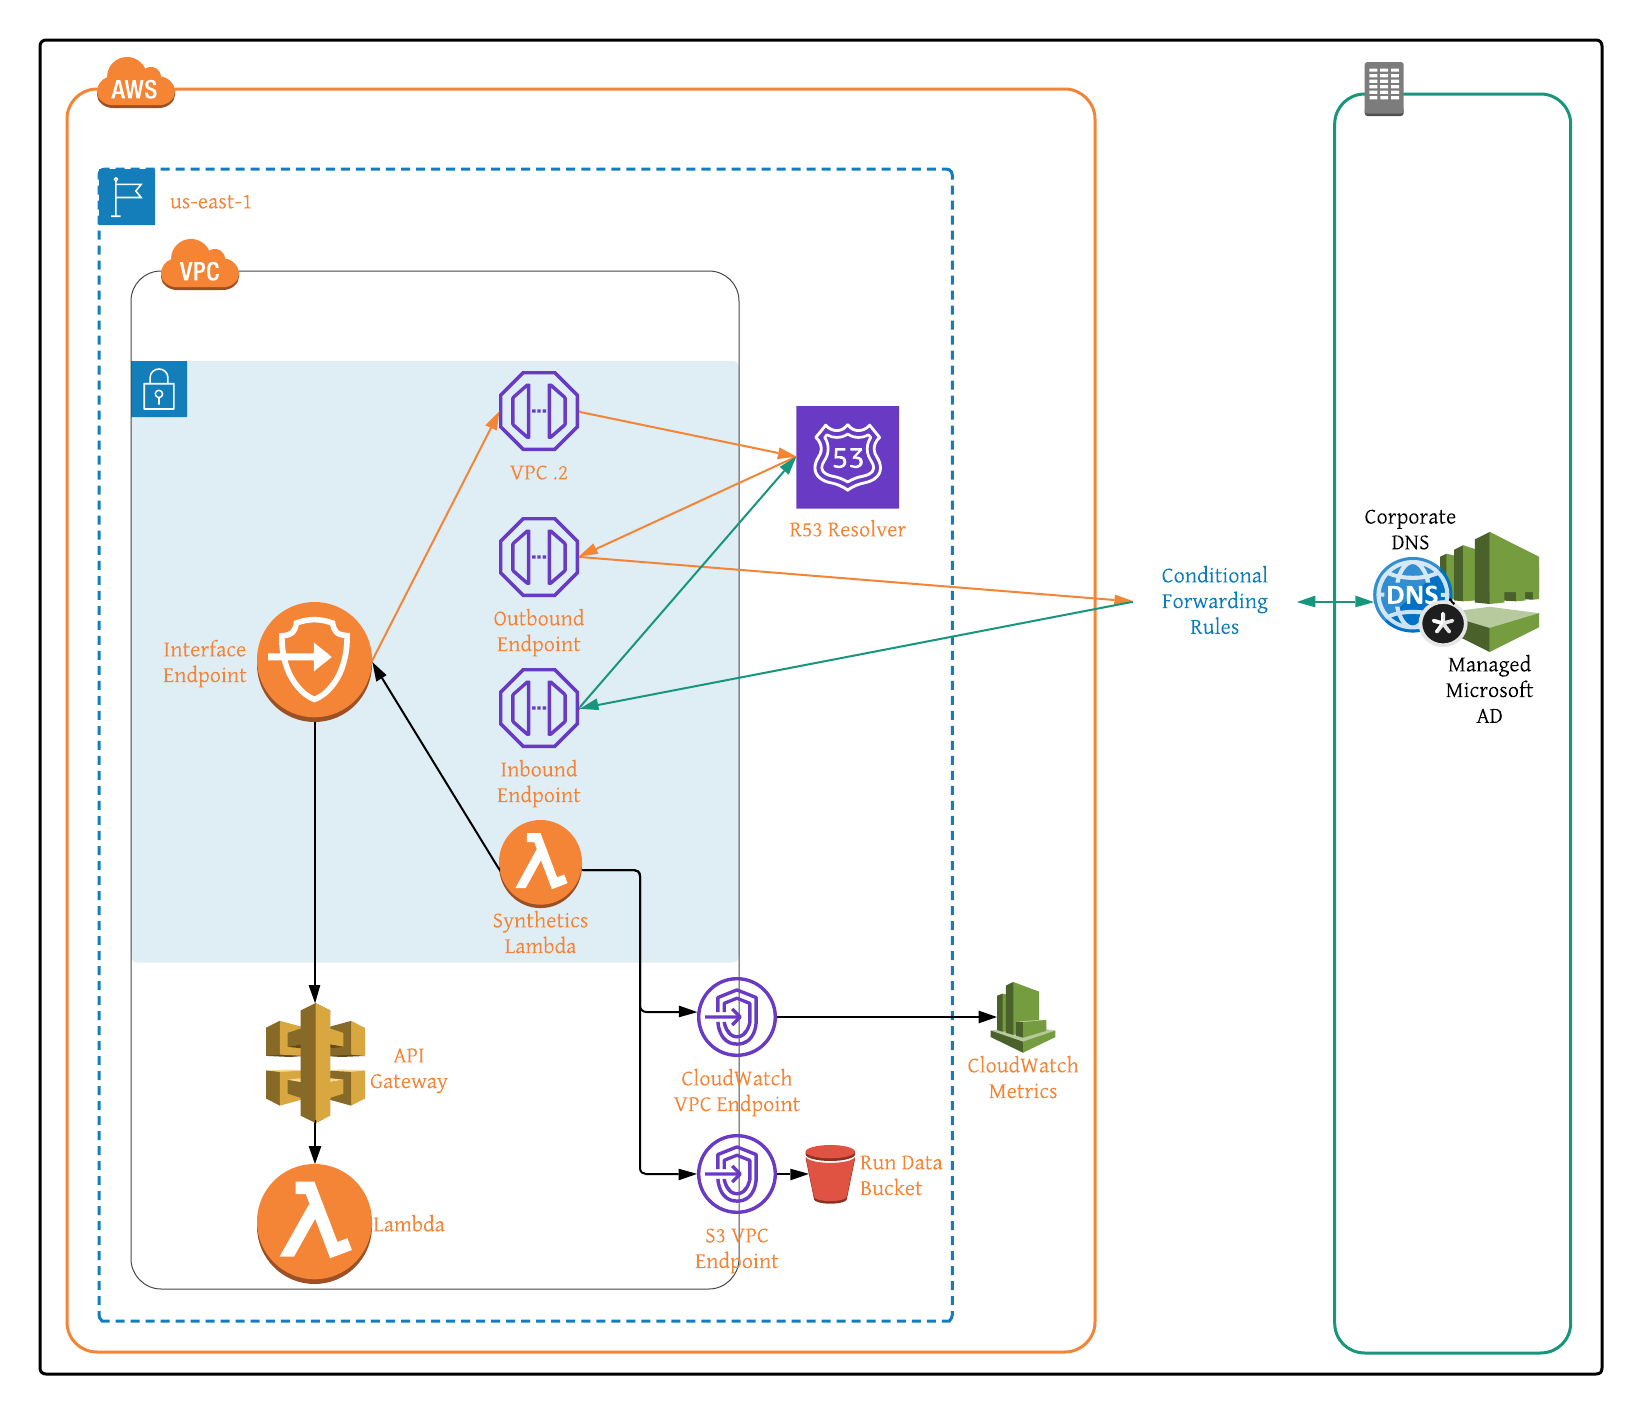
Figure 1: Architecture Overview of Amazon API Gateway VPC Interface Endpoints in Hybrid DNS Environment.
Customer Use Case
To move from their historically monolithic architecture over to a microservice-based approach, our spotlight customer chose a fully-serverless design utilizing Amazon API Gateway with an AWS Lambda backend. While highly available and scalable, the serverless architecture does not natively consider every aspect of a well thought out DR strategy. In building their serverless infrastructure and standardizing on Amazon API Gateway, we identified four chief metrics requiring monitoring to ensure optimal and resilient API performance.
The presence of 4XX status codes generally indicates that the request for the customer-owned resource contains bad syntax, presumably due to the requester. To account for client-side errors, such as missing or incorrect authentication headers, we monitored the clients’ HTTP requests and resulting 4XX status codes. CloudWatch Synthetics canary scripts let you specify an acceptable limit, signaling when the number of issues exceeds your defined threshold within a given window.
In addition to client-side errors, 5XX response codes can indicate server-side errors, like an endpoint timeout or potential bug. As with 4XX responses, we can generally tolerate 5XX responses within a reasonable and defined limit. However, more errors than our defined limit over a sustained time period is concerning. Thankfully CloudWatch Synthetics canary scripts also let us configure our server-side error threshold, similar to how we did with client-side errors.
The third metric utilized for monitoring API Gateway health was request count. This includes requests resulting in both successful and error responses. Helpful for monitoring the costs associated with API Gateway (billed based on the number of per million requests per month), request count let us pinpoint bugs in application code that resulted in erroneous requests or even retries to a specific endpoint. Permission challenges can also be identified when the request count is close to or equal to zero. This means that the application code calling the API Gateway endpoint is malfunctioning.
Finally, API Gateway request latency, the elapsed time between your API receiving and responding to a request, let us ensure business-defined SLA requirements were met. Higher latency can point to application code bugs or issues with the underlying transport. To discern where the request latency originates from, CloudWatch Synthetics canaries let us measure both the resulting time it takes your API endpoint to return, and the round-trip time for the request. The closer these two values, the more likely that the source code is the issue, while greater disparity indicates an infrastructure challenge.
In our case, when any of the above metrics fell outside of specified lower or upper bound parameters, we manipulated routing in order to send traffic for a given API Gateway endpoint to its secondary counterpart within another region, while also alerting our administrator to the apparent application challenge. Closed-loop automation let us minimize impact to our end-users, while detailed error reporting presented the opportunity to make changes to application code, thereby mitigating the risk of similar future challenges.
Solution Implementation
Our solution is in 3-parts:
- Monitoring VPC Interface Endpoint Health with CloudWatch Synthetics Canaries.
- Enabling Hybrid DNS Between On-Prem and AWS.
- Subsequently Testing Canary Run Metrics Within Hybrid DNS Environment.
Part A: Monitoring VPC Interface Endpoint Health with CloudWatch Synthetics Canaries
Step 1: Create Private API Gateway Endpoint.
Step 2: Create VPC if one is not already configured, and then note the VPC ID, private subnet IDs, and security group IDs for later use when configuring the Synthetics canary.
Step 3:
- If VPC has internet access enabled, then create NAT Gateway and add it to VPC and skip to Step 4.
- If VPC does not have internet access enabled, then follow the steps below:
- Create S3 VPC Endpoint to store Synthetics canary run data and create CloudWatch VPC Endpoint with com.amazonaws.region.monitoring as the service name in order to collect Synthetics canary run metrics.
- Enable VPC DNS resolution and hostnames.
Step 4: Launch your CloudWatch Synthetics Canary CloudFormation Stack by selected ‘Launch Stack’ below:

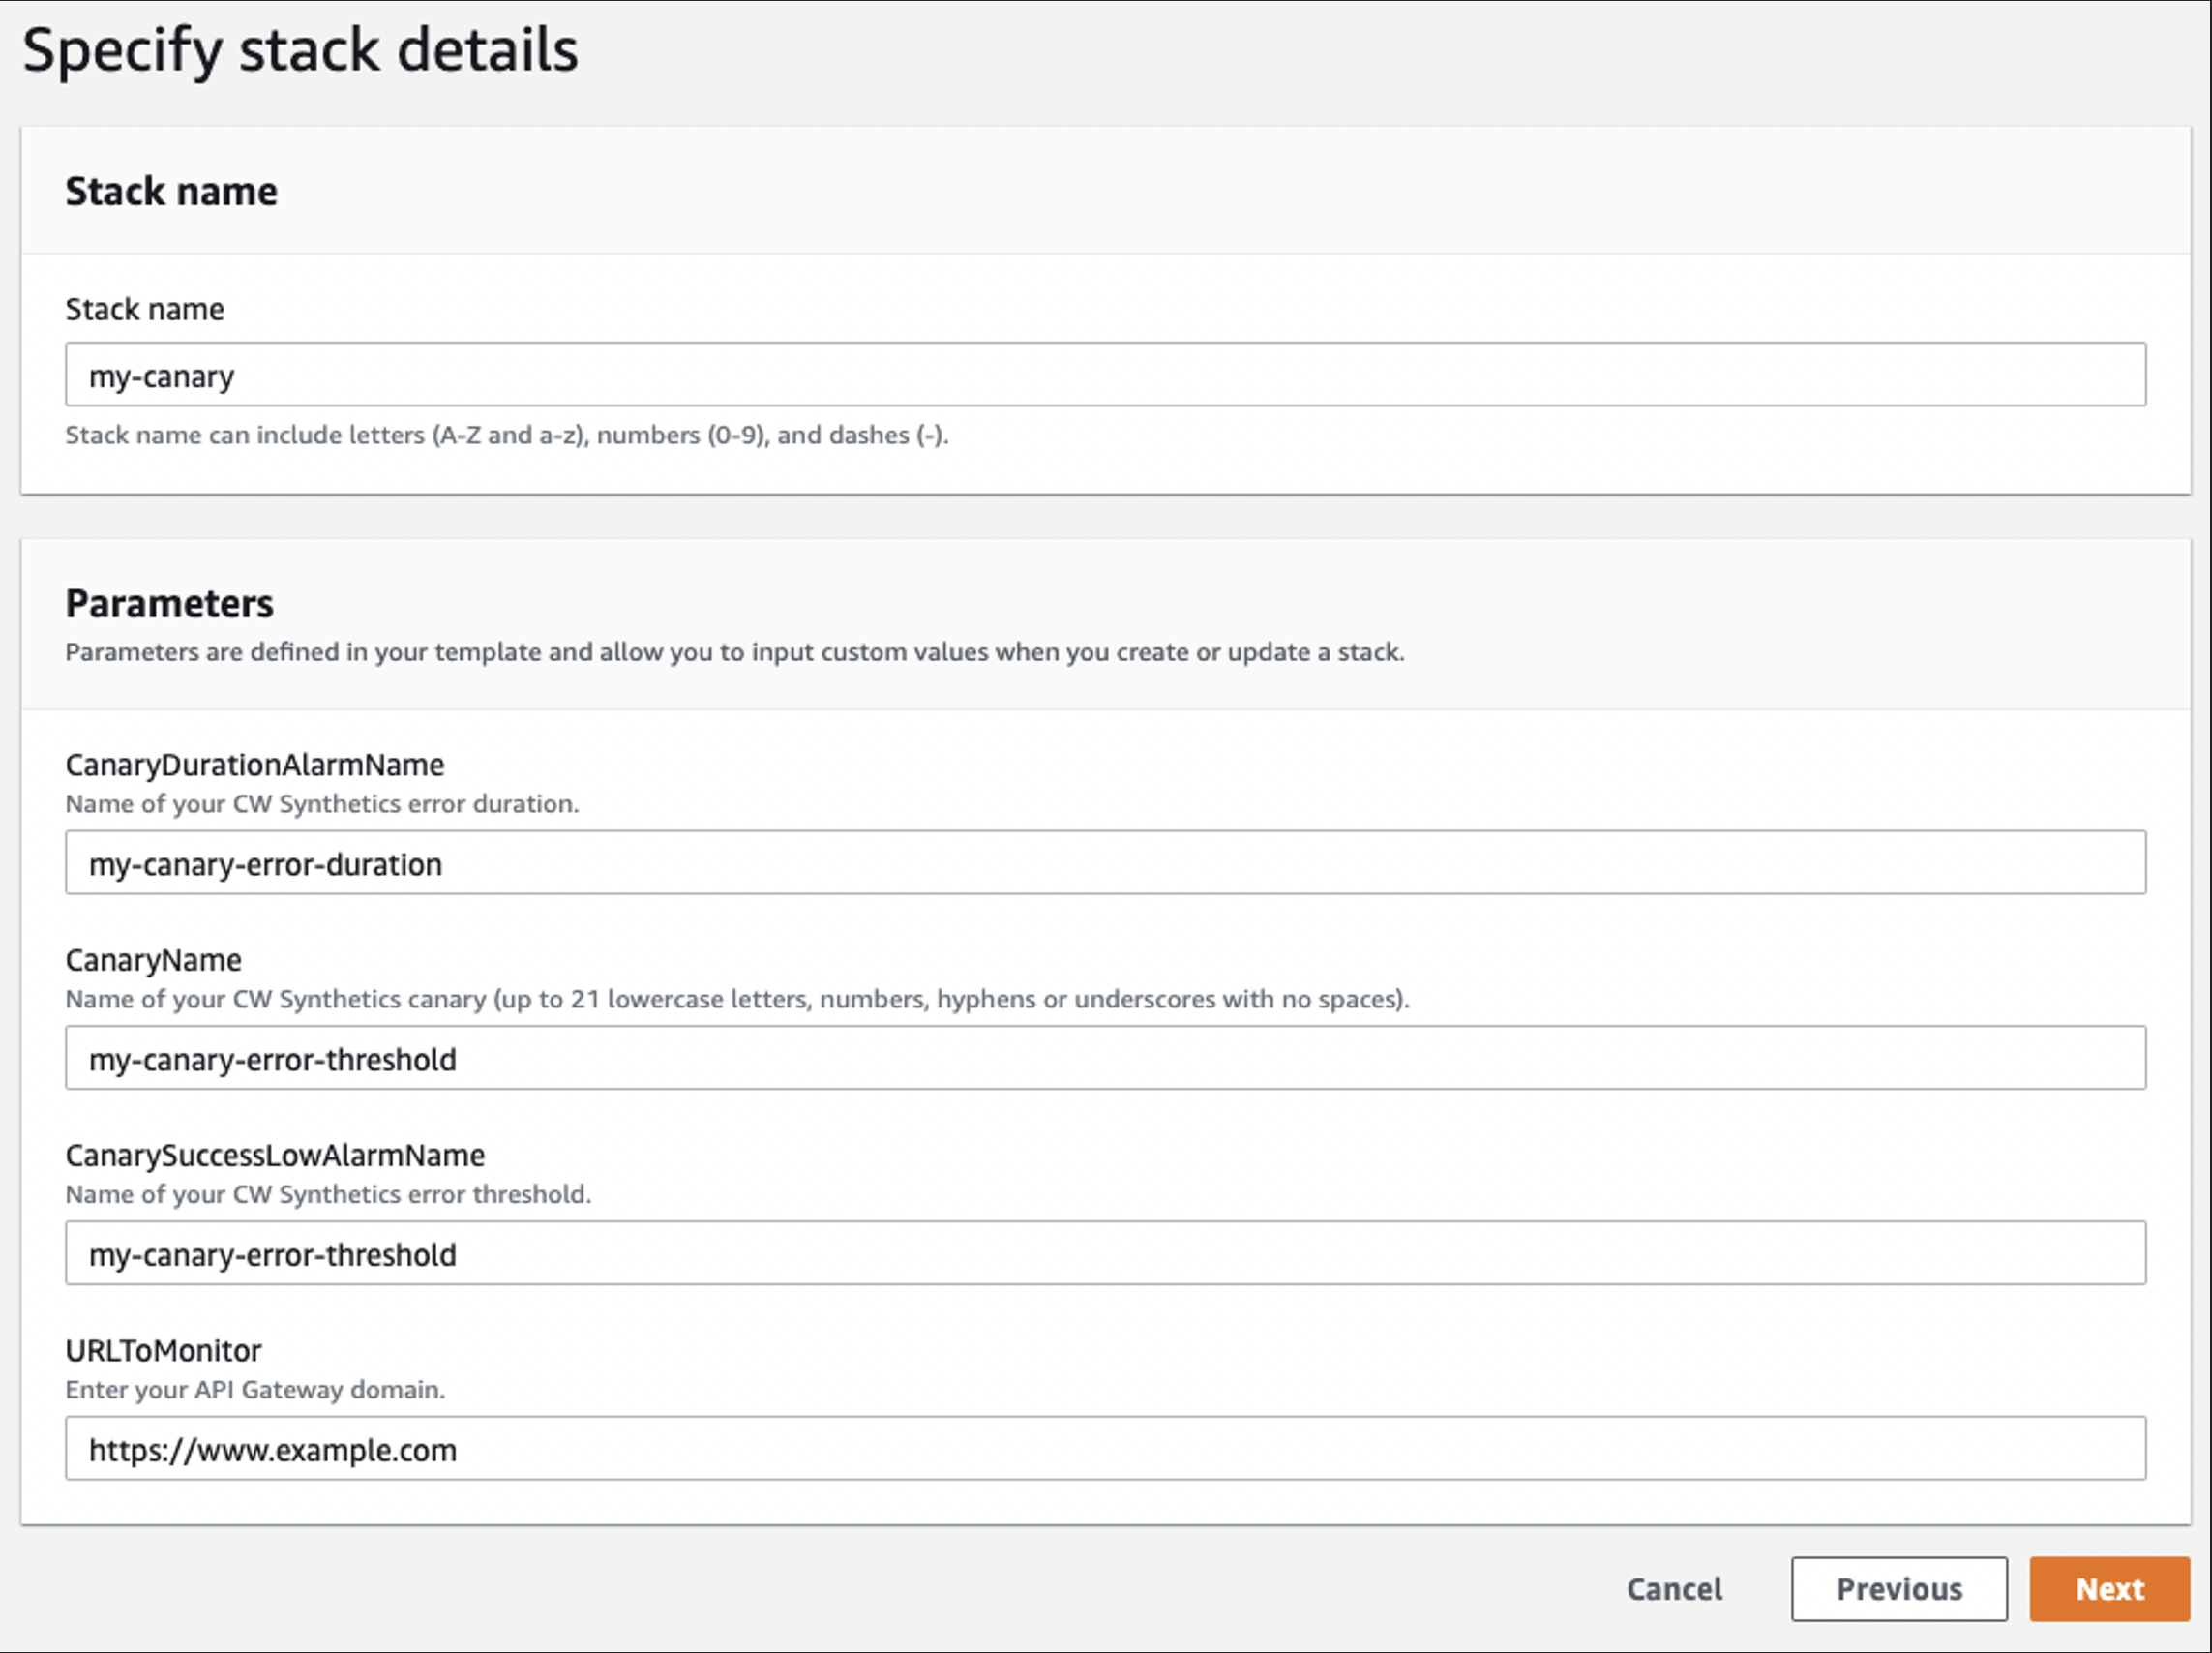
Figure 2: CloudFormation Specify Stack Details Configuration Example
Step 5: Navigate to canaries list page and select recently created Synthetics canary to monitor run metrics (Running state, screenshots, HTTP archive (HAR) files, and log files).
Step 6: (Optional) Navigate to CloudWatch User Guide: Troubleshooting a canary on a VPC if you encounter errors when creating the Synthetic canary.
Part B: Enable Hybrid DNS Enabled Between On-Prem and AWS
Step 7: If on-premise DNS service is unavailable, then create AWS Managed Microsoft AD to represent on-premise DNS server. If using on-premise DNS server, then note your DNS server addresses and skip to Step 3.
- Enter directory information:
- Edition: Standard Edition.
- Directory DNS name: <your-corp-dns>
- Directory NetBIOS name – optional: corp
- Directory description – optional: <description>
- Admin password: <password>
- Confirm password: <password>
- Select Next.
- Choose VPC and subnets:
- VPC: <Step-2-VPC>
- Subnets: <Private-Subnet-1A>, <Private-Subnet-2A>
- Select Next.
- Select Create Directory.
Step 8: Capture Directory details within Directory Service console, and note your DNS server addresses (each AD domain controller comes with embedded DNS service).
Step 9: Create Route 53 Outbound Endpoint (no Conditional Forwarding Rules yet) in order to enable DNS query forwarding to your AD domain DNS servers.
- General settings for outbound endpoint:
- Endpoint name: <outbound-endpoint-name>
- VPC in the Region: us-east-1 (N. Virginia): <Step-2-VPC>
- Security group for this endpoint: <Step-2-VPC-Security-Group>
- IP addresses:
- IP address #1:
Availability Zone: us-east-1a
Subnet: <Private-Subnet-1A>
Select Use an IP address that is selected automatically
-
- IP address #2:
Availability Zone: us-east-1b
Subnet: <Private-Subnet-2A>
Select Use an IP address that is selected automatically
- Select Submit (Outbound Endpoint creation can take up to 5 minutes).
Step 10: Create Route 53 Inbound Endpoint – (Optional for API Gateway deployments, Inbound Endpoints enable your on-premises DNS to query the Route 53 Resolver for any DNS zones (i.e., Private Zones) hosted on Route 53).
- General settings for inbound endpoint:
- Endpoint name: <inbound-endpoint-name>
- VPC in the Region: us-east-1 (N. Virginia): <Step-2-VPC>
- Security group for this endpoint: <Step-2-VPC-Security-Group>
- IP addresses:
- IP address #1:
Availability Zone: us-east-1a
Subnet: <Private-Subnet-1A>
Select Use an IP address that is selected automatically
-
- IP address #2:
Availability Zone: us-east-1b
Subnet: <Private-Subnet-2A>
Select Use an IP address that is selected automatically
- Select Submit (ENI created and IP addresses assigned behind the scenes).
Step 11: Create Route 53 Conditional Forwarding Rules.
- Rule for outbound traffic:
- Name: <outbound-rule-name>
- Rule type: Forward
- Domain name: corp.firstam.com
- VPCs that use this rule – optional: <Step-2-VPC>
- Outbound endpoint: <Step-9-Outbound-Endpoint>
- Target IP addresses:
- IP address: <Managed-AD-Domain-Controller-IP-Address-01>
-or-
<On-Premise-DNS-Server-IP-Address-01>
Port: 53
- Select Add target.
- IP address: <Managed-AD-Domain-Controller-IP-Address-02>
-or-
<On-Premise-DNS-Server-IP-Address-02>
Port: 53
- Select Submit.
Part C: Test Canary Run Metrics in Hybrid DNS Environment
Test configuration by navigating to canaries list page to monitor the recently created Synthetics canary’s run metrics. Successful configuration of hybrid DNS Synthetic canaries results in metrics that are still populating in near real-time, and they should match output similar to that below within the AWS Management Console.
Figures 3 and 4: CloudWatch Synthetics Console Showing Canary Test Runs and Their Expanded HTTP Method Call Details.
Testing both our Synthetics and hybrid DNS configuration is conducted simply by navigating to the canaries list page within the Management Console in order to monitor the recently created CloudWatch Synthetics canary’s run metrics. In our case, we are testing the API’s reliance on cookies present within the request header in order to provide custom functionality to specific users by setting cookies in our CloudWatch Synthetics script to mimic and validate custom behavior and validate it, showing restricted for users with invalid cookies.
Cleanup
To avoid incurring future charges, delete all resources configured using the above implementation guidance.
- Open the Amazon CloudWatch console.
- Choose the canaries you created and from Actions, choose Stop. Repeat this step for every region. This step is needed only if there are active canaries in Running state.
- Open the Amazon S3 console, and choose all the buckets that start with ‘my-synthetics-‘. Empty the bucket contents.
- Open the AWS CloudFormation console, select the CloudFormation Stack created in Step 4, and select Delete.
- Navigate to the AWS Directory Service console, and delete the optional directory created in Step 7.
- Within the Amazon Route 53 console, delete your inbound and outbound endpoints created in Steps 9 and 10 respectively, and delete your forwarding rules configured in Step 11.
Conclusion
Following successful testing of their private API Gateway endpoint DR configuration, our spotlight customer approved CloudWatch Synthetics for use within their Production environments. They deploy their canaries using CloudFormation templates (AWS::Synthetics::Canary) and have begun additional testing of CloudWatch Synthetics canaries across other projects as a viable solution for their cross-region private endpoint DR strategy. The customer’s next goal is integrating CloudWatch Synthetics with CloudWatch ServiceLens and X-Ray for more granular visibility into how an error may be affecting specific application components.
Extending your Control Tower Network security with Amazon Route 53 DNS Firewall
=======================
In our previous post, “Securely scale multi-account architecture with AWS Network Firewall and AWS Control Tower”, we described how AWS Network Firewall can be implemented in an AWS Control Tower environment. AWS Network Firewall provides a stateful, managed firewall with rules to filter and block network and application layer traffic coming to your applications. Centralized deployment lets you ensure that all of the VPC traffic across multiple AWS accounts traverses through the centralized inspection point. However, network firewall does not have visibility on DNS queries made through the Route 53 Resolver. Amazon Route 53 DNS Firewall comes to the rescue to ensure that network security is comprehensive and handles the DNS query traffic.
In this post, we extend our solution of AWS Network Firewall with Control Tower to include a centralized deployment of DNS firewall rules that can be applied to existing and new VPCs created with the Control Tower environment. This approach lets network administrators and developers ensure security at the DNS layer with minimal operational overhead.
Architecture overview
The following figure shows a multi-account structure that was created as part of the solution with some of the Route 53 DNS firewall components that are added as part of this post:
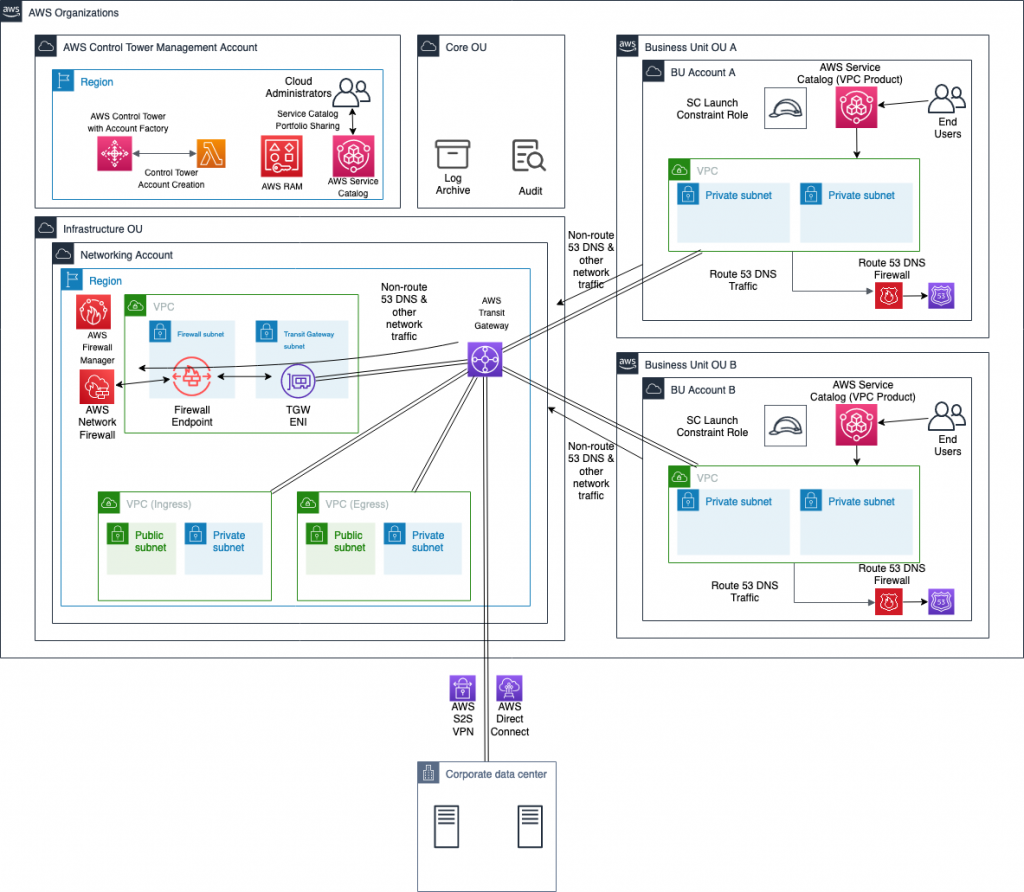
While most of the solution components, such as transit gateway and network firewall, are part of the previous solution, they are explained to ensure completeness. AWS Control Tower is set up in the management account. It creates a security OU that includes log archive and audit accounts. Based on the landing zone best practice, a separate infrastructure OU contains the networking account. This account hosts all of the centralized networking resources that support the networking requirements of the multi-account, multi-VPC architecture.
In this scenario, the networking account includes:
AWS Transit Gateway for a scalable multi-account, multi-VPC architecture.
Ingress and egress VPCs that control connectivity to the internet and connectivity to the on-premises network through an AWS Site-to-Site VPN connection or AWS Direct Connect.
This centralized deployment model architecture is described in the Deployment models for AWS Network Firewall post.
This approach lets network administrators govern and control networking requirements from a central location (the networking account). You can create other OUs and AWS accounts using AWS Control Tower, such as OU A with account A and OU B with account B through Account Factory, as shown in the previous figure. This makes it possible to consistently and automatically apply the AWS Control Tower guardrails and security baseline across these new accounts. This solution uses Account Factory and AWS Identity and Access Management (IAM) roles created by AWS Control Tower for the automation.
When the solution is deployed, the following components are created as part of the architecture. This is in addition to the solution components from the previous post which were comprised of a centralized deployment of AWS Network Firewall in the Networking account, AWS Lambda functions for automation, and AWS Service Catalog VPC product.
A Route 53 DNS Firewall domain list in Networking account associated with AWS Firewall Manager.
An AWS Lambda function in the Networking account that listens for triggers from an Amazon S3 bucket configured as part of this solution. This Amazon S3 bucket stores a file containing a list of domains that must be blocked to prevent malicious DNS traffic or to meet organizational security guidelines. Based on the trigger, the Lambda function updates the domain list in Route 53 DNS firewall in addition to updating the Network Firewall stateful rule group.
An AWS Firewall Manager policy that links the Route 53 DNS Firewall domain list in the Networking account to all of the DNS firewalls in other accounts of the AWS Organization, and associates that with all of the VPCs.
The architecture lets any traffic coming from VPCs be routed to the AWS Network Firewall first. The traffic is inspected before it goes to its destination, which could be another VPC, on-premises network, or internet through the egress VPC. DNS queries could be sent to non-Route 53 resolvers, such as Active Directory or other third-party DNS servers. In that case, having a Network Firewall stateful rule with a blocked domain list ensures that HTTP(S) traffic to these domains is blocked even though DNS queries are resolved. If those DNS queries are made to a Route 53 Resolver of the VPC through the “.2 resolver” or through resolver endpoints, then Route 53 DNS Firewall will block those queries. This ensures comprehensive security for your environment from malicious or unallowed domains.
The solution presented in this post ensures that this is pervasive across all of the VPCs in all of the accounts of Control Tower, as well as new AWS accounts created through the Account Factory.
Deploy the solution
While this post adds the DNS firewall component to the architecture, the steps below cover the deployment of the entire solution, the centralized deployment of Network Firewall, Network Firewall integration with Control Tower, and the integration with Route 53 DNS Firewall.
- In your AWS Control Tower environment, identify the networking account that will hold the central transit gateway and firewall.
- In the networking account, create a transit gateway. Clear the Default route table association and Default route table propagation Select the Auto accept shared attachments check box. Note the transit gateway ID for later use.
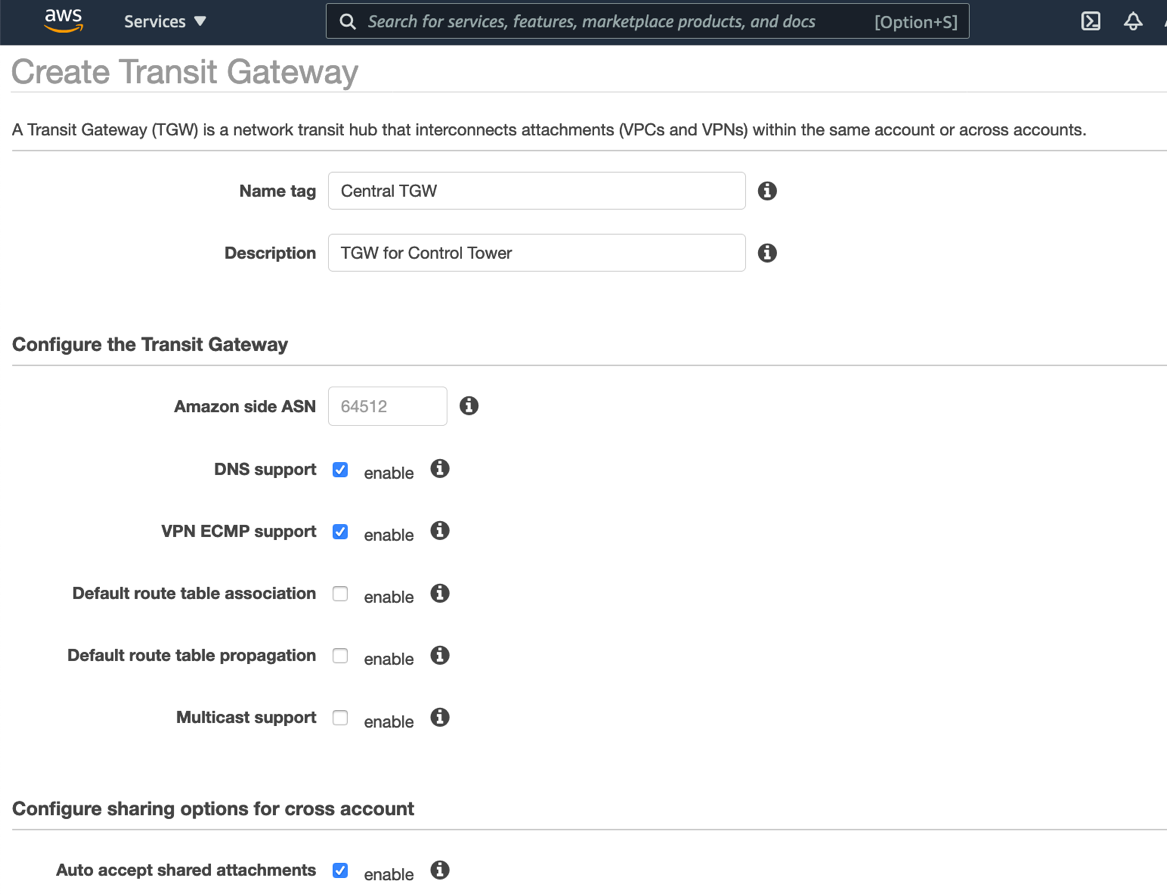
- In the networking account, open the Network Manager console, create a global network, and then register your transit gateway with this global network. Choose the global network, and then enable CloudWatch Logs Insights.
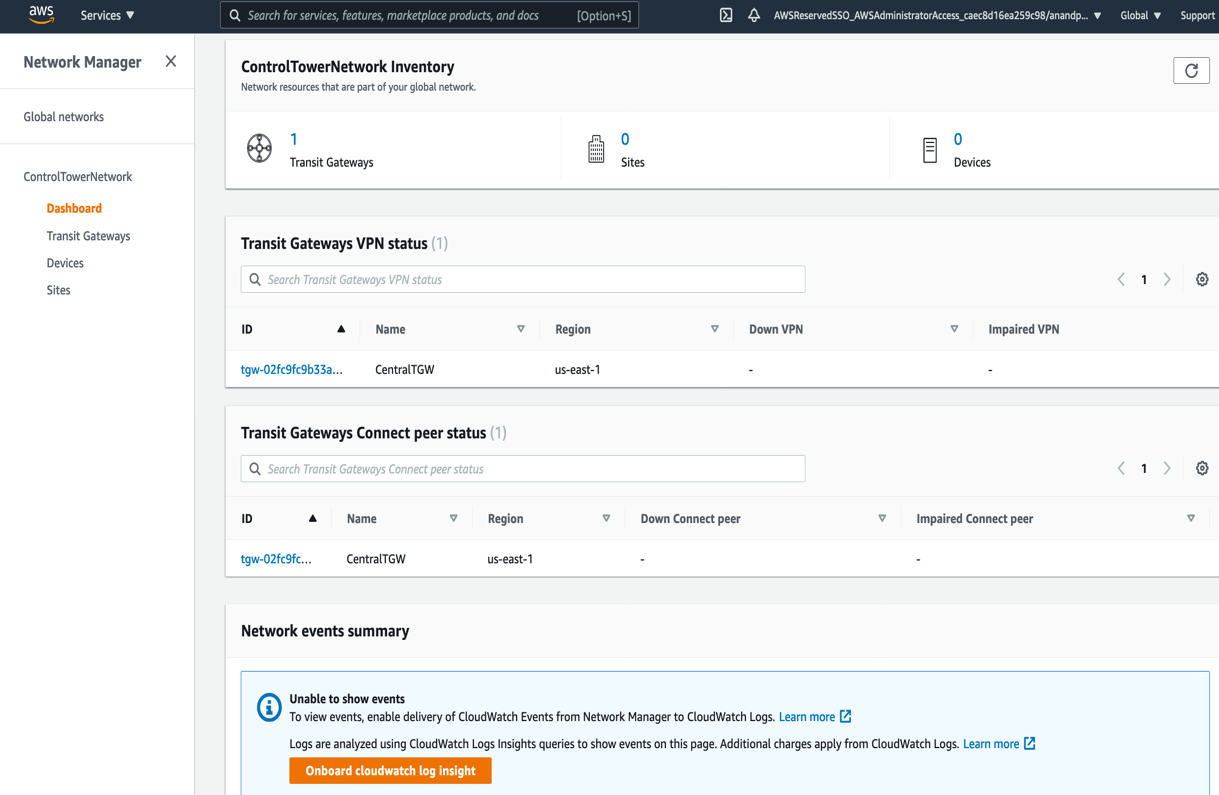
This allows events from AWS Transit Gateway, such as attachment, creation, or deletion, and route table changes, to be sent as events to CloudWatch Events.
- In the networking account, create two transit gateway route tables: Spoke VPC route table for associating with VPCs, and Firewall route table for associating with the inspection VPC that contains AWS Network Firewall. Record the route table IDs for later use.
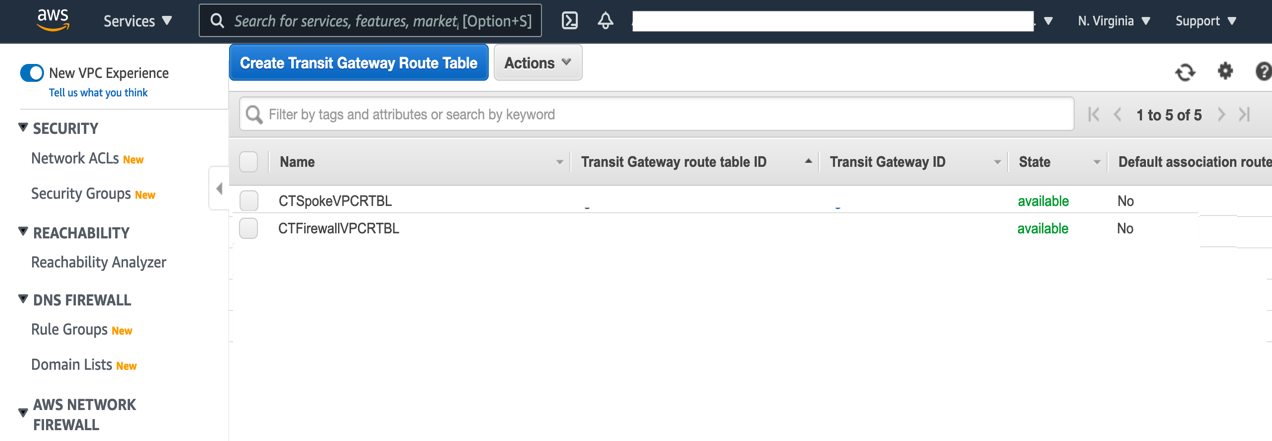
- In the networking account, create an Amazon S3 bucket that will be used to store the blocked domains list. Additionally, create a prefix (or folder) named “original”, which is where the blocked domains list will be placed. This prefix should not contain any files, aside from the blockeddomains.txt file. The Lambda function that will be deployed in Step 11 uses an Amazon Simple Storage Service (S3) trigger that looks for PUT events in this specific prefix. If other files are placed in this prefix, then the Lambda function will be inadvertently triggered.
- Use this CloudFormation template to deploy the AWS Network Firewall Deployment Automations for AWS Transit Gateway solution in the networking account. CloudFormation stacks are deployed using the console as explained in the documentation through console or CLI.
- Create a Stateful rule group for the network firewall deployed in the previous step. The stateful rule group must use the “domain list” type, and contain at least one entry upon creation. “.Example.com” can be used to fulfill this requirement. Both HTTP and HTTPS protocols should be selected, and the action must be set to Deny. Note the name of the Stateful rule group after it is created, as it will be used in Step 11 below.
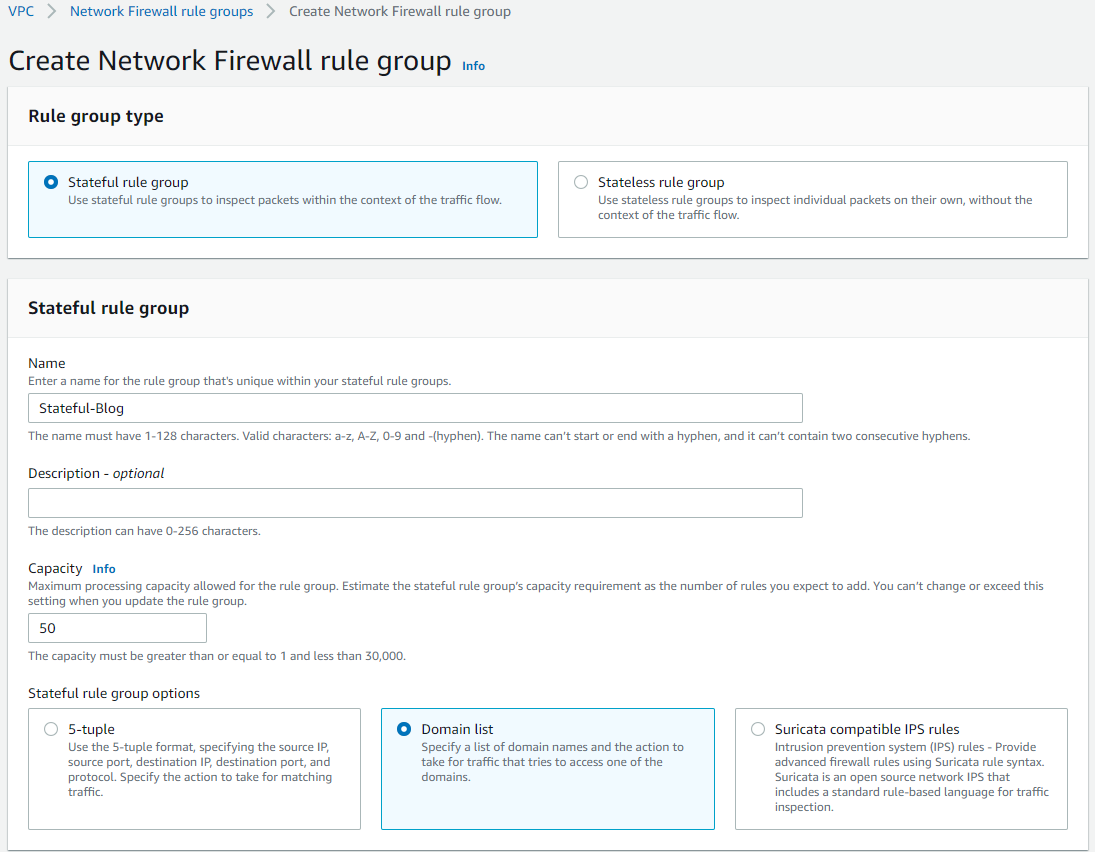
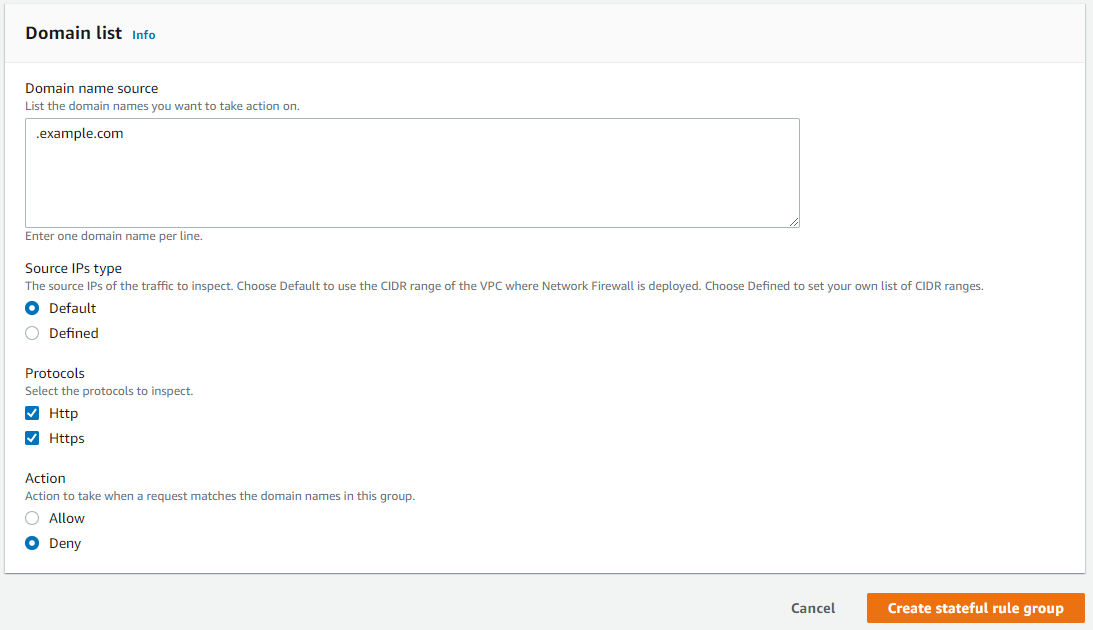
- The newly-created stateful rule group must be linked to the existing network firewall policy.
- Using the AWS Control Tower management account, open the AWS Resource Access Manager console. On the Settings page, select the Enable sharing with AWS Organizations
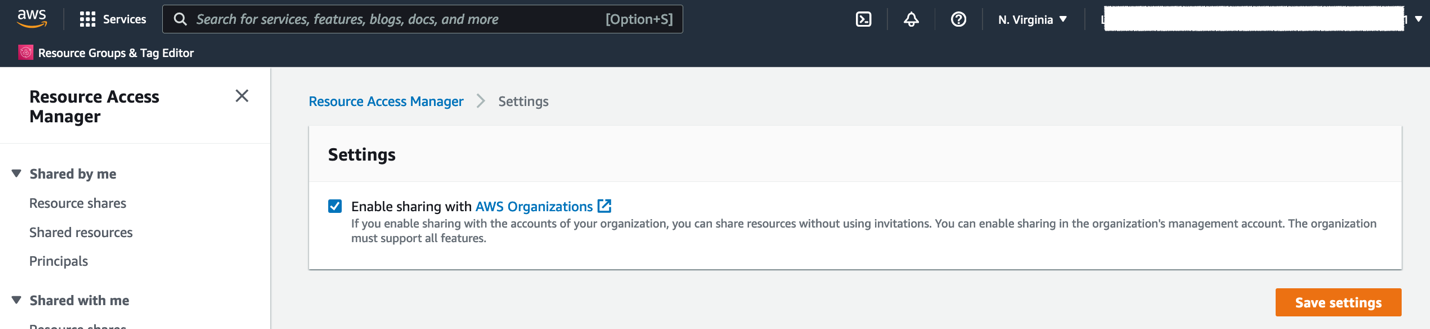
- In the AWS Control Tower management account, go to AWS Firewall Manager console and register your Networking account as Firewall administrator
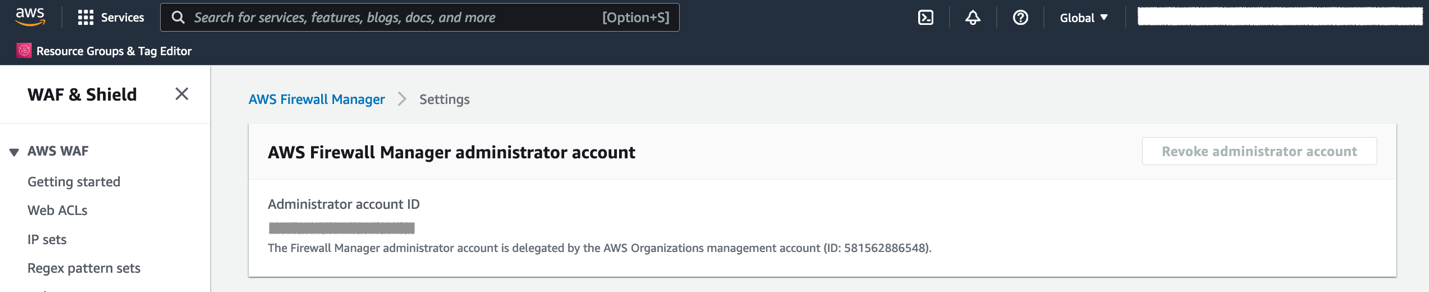
- In the AWS Control Tower management account, use this CloudFormation template to deploy a solution that provides AWS Control Tower integration with AWS Network Firewall and Route 53 DNS Firewall. The CloudFormation stack creation presents with the following screen requiring input parameters for the deployment.
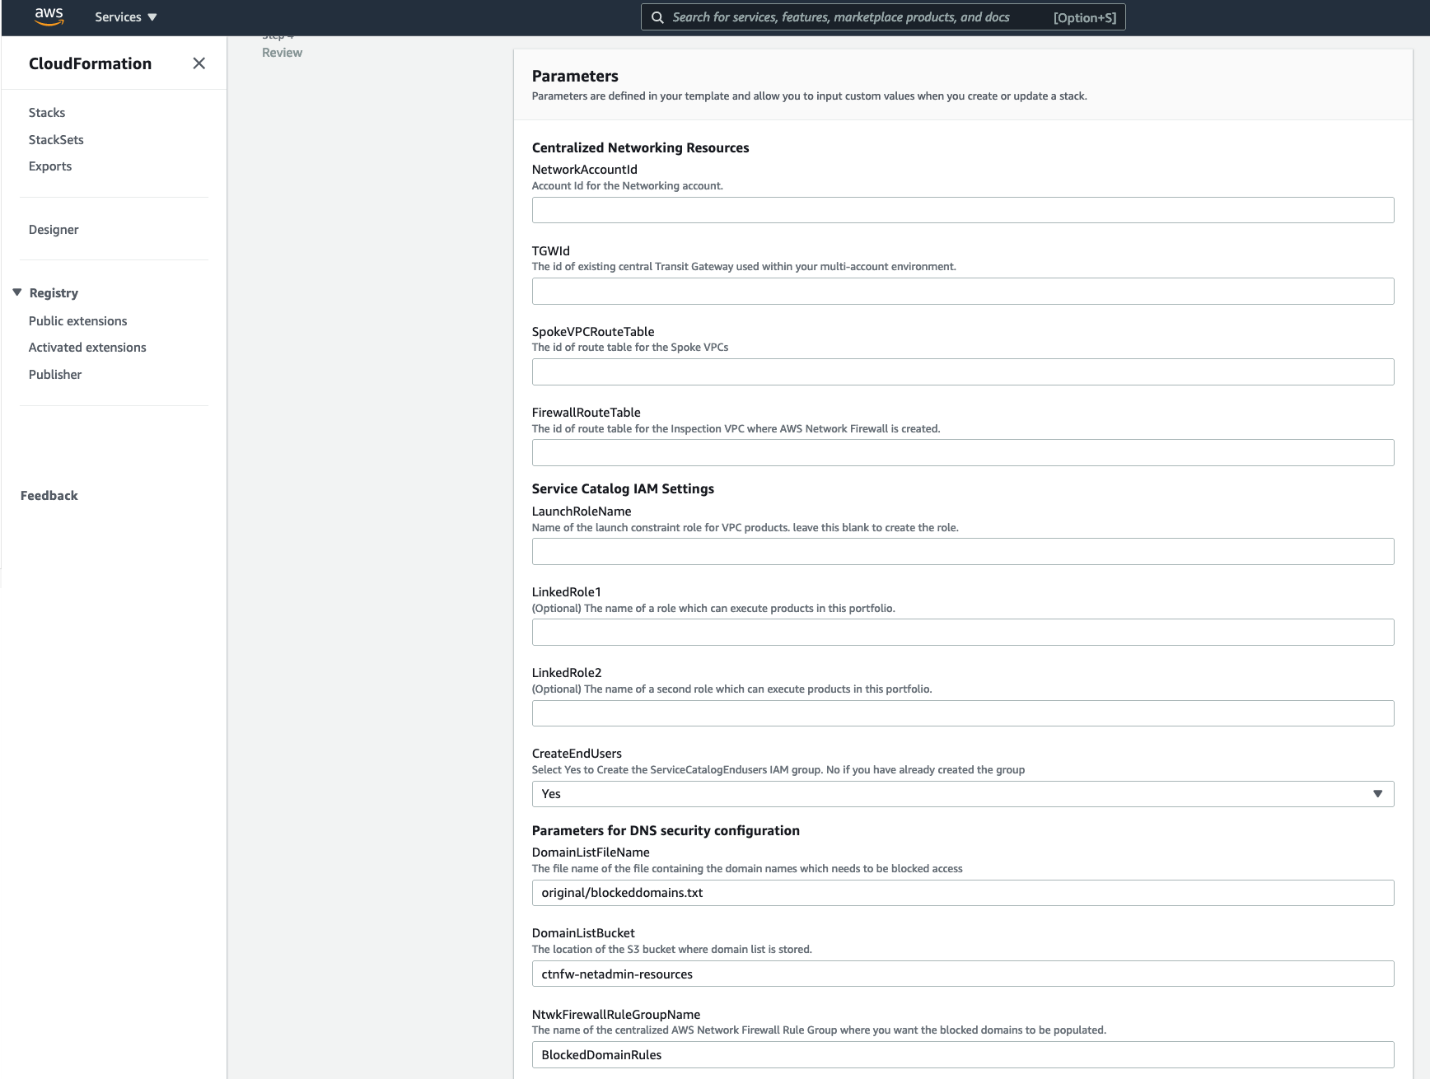
The input parameters required are explained as follows, and shown in the previous figure.
Centralized Networking resources
NetworkingAccountId – AWS Account ID of the networking account in your multi-account environment.
TGWId – Identifier of the centralized transit gateway created in Step 2.
SpokeVPCRouteTable – Identifier of the transit gateway route table used for associating spoke VPCs. This is created in Step 2.
FirewallRouteTable – Identifier of the transit gateway route table to which Inspection VPC is associated. This is created in Step 2.
Service Catalog IAM Settings
LaunchRoleName – This is the name of the service catalog launch constraint role. If you have one in your environment, then you can specify that or leave the field blank. When this is left blank, CloudFormation will create a new one.
LinkedRole1 – Name of the role that can run products in this portfolio.
LinkedRole2 – Name of the role that can run products in this portfolio.
CreateEndUsers – Select Yes to create ServiceCatalogEndUsers IAM group. Select No if you already have this IAM group in your AWS environment.
Parameters for DNS Security configuration
DomainListBucket: The Amazon S3 bucket in Networking account that stores the list of domains to be blocked. Specify the name of the S3 bucket to create.
DomainListFileName: The name of the file that stores the list of domains including the path prefix. The default value is original/blockeddomains.txt. The Amazon S3 trigger relies on the path original/ and the file suffix .txt. The only part of this parameter that supports customization is the file name.
NtwkFirewallRuleGroupName: The name of the network firewall stateful rule group where the domain list will be populated. This rule was created in Step 6.
- After it’s deployed, open the AWS Service Catalog console. Expand Administration, choose Portfolios, and then choose the VPC Reference Architecture portfolio. Share the portfolio with AWS Organizations.
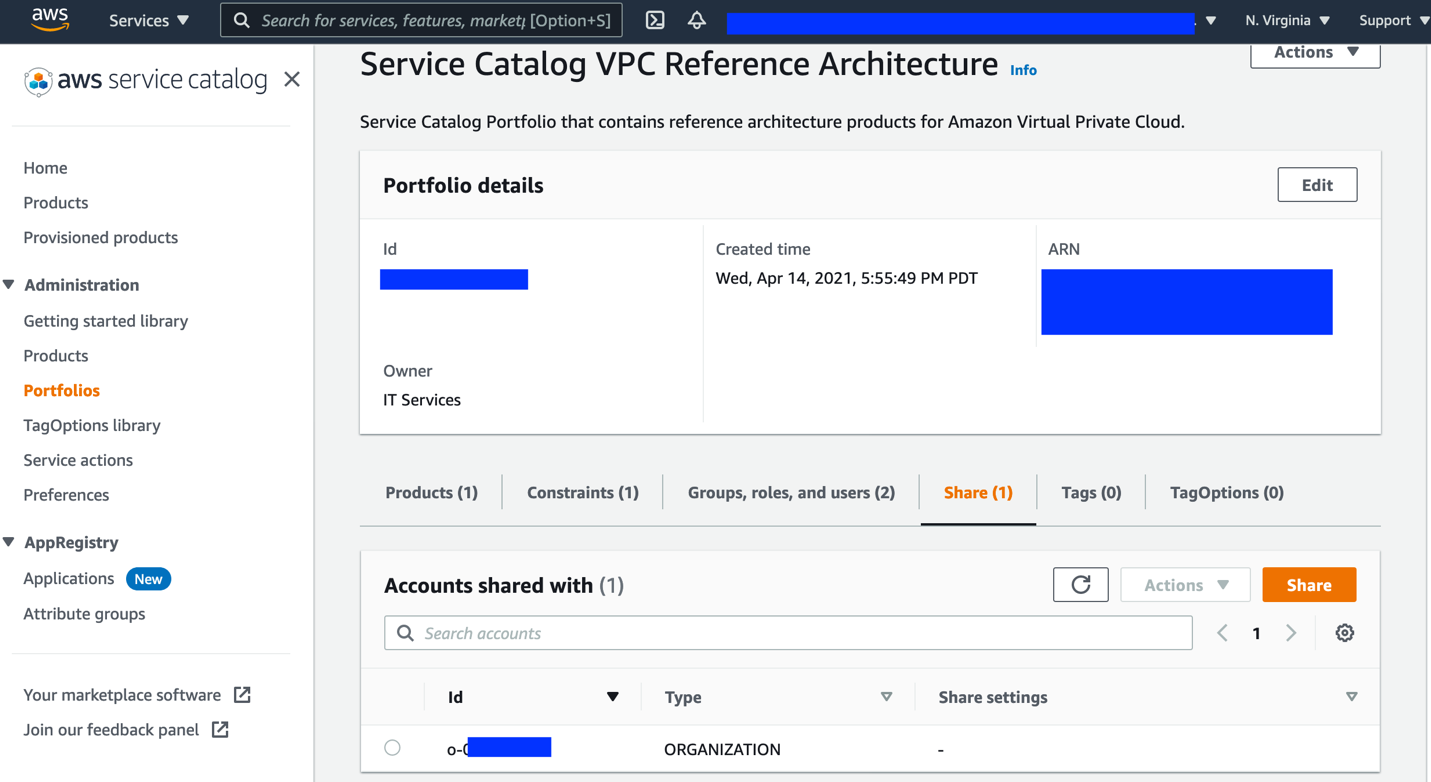
How it works
The following figure shows the sequence of events when the cloud administrator updates the blocked domain list in the Amazon S3 bucket.
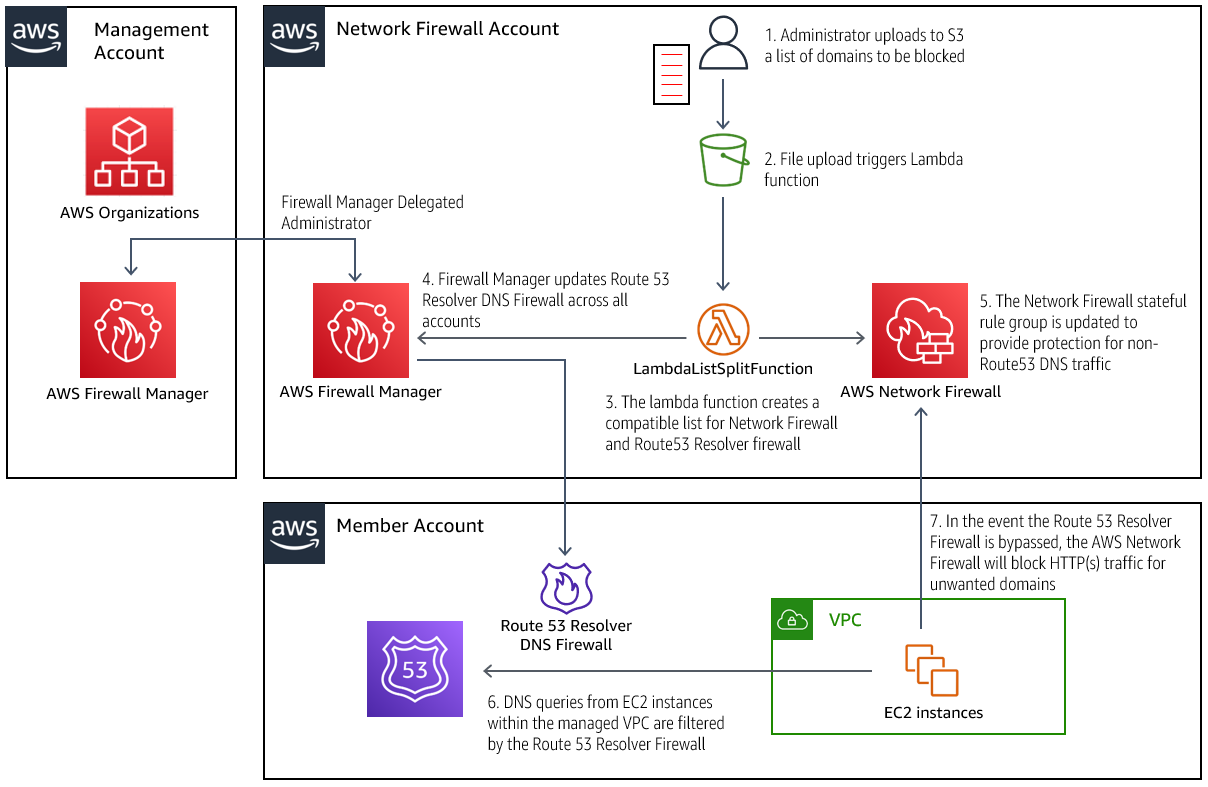
Updating the blocked domain list in Amazon S3
- An administrator adds or removes entries to the .txt file, and uploads it to the bucket specified in the CloudFormation parameter DomainListBucket.
- Entries in the domain list should be formatted one per line, with no prefixes.
Example:
- Example.org
- Example.net
- The Amazon S3 event notification triggers the Lambda function to process the new list.
- The Lambda functions process the list, making it compatible for both the Route 53 Resolver DNS Firewall and the AWS Network Firewall. In addition, the Lambda is configured to automatically block all subdomains of the domains specified in the uploaded list. The Lambda function will also process domains removed from the list, which effectively unblocks access to them.
Processing the blocked domain list
- Firewall Manager updates the Route 53 Resolver DNS Firewall across all of the configured accounts with the new list.
- The AWS Network Firewall policy in the networking account is also updated with the newly configured list.
The new blocked domain list is in effect
- When an instance in a protected VPC performs a DNS query, any domains matched by the Route 53 Resolver Firewall are blocked, and an NXDOMAIN response is returned to the client. Domains not blocked are processed normally.
- If an Amazon Elastic Compute Cloud (EC2) instance is configured to bypass the Route 53 Resolver, the traffic will be routed through the AWS Network Firewall in the networking account, where HTTP and HTTPS traffic to blocked domains will be dropped, as was configured in previous figures associated with Steps 7-8.
Testing the solution
Follow the steps below to test the functionality of domain list blocking in DNS firewall and Network Firewall.
- Create a VPC in a member account using the AWS Service Catalog product. This is the “Backend VPC”.
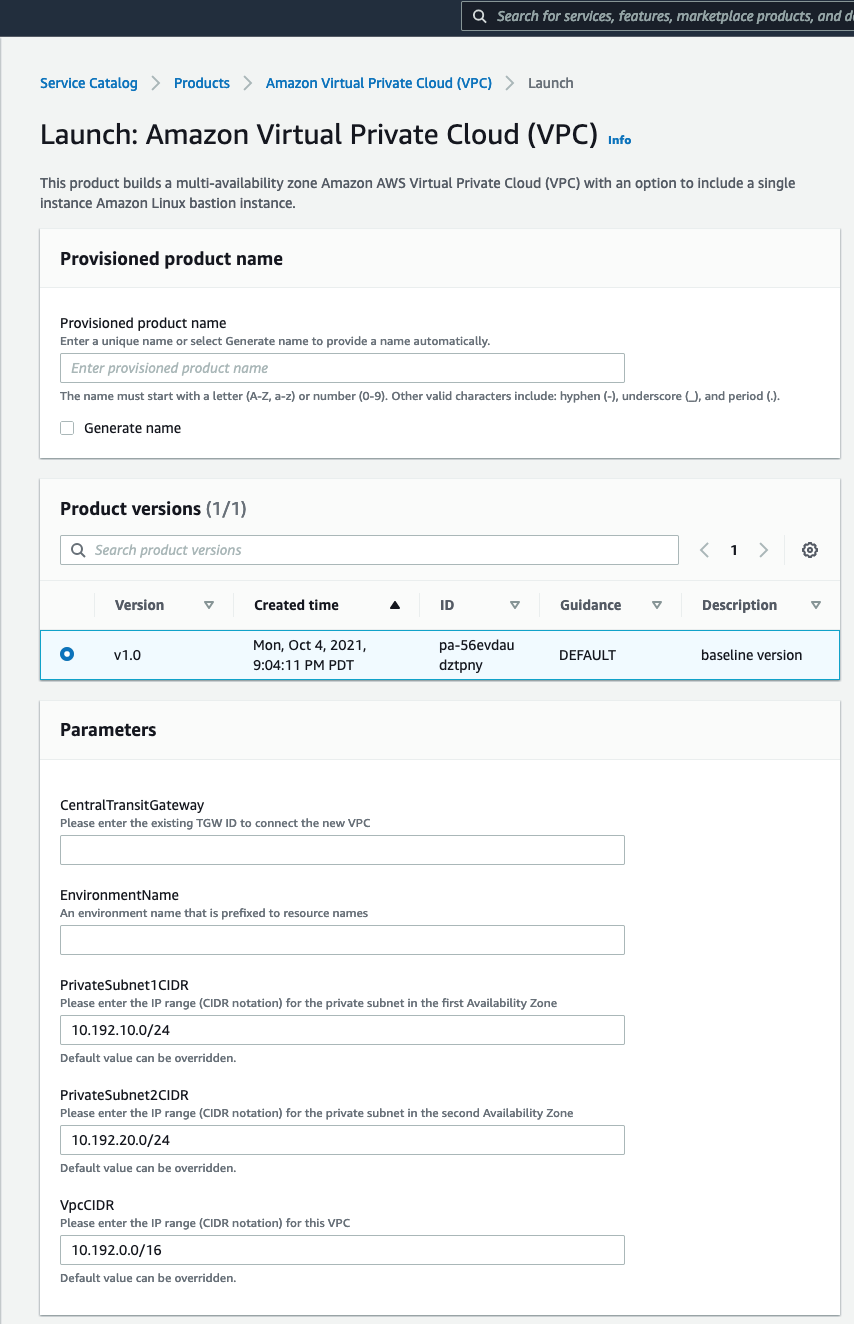
This lets you create a VPC that connects to your centralized transit gateway and with the required route table setup. The VPC CIDR range selected for the Backend VPC must be added to the stateful rule group created earlier. The “Source IP type” parameter in the stateful rule must be changed to “defined”, which will prompt for a list of CIDR ranges. Please see the documentation for more details.
- Create a VPC in the Networking account using the AW Service Catalog product deployed by this solution, similar to Step 1. This is your “Egress VPC”.
- The VPC created above will consist of private subnets. To make this an egress VPC:
- create a public subnet and associate it with the default VPC route table,
- attach an internet gateway to the VPC,
- and then update the default route table to create an entry for 0.0.0.0/0 to the internet gateway. Once this is configured, you have a route out to the internet from your other VPCs connected to the transit gateway via the Egress VPC.
- Launch an EC2 instance in the Backend VPC and set up Session Manager to login to your instance.
- Connect to the instance using Session Manager.
Testing how DNS queries are blocked by the DNS firewall
- Query the domain amazon.com (which is not on the blocked domain list). This query runs successfully.
- When we query a domain Example.org that is blocked, we receive an NXDOMAIN response, as the Route 53 Resolver is configured to respond with.
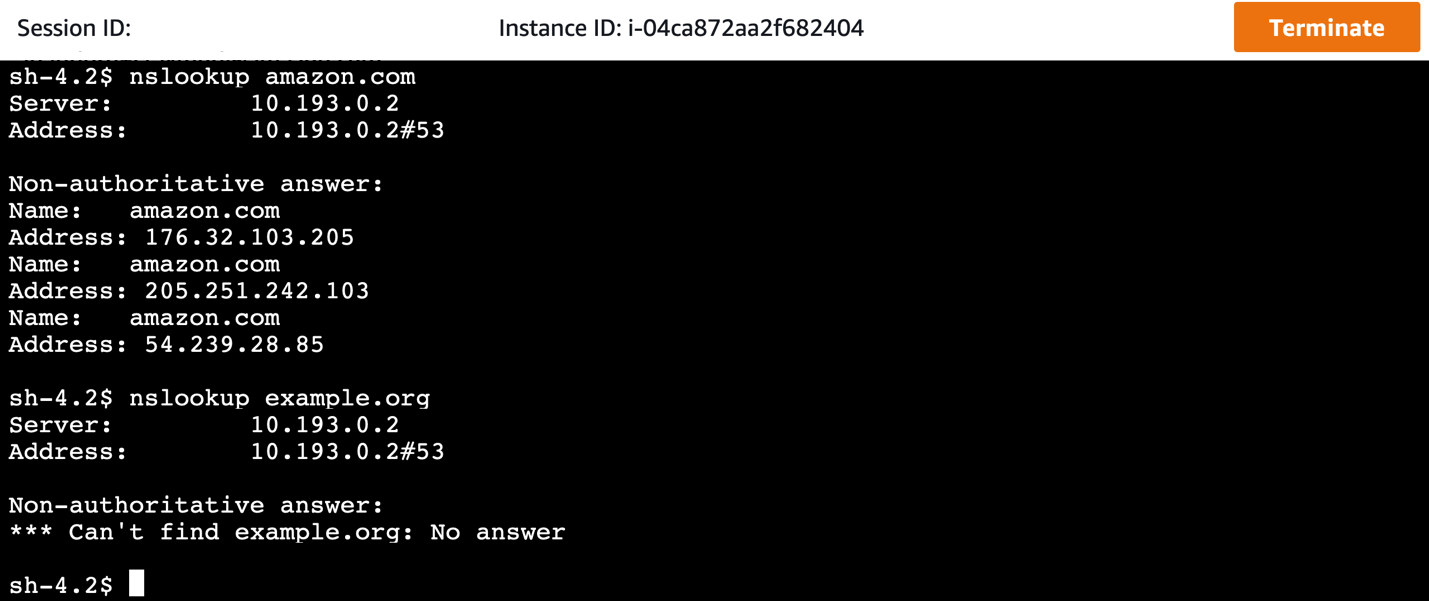
Testing how HTTP(S) traffic to domains is blocked by the Network Firewall
- Invoke a website using cURL, but with the domain resolution done bypassing the DNS firewall. This is done by changing the DNS resolver from our VPC resolver to a public resolver, such as 8.8.8.8. In the Amazon Linux instance, this can be done by modifying /etc/resolv.conf, or by modifying the dhclient.conf file, as explained here.
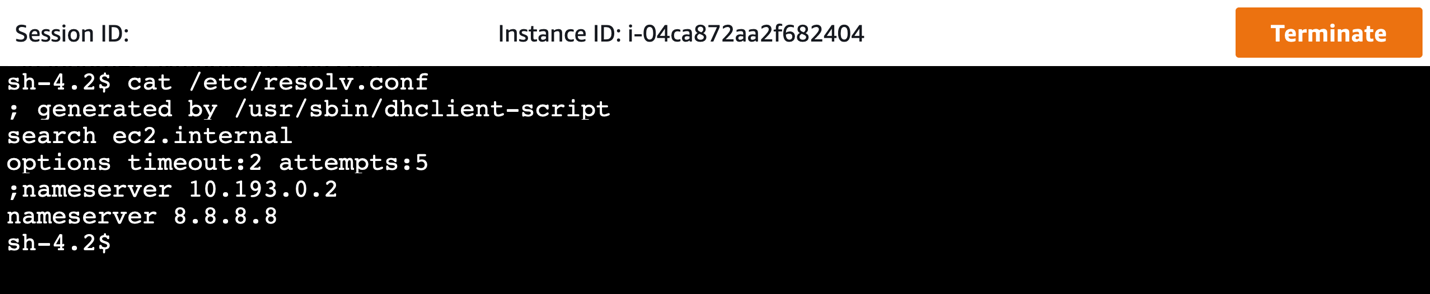
- If this modification is made, domains that are blocked by the Route 53 Resolver DNS Firewall will now resolve. However, all traffic must still route through the centralized network firewall, where HTTP and HTTPS traffic to these domains will be blocked by the configured stateful rule in network firewall.
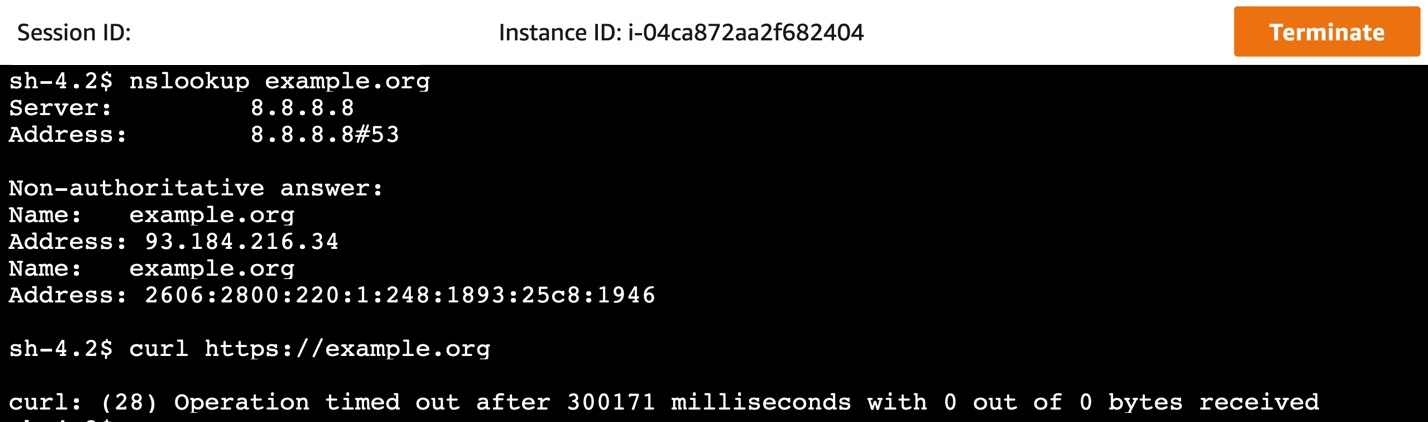
Cleanup
Follow these steps to remove the resources deployed by this solution. These steps will not remove the VPCs created by this solution.
- In the member accounts, remove any VPC products launched through the AWS Service Catalog console.
- In the AWS Control Tower management account, complete the following steps:
- Un-share the AWS Service Catalog portfolio.
- Remove the StackSet instances for the NFW-ControlTower-SCLaunchRoleStackSet stack set.
- Delete the CloudFormation stack that the CloudFormation template deployed for integration with AWS Network Firewall.
- In the AWS Control Tower networking account, delete the CloudFormation stack that was deployed for AWS Network Firewall Deployment Automations for AWS Transit Gateway.
Considerations
It’s important to apply and adapt to the specific requirements of your environment. Consider the following:
If you want to use your own third-party firewalls, use Gateway Load Balancer in the inspection VPC. Additional integration will be needed to apply domain lists to third-party firewalls.
Although this architecture is designed to inspect either North-South or East-West traffic, you can tailor the routing configurations to inspect only the required traffic paths.
Create VPCs using the AWS Service Catalog product. Existing VPCs or VPCs created outside of the AWS Service Catalog are not configured to take advantage of the automation with respect to network traffic security. They will require manual reconfiguration to take advantage of the centralized network firewall. However, these VPCs still get attached to the centralized DNS firewall domain lists and enjoy the benefit of DNS security for queries to the Route 53 resolver.
In addition to Network Firewall and AWS Transit Gateway, this automation uses AWS Lambda, Amazon SNS, Amazon CloudWatch Events, Route 53 Resolver DNS Firewall, Firewall Manager, and AWS Service Catalog, which incur charges. Although the manner in which this solution uses these services keeps the cost to a minimum, you should evaluate the pricing for these services.
Transit Gateway Network Manager sends events to CloudWatch Events in the us-west-2 AWS Region. Make sure that you have not disabled the Region or have service control policies that prevent you from using that Region.
Conclusion
This post shows how you can extend the network security in AWS Control Tower to include securing DNS traffic in your multi-VPC, multi-account environment in a seamless manner. The combination of Network Firewall and Route 53 Resolver DNS Firewall ensures comprehensive network security for the data traffic as well as DNS traffic. Using this solution, you can improve your security posture by addressing network security at multiple layers across multiple accounts in a seamless manner.
Visualize application costs using AWS Service Catalog AppRegistry and Amazon QuickSight
=======================
In a previous blog post, we discussed how AWS Service Catalog AppRegistry lets you create a repository of your applications and associated resources. Then, you can define and manage your application metadata. This lets you understand the context of your applications and resources across your environments. This post will demonstrate how to utilize your application metadata to get a better understanding of your application costs. You will be able to track the cost over time, provide insights about their trends, and make better investment decisions.
Solution overview
Amazon EventBridge is a serverless event bus service that makes it easy to connect your applications with data from various sources. In EventBridge, create rules that define a schedule so that this is a rule triggered regularly on the schedule you specify. This is a great fit for frequently retrieving application metadata, which lets you visualize data and see how it changes over time.
Before data can be visualized, it usually undergoes a transformation process where data can be enriched and structured into a format that is optimal for a visualization tool. AWS Step Functions lets you create and coordinate individual tasks into a flexible workflow. Step Functions include built-in error handling, parameter passing, recommended security settings, and state management. This reduces the amount of code you must write and maintain.
After the data is transformed and uploaded into a data store, it can be visualized. Amazon QuickSight is a cloud-scale business intelligence (BI) service that you can utilize to deliver easy-to-understand insights. QuickSight connects to your data in the cloud and combines data from many different sources. In a single data dashboard, QuickSight can include AWS data, third-party data, big data, spreadsheet data, SaaS data, B2B data, and more. As a fully managed cloud-based service, Amazon QuickSight provides enterprise-grade security, global availability, and built-in redundancy. Furthermore, it provides the user-management tools you need to scale, all without any infrastructure to deploy or manage.
Figure 1 illustrates the flow for retrieving the metadata from your applications, processing it, and visualizing it in QuickSight.
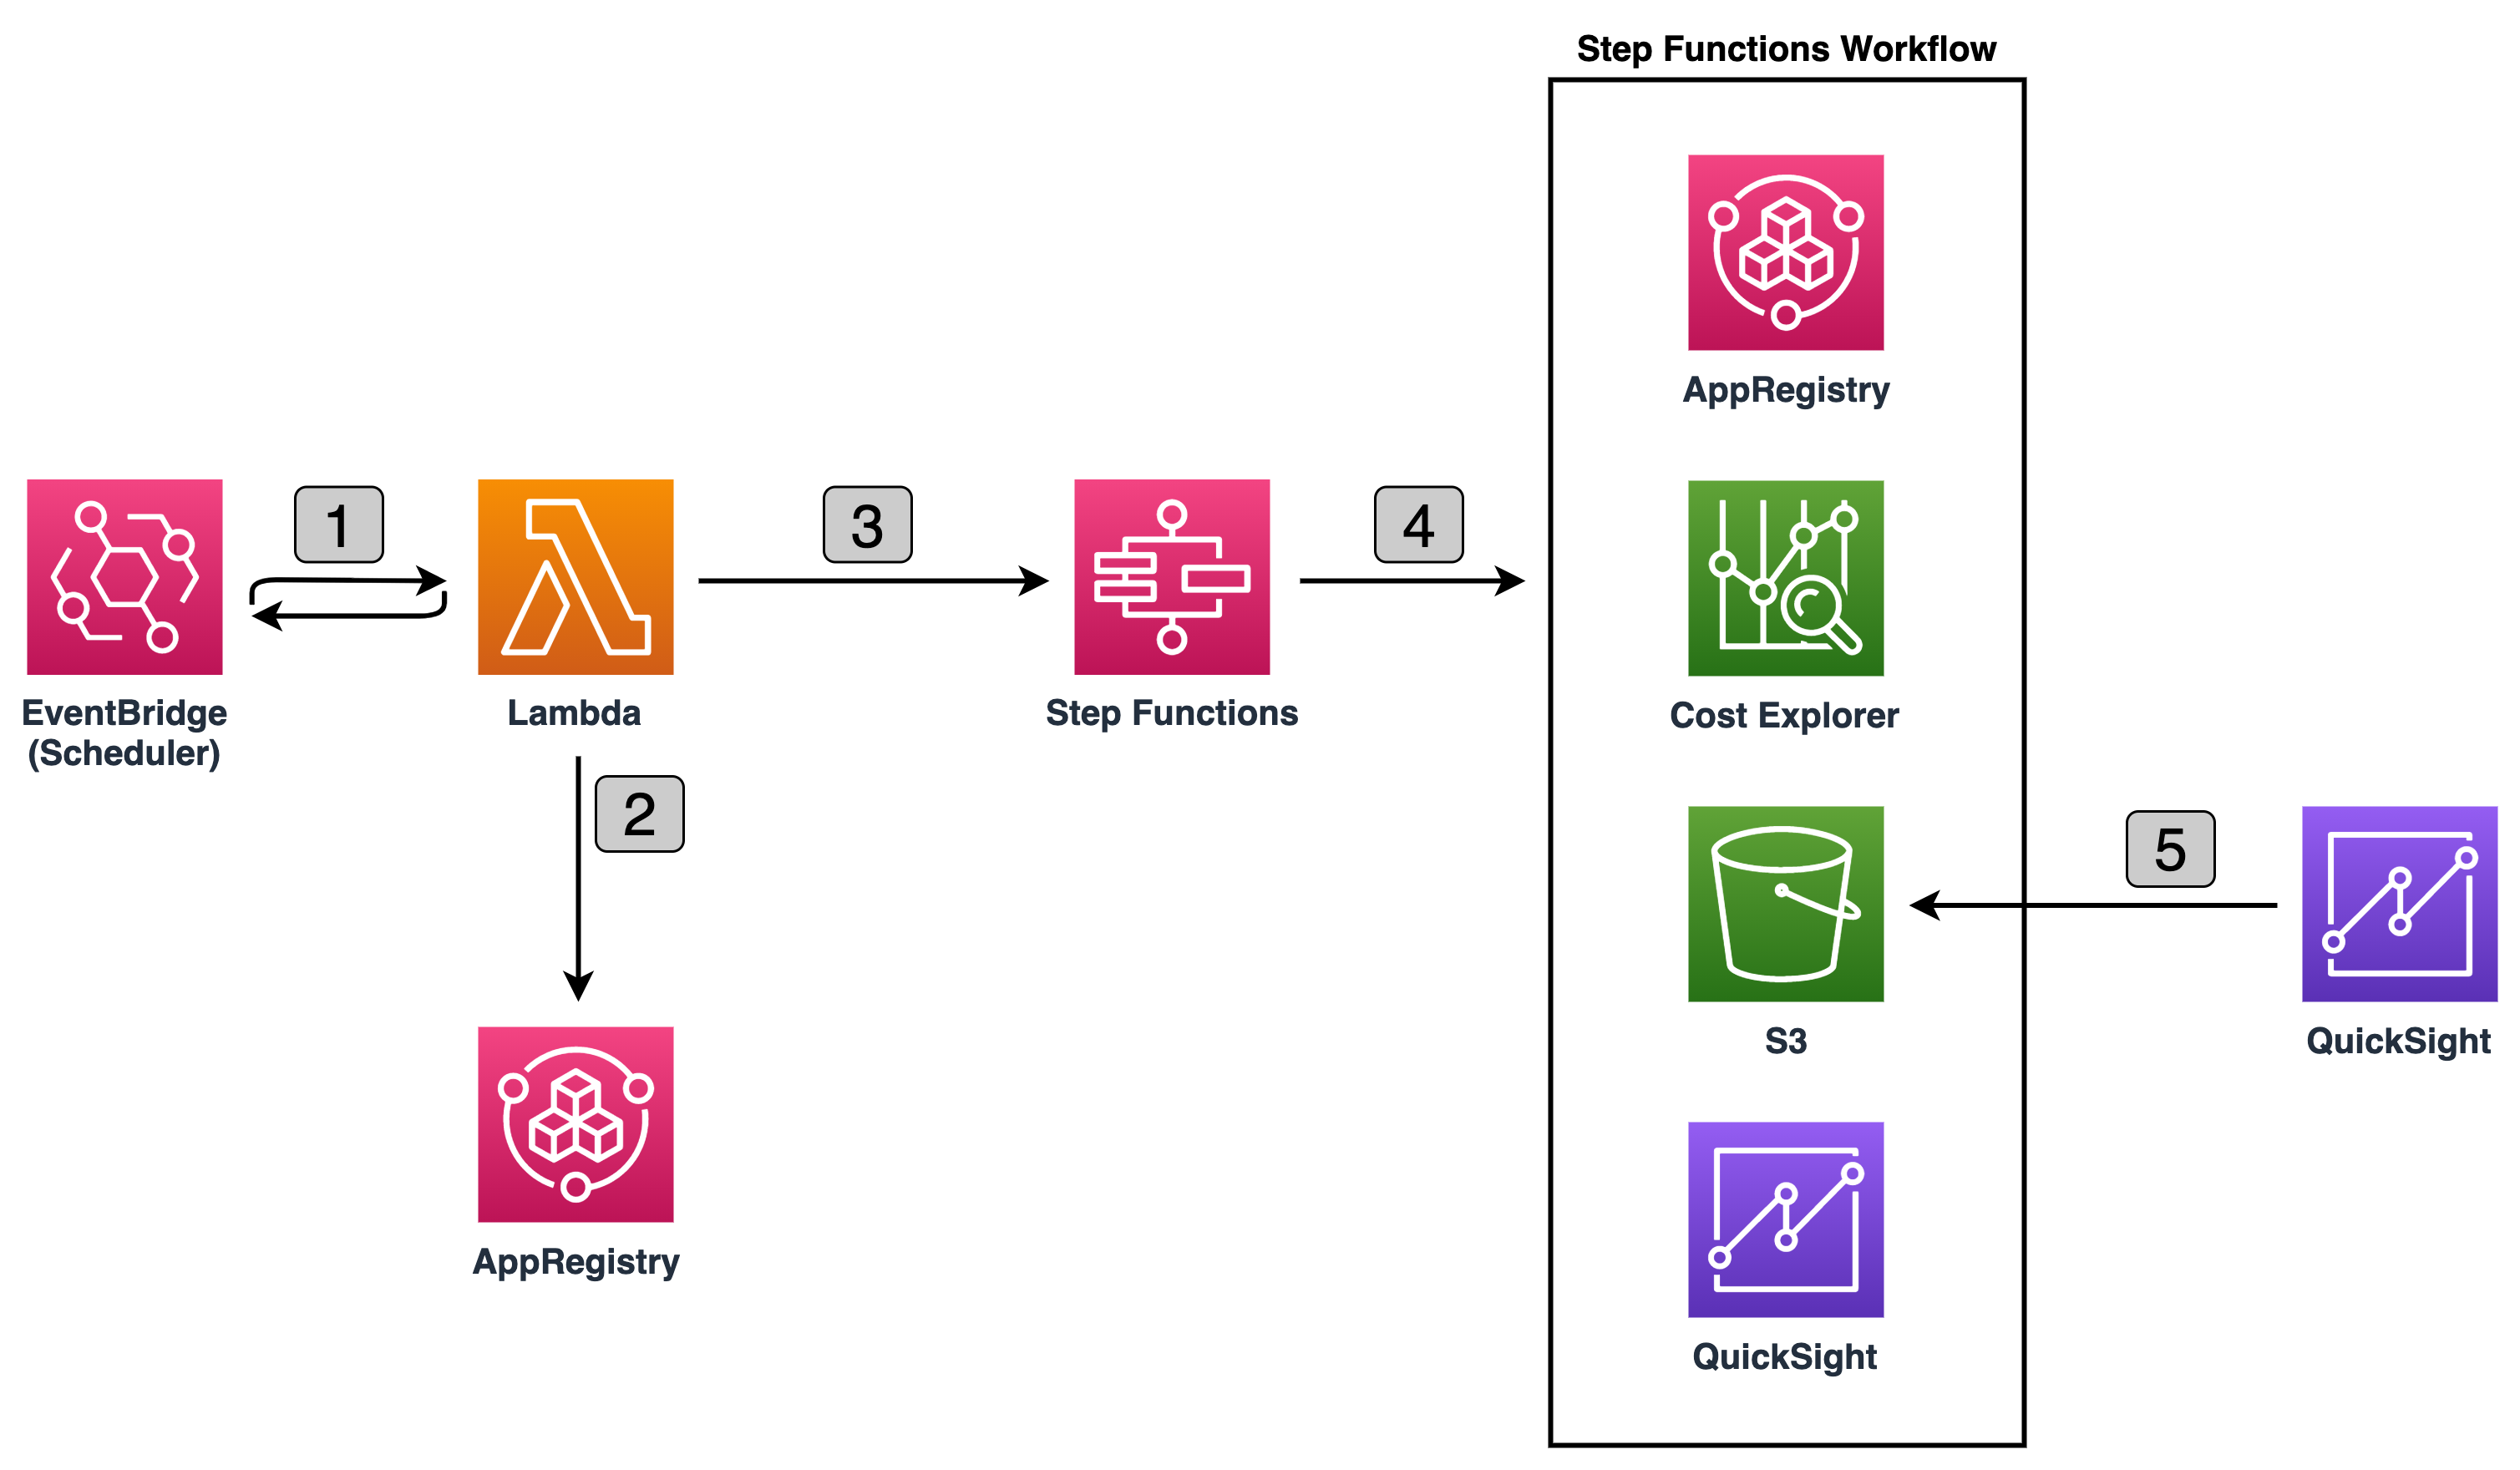
Figure 1: Retrieving, processing, and visualizing application metadata
Let’s go through the flow to understand what happens at each step, as shown in Figure 1:
On a defined scheduled interval, EventBridge invokes AWS Lambda Function.
Lambda Function retrieves all existing applications and corresponding associated AWS CloudFormation resources and attribute groups names, and invokes the Step Function passing this data as input.
Step Function Workflow processes each applications metadata one at a time. It utilizes AWS Cost Explorer to retrieve costs for each CloudFormation stack associated with the application. Next, it retrieves metadata information from each attribute group. Then, it formats the data and uploads it to an Amazon Simple Storage Service (Amazon S3) bucket. Lastly, it notifies QuickSight to pull the latest data from Amazon S3.
QuickSight refreshes the dataset and updates the dashboards.
Visualizing the AppRegistry applications
Let’s assume the scheduler in EventBridge is configured to trigger the Lambda function daily, and you have one AppRegistry application with one CloudFormation stack and one attribute group associated with the application. Let’s also assume that the attribute group stores the following metadata:
# Example AttributeGroup
{
"ApplicationID": "123456",
"ApplicationName": "Search Recommendation Service",
"CostCenter": "87",
"Costs": [
{
"Name": "Relational DB",
"Cost": 1385.55
}
],
...
}
When the Step Functions Workflow starts the execution, it collects the information about the application, as well as:
queries the Cost Explorer to identify the daily cost of the CloudFormation Stack,
queries the attribute group to identify other costs associated with this application that run outside the AWS environment,
and uploads the identified information to S3, then QuickSight pulls new data and uploads to the Dashboard.
This process is repeated every day, and your dashboards begin building up over time. As time progresses and you continue to utilize AppRegistry as the repository of your applications and associated resources, you can start to answer some of the most common question about your application costs, such as:
What are the total costs of all of my applications over the past six months?
How did the costs of my applications change over the last six months?
What are the costs of specific applications over last three months, and which application component is most expensive?
A QuickSight dashboard is a read-only snapshot of an analysis that you can share with other Amazon QuickSight users. A dashboard preserves the analysis configuration at the time that you publish it, including things such as filtering, parameters, controls, and sort order.
To answer the first question, create a Donut chart, grouping by application name and costs, and filtering by time period. Figure 2 illustrates an example Donut chart.
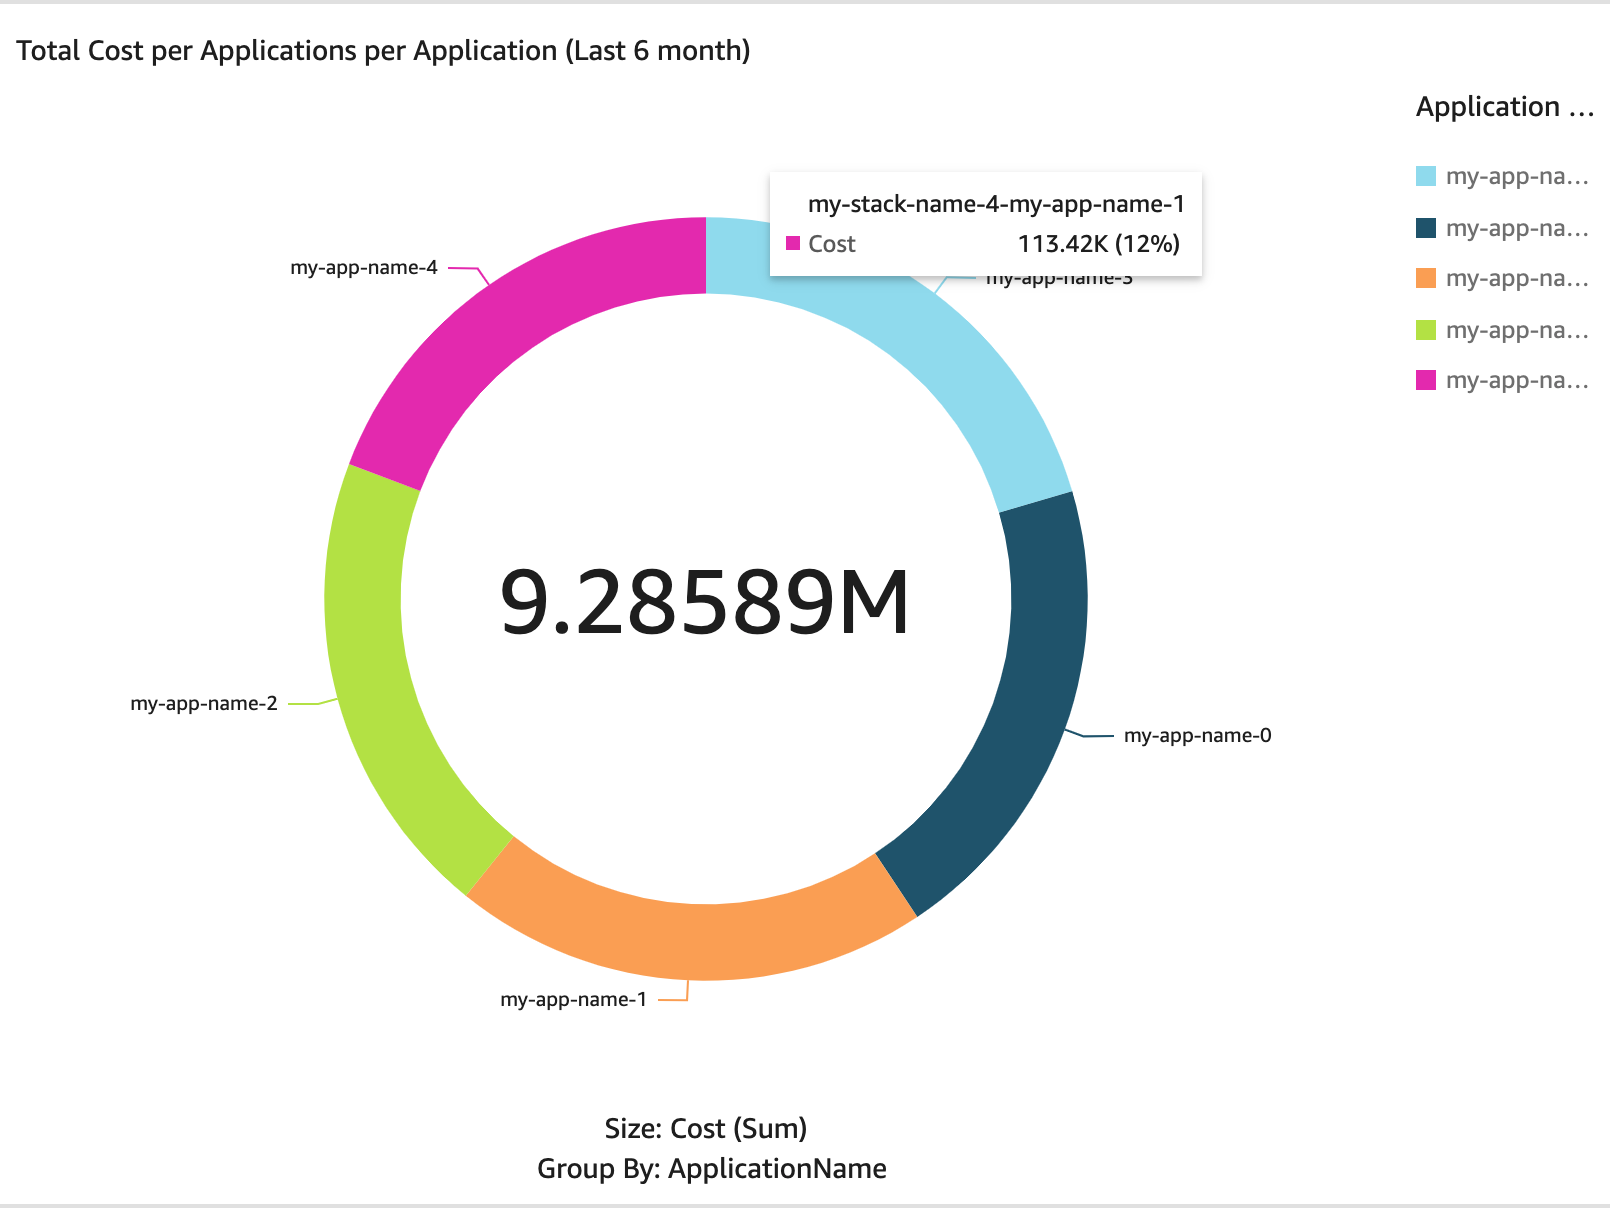
Figure 2: Donut chart – total costs of all applications per application over last six months
To answer the second question, create an Area line chart, grouping by costs and date and filtering by time period. Figure 3 illustrates an example Area line chart.
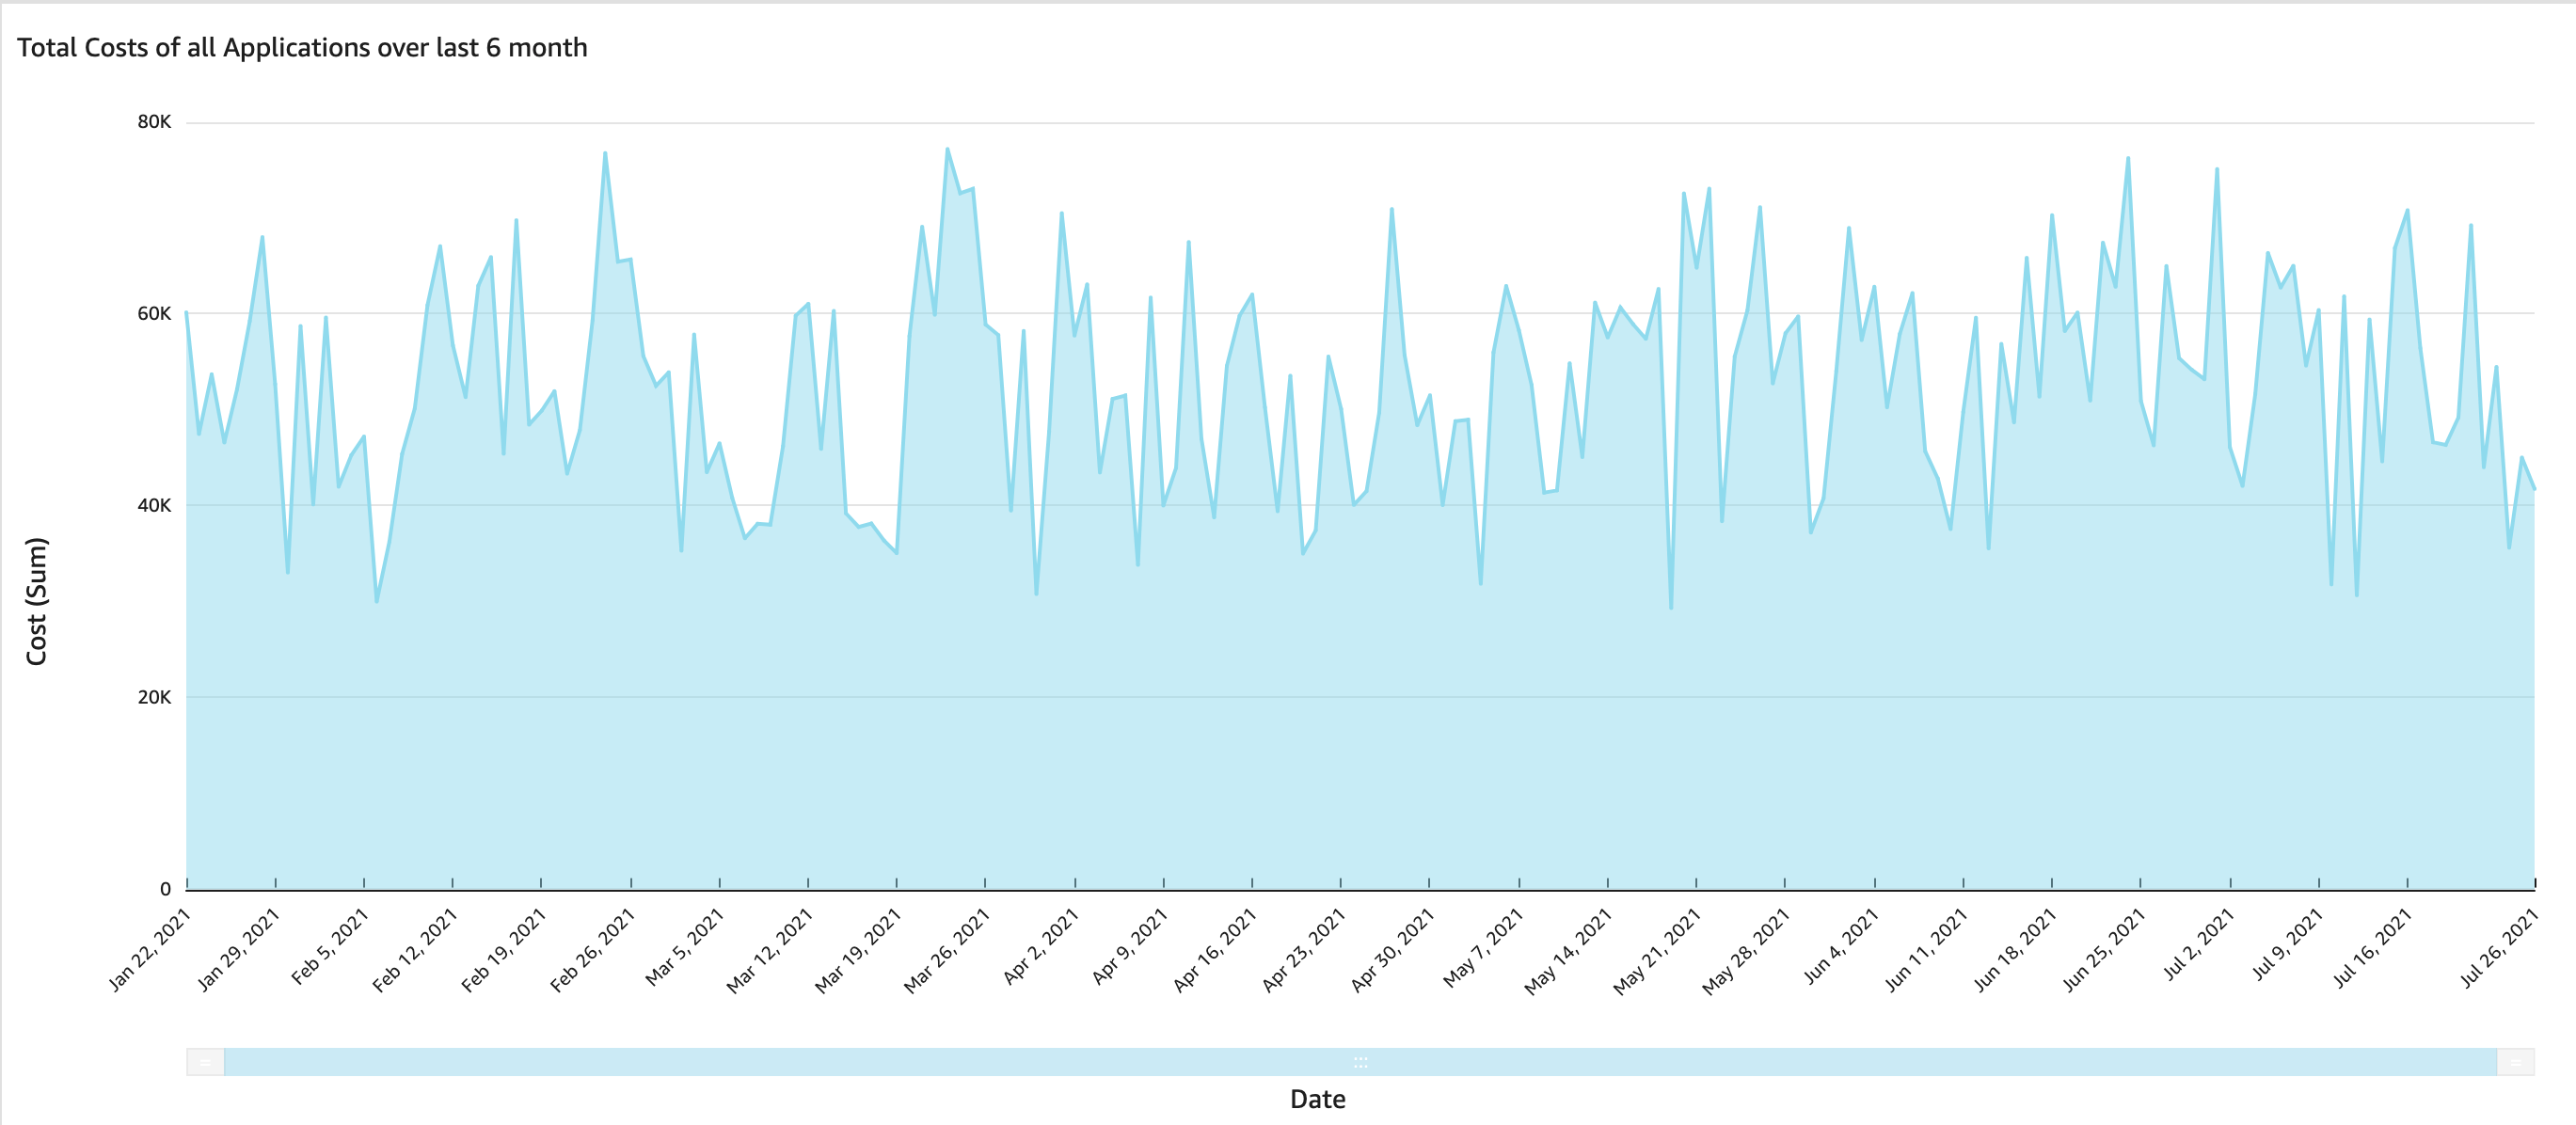
Figure 3: Area line chart – total costs of all applications over last six months
To answer the third question, create a Pie chart, grouping by resource and costs and filtering by time period. Figure 4 illustrates an example Pie chart.
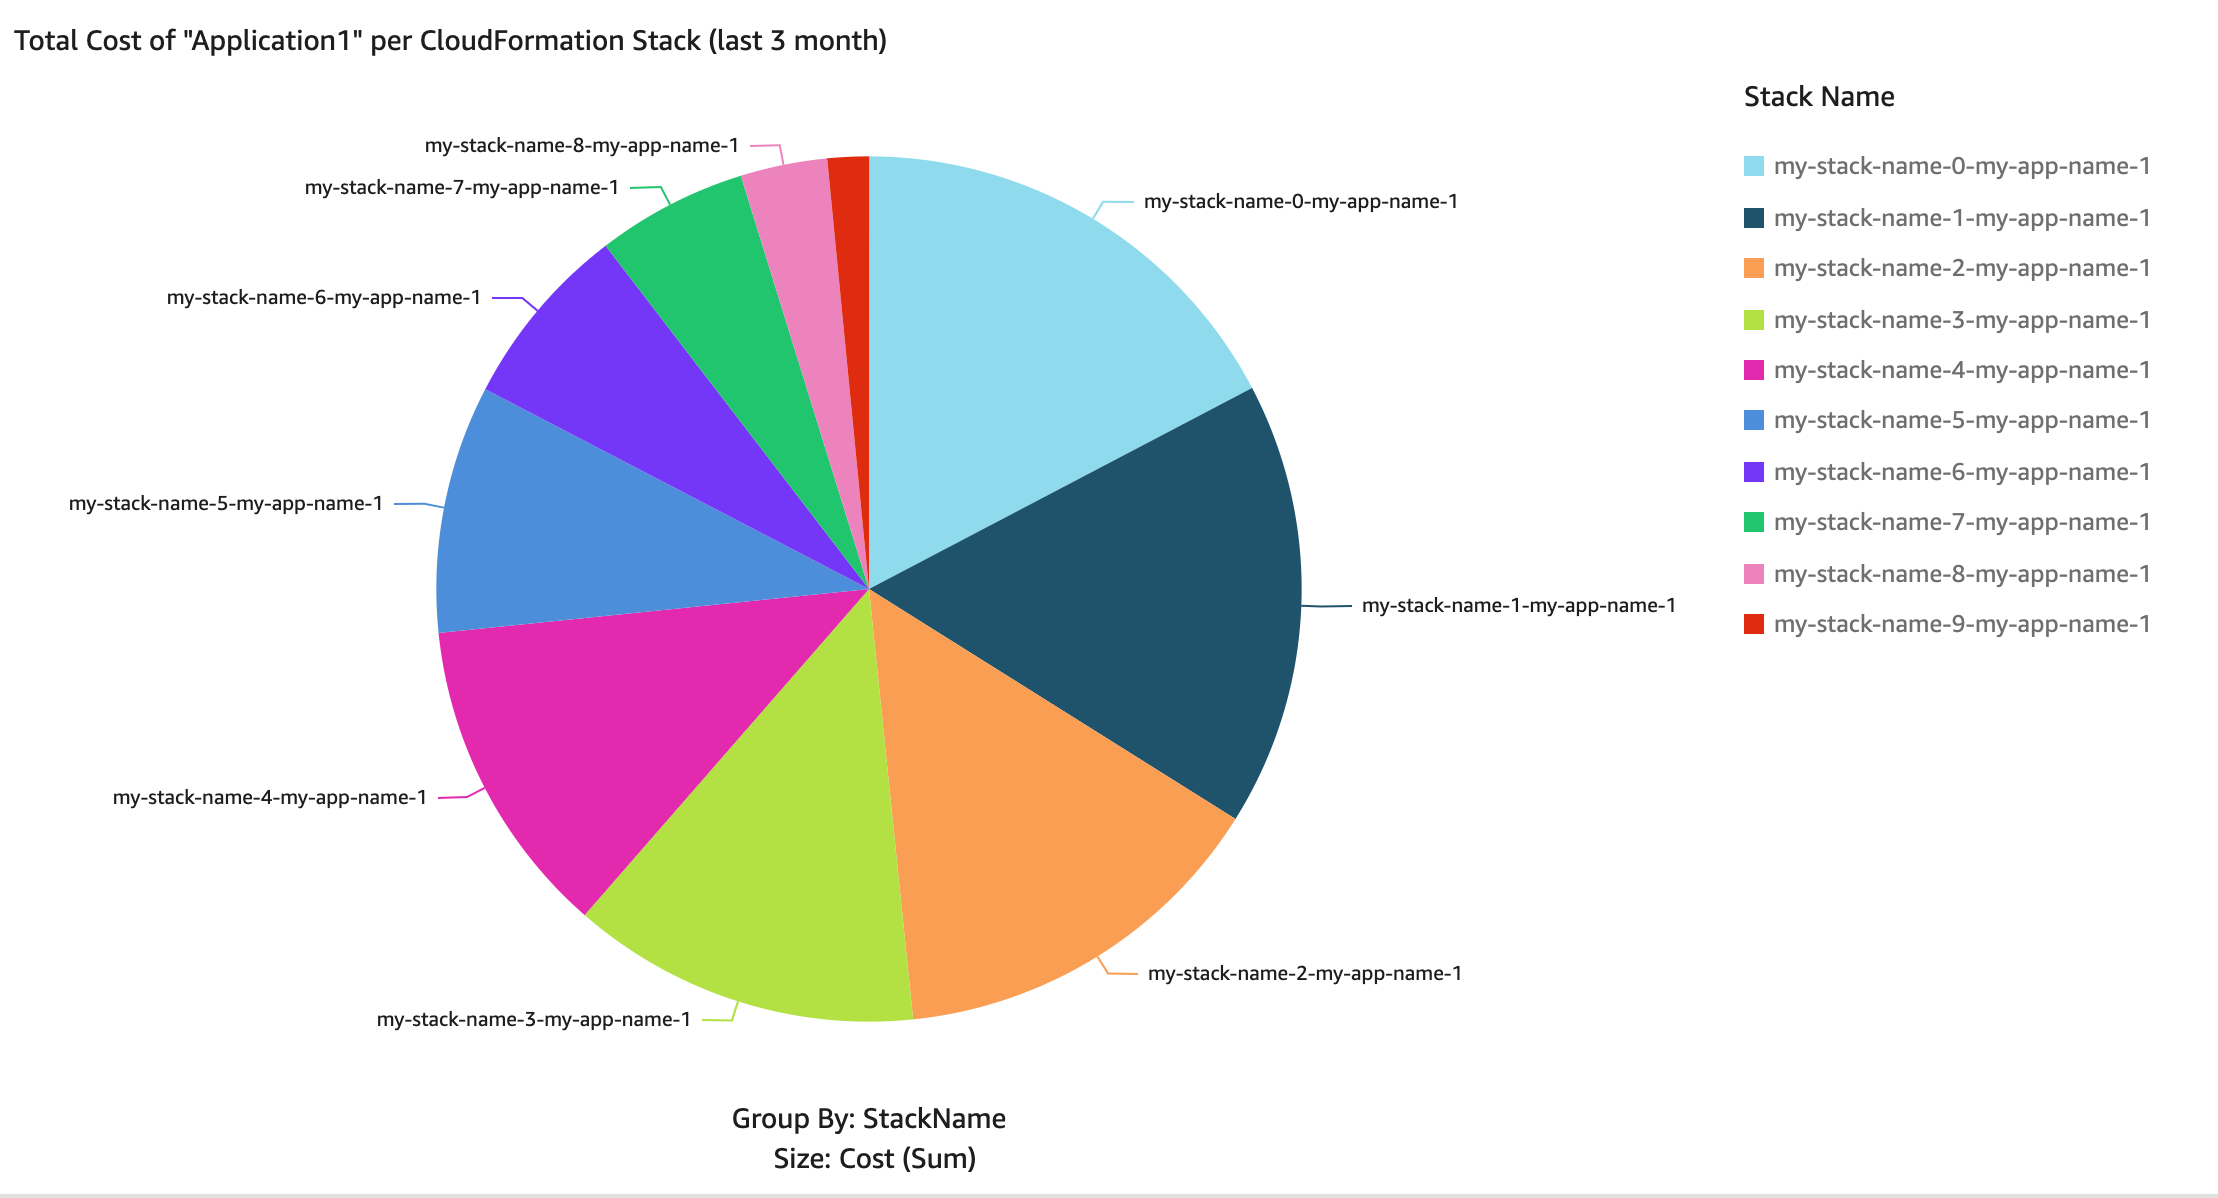
Figure 4: Pie chart – total costs of Applications per Resource over the last three months
Prerequisites
For this solution, you need the following prerequisites:
Cost Explorer cost allocation tag aws:cloudformation:stack-id is activated in the Root account. To active this tag, follow the guide Activating the AWS-Generated Cost Allocation Tags.
Note: It can take up to 24 hours for tags to activate.
An existing S3 bucket where data will be stored and utilized by QuickSight to upload data and be used by visuals.
You’re signed up for a QuickSight Standard or Enterprise subscription. To sign up, follow the guide Signing Up for an Amazon QuickSight Subscription.
QuickSight has read permissions to the S3 bucket that is the data source. To grant QuickSight with read permissions to the S3 bucket, follow the guide authorize Amazon QuickSight to access your Amazon S3 bucket.
Free SPICE capacity in the Region where QuickSight resources are deployed. To learn more about your current SPICE capacity, and how to add additional capacity, see Viewing SPICE Capacity and Usage in an AWS Region and Purchasing SPICE Capacity in an AWS Region.
AWS Region in which QuickSight is offered. To find out which Regions offer QuickSight, see AWS Regional Services List.
Implementation and deployment details
In this section, you create a CloudFormation stack that creates AWS resources for this solution. Next, you create a QuickSight analysis and publish the QuickSight dashboard, To start the deployment process, select the following Launch Stack button.
Note: If your AWS account has a QuickSight enterprise subscription, then you can skip the steps below to create an analysis and publish the dashboard, which are created as part of the CloudFormation stack deployment.

.
You also can download the CloudFormation template if you want to modify the code before the deployment.
The template in Figure 3 takes several parameters. Let’s go over the key parameters.
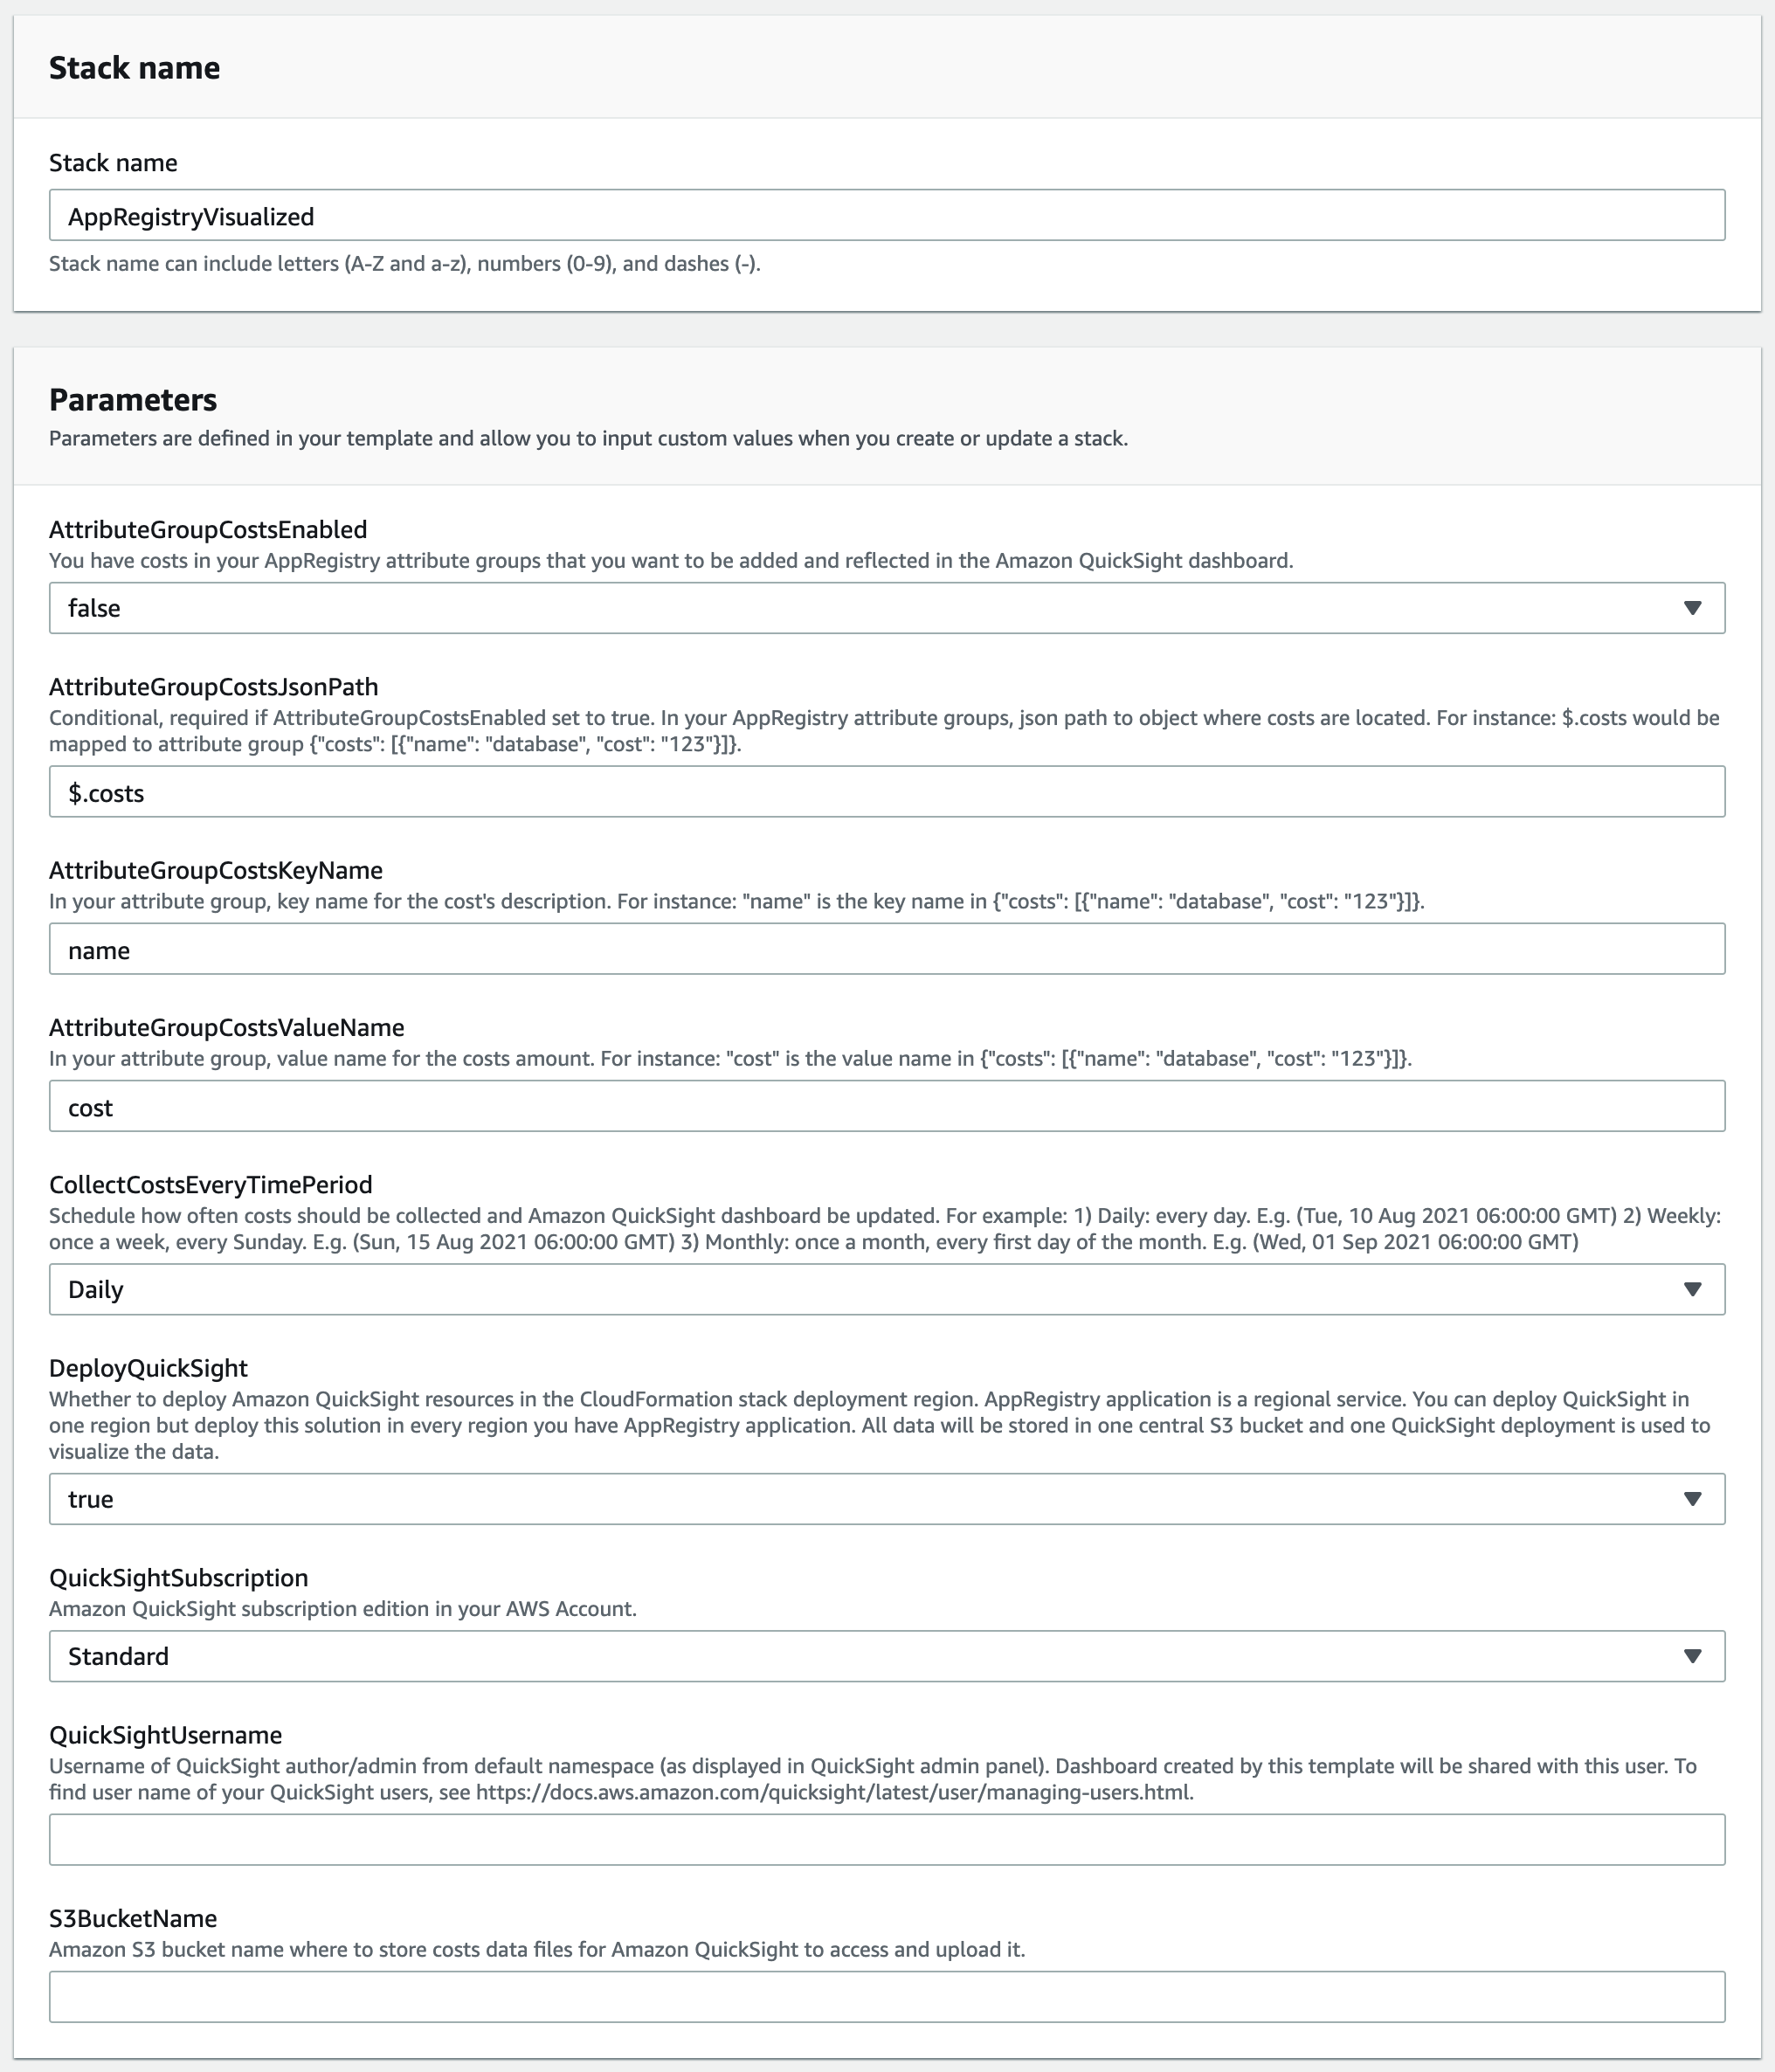
Figure 5: CloudFormation stack parameters
The key parameters are:
AttributeGroupCostsEnabled: You have costs in your AppRegistry attribute groups that you want to be added and reflected in the Amazon QuickSight dashboard.
DeployQuickSight: Whether or not to deploy Amazon QuickSight resources in the CloudFormation stack deployment Region. AppRegistry application is a Regional service. You can deploy QuickSight in one Region but deploy this solution in every Region where you have the AppRegistry application. All data will be stored in one central S3 bucket and one QuickSight deployment is utilized to visualize the data.
QuickSightSubscription: Amazon QuickSight subscription edition in your AWS Account.
QuickSightUsername: User name of QuickSight author/admin from default namespace (as displayed in QuickSight admin panel). Dashboard created by this template will be shared with this user. To find the user names of your QuickSight users, see Managing User Access Inside Amazon QuickSight.
S3BucketName: Amazon S3 bucket name where to store costs data files for Amazon QuickSight to access and upload it.
All other input fields have default values that you can either accept or override. Once you provide the parameter input values and reach the final screen, choose Create stack to deploy the CloudFormation stack.
This template creates several resources in your AWS account, as follows:
EventBridge rule that triggers Lambda function to collect information about current AppRegistry applications.
Lambda functions to collect, process, and store AppRegistry applications information and associated costs, as well as store this information in an S3 bucket.
Step Function Workflow that starts the flow of processing the information by using Lambda functions.
QuickSight resources connecting to the S3 bucket that you specified in the S3BucketName CloudFormation Template parameter as the data source.
Creating QuickSight analysis
Now that the CloudFormation stack is successfully deployed, create an analysis where you create the charts. Follow the steps to create a new analysis:
Navigate to the QuickSight analysis view, and click New analysis.
Select the AppRegistryVisualizedS3 dataset
Click the Create analysis button
Next, create the three visuals as shown above in Figures 2, 3, and 4. If you don’t have any AppRegistry applications at this point, then those visuals don’t show any data, as shown in Figure 6 below. However, overtime every time the scheduler is triggered, QuickSight will pull new data and start showing data in your visuals.
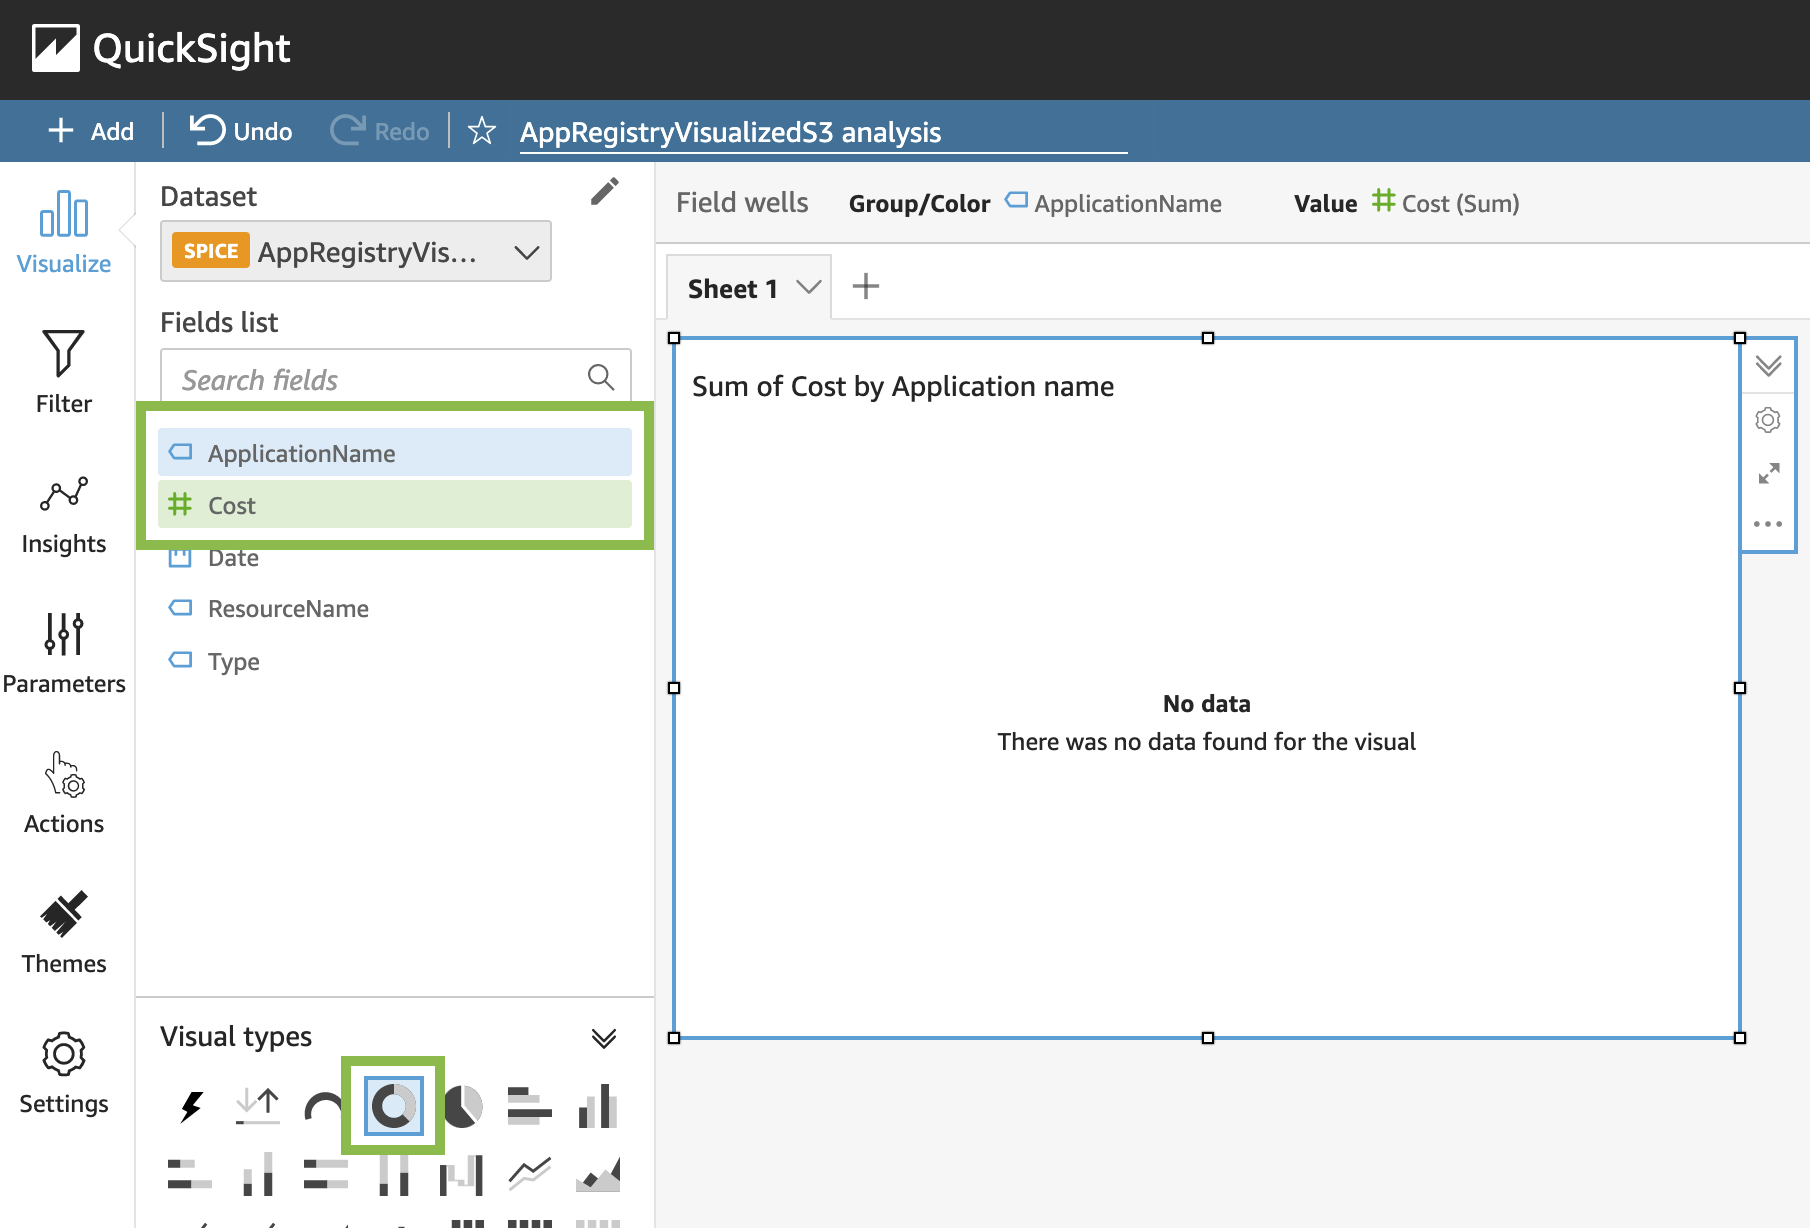
Figure 6: Creating donut chart – total costs of all applications per application
To create a visual showing the total costs of all AppRegistry applications per application:
In Fields list, select ApplicationName and Cost
In Visual types, select Donut chart
To create a visual showing the total costs of all applications over time, first click the empty sheet area to deselect the current visual, then:
In Fields list, select Cost and Date
In Visual types, select Area line chart
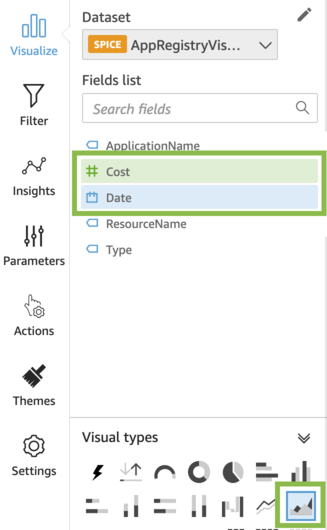
Figure 7: Creating area line chart – total costs of all applications over time
To create a visual showing the total costs of a specific application per resource, deselect the current visual and:
In Fields list, select Cost and ResourceName
In Visual types, select Pie chart
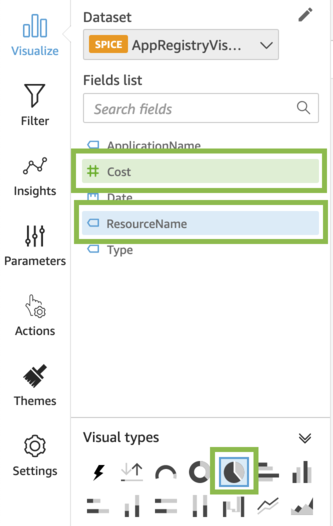
Figure 8: Creating pie chart – total costs of all applications per resource
Publishing QuickSight dashboard
In your QuickSight analysis, you now have three visuals. As a final step, publish a dashboard from this analysis. To publish a dashboard:
Click Share, and select Publish dashboard
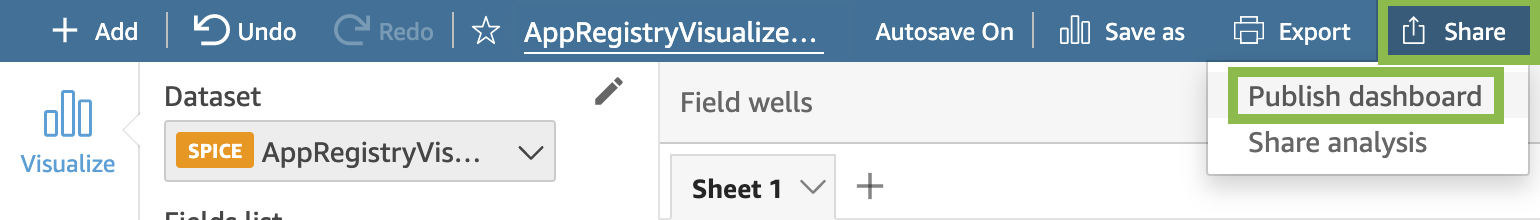
Figure 9: Analysis view – Publish QuickSight dashboard
In Publish new dashboard as, enter a name for your dashboard
Click Publish dashboard
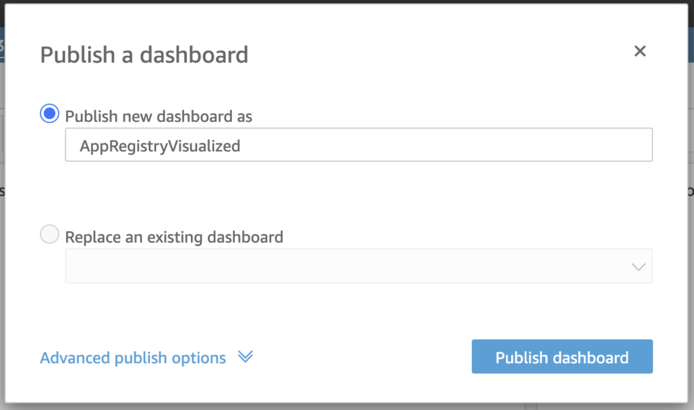
Figure 10: Publishing QuickSight dashboard
(Optional) Share the dashboard with specific users or everyone in your account
Every time the scheduler triggers the process, a new AppRegistry applications data is collected, stored in an S3 bucket, and the QuickSight dashboard is automatically refreshed and reflects the latest data. When you share a dashboard, you specify which users have access to it. Users who are dashboard viewers can view and filter the dashboard data. Any selections to filters, controls, or sorting that users apply while viewing the dashboard exist only while the user is viewing the dashboard. These aren’t saved once it’s closed. Users who are dashboard owners can edit and share the dashboard. To learn more about QuickSight dashboards, see Working with Dashboards.
Applying filters to QuickSight visuals
Utilize filters to refine the data displayed in a visual. By default, a filter applies only to the item selected when the filter was created. Set the scope of a filter to one or more visualizations. If you need to, you can change the scope of a filter after you create it.
By using filters, you can create visuals that will, for example, show the costs over the last N month, or filter the overall costs to costs of a specific AppRegistry application. To learn more about how to create and manage filters, see Filtering Data.
Clean up
To avoid incurring future charges, make sure to remove the resources you created when you’re done using them.
Conclusion
This post demonstrated how to visualize your applications in AWS using AppRegisty, helping you track applications costs over time, understand the context of your applications and resources across your environments. EventBridge helped you schedule the data collection and QuickSight created the dashboard with several analyses. You can use QuickSight or any other data visualization dashboard to track cost and make decisions on logical groups of AWS services, driving better control and visibility across your organization.
Monitoring AWS Elastic Beanstalk .NET applications with Amazon CloudWatch and Amazon Managed Grafana
=======================
AWS Elastic Beanstalk simplifies deployments by handling many of the architectural complexities involved with managing highly available applications. Elastic Beanstalk provides a monitoring console that displays your environment’s status and application health. However, in large deployments with complex application servers, this often requires supplemental, finer grained monitoring and dynamic dashboards in order to achieve the desired operational insights. Amazon CloudWatch can be utilized to supplement the Elastic Beanstalk enhanced health monitoring, while Amazon Managed Grafana can provide dynamic visualizations for metrics and logs. Amazon Managed Grafana lets you analyze your metrics, logs, and traces without having to provision servers, configure and update software, or do the heavy lifting involved in securing and scaling Grafana in production.
This post provides step-by-step instructions for monitoring your Elastic Beanstalk resources. The solution uses a combination of the Elastic Beanstalk health agent, for enhanced health metrics and common log files, and the CloudWatch agent, for system and process level metrics and custom log files. We also provide instructions for creating Grafana dashboards. For setting up your Amazon Managed Grafana environment in this blog post, check Amazon Managed Grafana – Getting Started.
Overview of solution
Elastic Beanstalk monitors environments by using a built-in health agent and autoscaling health checks. When an application is unhealthy, the instance can be shut down and autoscaling can create a new one. But some complex .NET application servers require lengthy startup times. In addition, many .NET application servers run with multiple application pools on a single instance and require additional monitoring. The CloudWatch agent lets you monitor instance level metrics, such as memory and active server page metrics, as well as process level metrics important for determining application pool health.
Applications may also be deployed across many Elastic Beanstalk environments in order to serve differing customer bases. This, coupled with the ephemeral nature of most Elastic Beanstalk components, means that dynamic dashboards are essential for providing views into the application and environment health. Integrating CloudWatch metrics into Amazon Managed Grafana lets you create custom dashboards that instantly reflect the quickly changing Elastic Beanstalk environments and their resources.
Walkthrough
To implement this solution, complete the following steps. We dive deep into each of these steps in the following sections.
- Configure Elastic Beanstalk enhanced health and log forwarding to CloudWatch.
- Define the system and application specific metrics and log files to collect.
- Create an AWS Identity and Access Management (IAM) policy and role to support the custom CloudWatch configuration. Some formatting is required.
- Update the environment with the new IAM role.
- Create the Application Load Balancer alarm.
- Update and deploy your application source code bundle.
- Review AWS resource tags.
- Update the Grafana dashboard configuration.
- Import the dashboard into Amazon Managed Grafana.
The code for this solution can be found in this GitHub repository. The repository contains Elastic Beanstalk extensions for enabling enhanced health and sending logs to CloudWatch, configuring collection of Elastic Beanstalk health metrics, configuring the CloudWatch agent for metric collection, and creating a CloudWatch alarm. The repository also contains the code for the CloudWatch IAM policy and the Amazon Managed Grafana dashboard.
Prerequisites
For this walkthrough, you should have the following prerequisites in place:
An AWS account
Existing Elastic Beanstalk v2 environment
Existing Amazon Managed Grafana workspace
Existing Amazon Managed Grafana CloudWatch data source
Configure Elastic Beanstalk enhanced health and log forwarding to CloudWatch
The Elastic Beanstalk enhanced health agent monitors logs and metrics that Elastic Beanstalk utilizes to provide the overall health of the environment and each instance. The settings in the eb_health.config file enable enhanced health and configure the logs to be sent to CloudWatch.
The eb_metrics.config file contains a list of metrics collected by the health agent for the environment and each instance that are commonly sent to CloudWatch. This file should be modified to collect the metrics important to you. A complete list of the available metrics can be found in Elastic Beanstalk CloudWatch custom metrics documentation.
Note the order of precedence that Elastic Beanstalk follows when applying configuration options. Furthermore, if the same configuration option is defined in more than one location, then the setting with the highest precedence is applied. For example, if your environment is already configured for enhanced health, then the metrics defined in the eb_metrics.config will be ignored and instead need to be defined via your existing process, such as AWS CloudFormation, the Elastic Beanstalk console, etc. More information can be found in the Elastic Beanstalk precedence documentation.
Define the system and application specific metrics and log files to collect
In this step, you will specify the operating system, application, and process level metrics as well as the custom log files that must be sent to CloudWatch. The cw_metrics_log.config file contains sample metrics and log files. Make sure to customize this to match your environment, specifically for:
Namespace
Metrics
Application pools
Windows logs
Custom logs
In the log files section, a function populates the log group name. This function references one of the standard resource names provided by Elastic Beanstalk. A complete list of these resource names can be found in the Elastic Beanstalk resources documentation.
Note especially that the metrics_collection_interval is specified separately for each metric. In this environment, it can’t be set at the agent level because when Elastic Beanstalk log streaming to CloudWatch is enabled, a CloudWatch agent configuration file is automatically generated with this setting specified at the agent level with a value of 5. Having this setting with two different values at the agent level will result in an error. Therefore, your custom configuration file must be set for each individual metric.
Create an IAM policy and role
In this step, we will create an IAM policy and role to support the custom CloudWatch configuration.
- Navigate to the IAM console and choose Policies in the navigation pane.
- Choose Create policy.
- Choose the JSON tab and replace all of the code with the following JSON policy (cw_metric_policy.json).
- Choose Next: tags, add tags as desired, and choose Next: Review.
- Type a name for the policy and choose Create policy.
{
"Version": "2012-10-17",
"Statement": [
{
"Effect": "Allow",
"Action": [
"cloudwatch:PutMetricData",
"ec2:DescribeTags"
],
"Resource": "*"
}
]
}
Now create a new IAM role and add the new custom policy:
- Navigate to the IAM console and choose Roles in the navigation pane.
- Choose Create role, select AWS service as the trusted entity type, and EC2 as the use case.
- Choose Next: Permissions.
- Type the name of the policy created in the previous step in the filter policies search box. When the policy appears in the list, select the check box next to the policy name.
- Type AWSElasticBeanstalkWebTier in the filter policies search field. When the policy appears in the list, select the check box next to the policy name.
- After selecting the two policies, choose Next: Tags, add tags as desired, and choose Next: Review.
- Enter a name for the IAM role, and choose Create role.
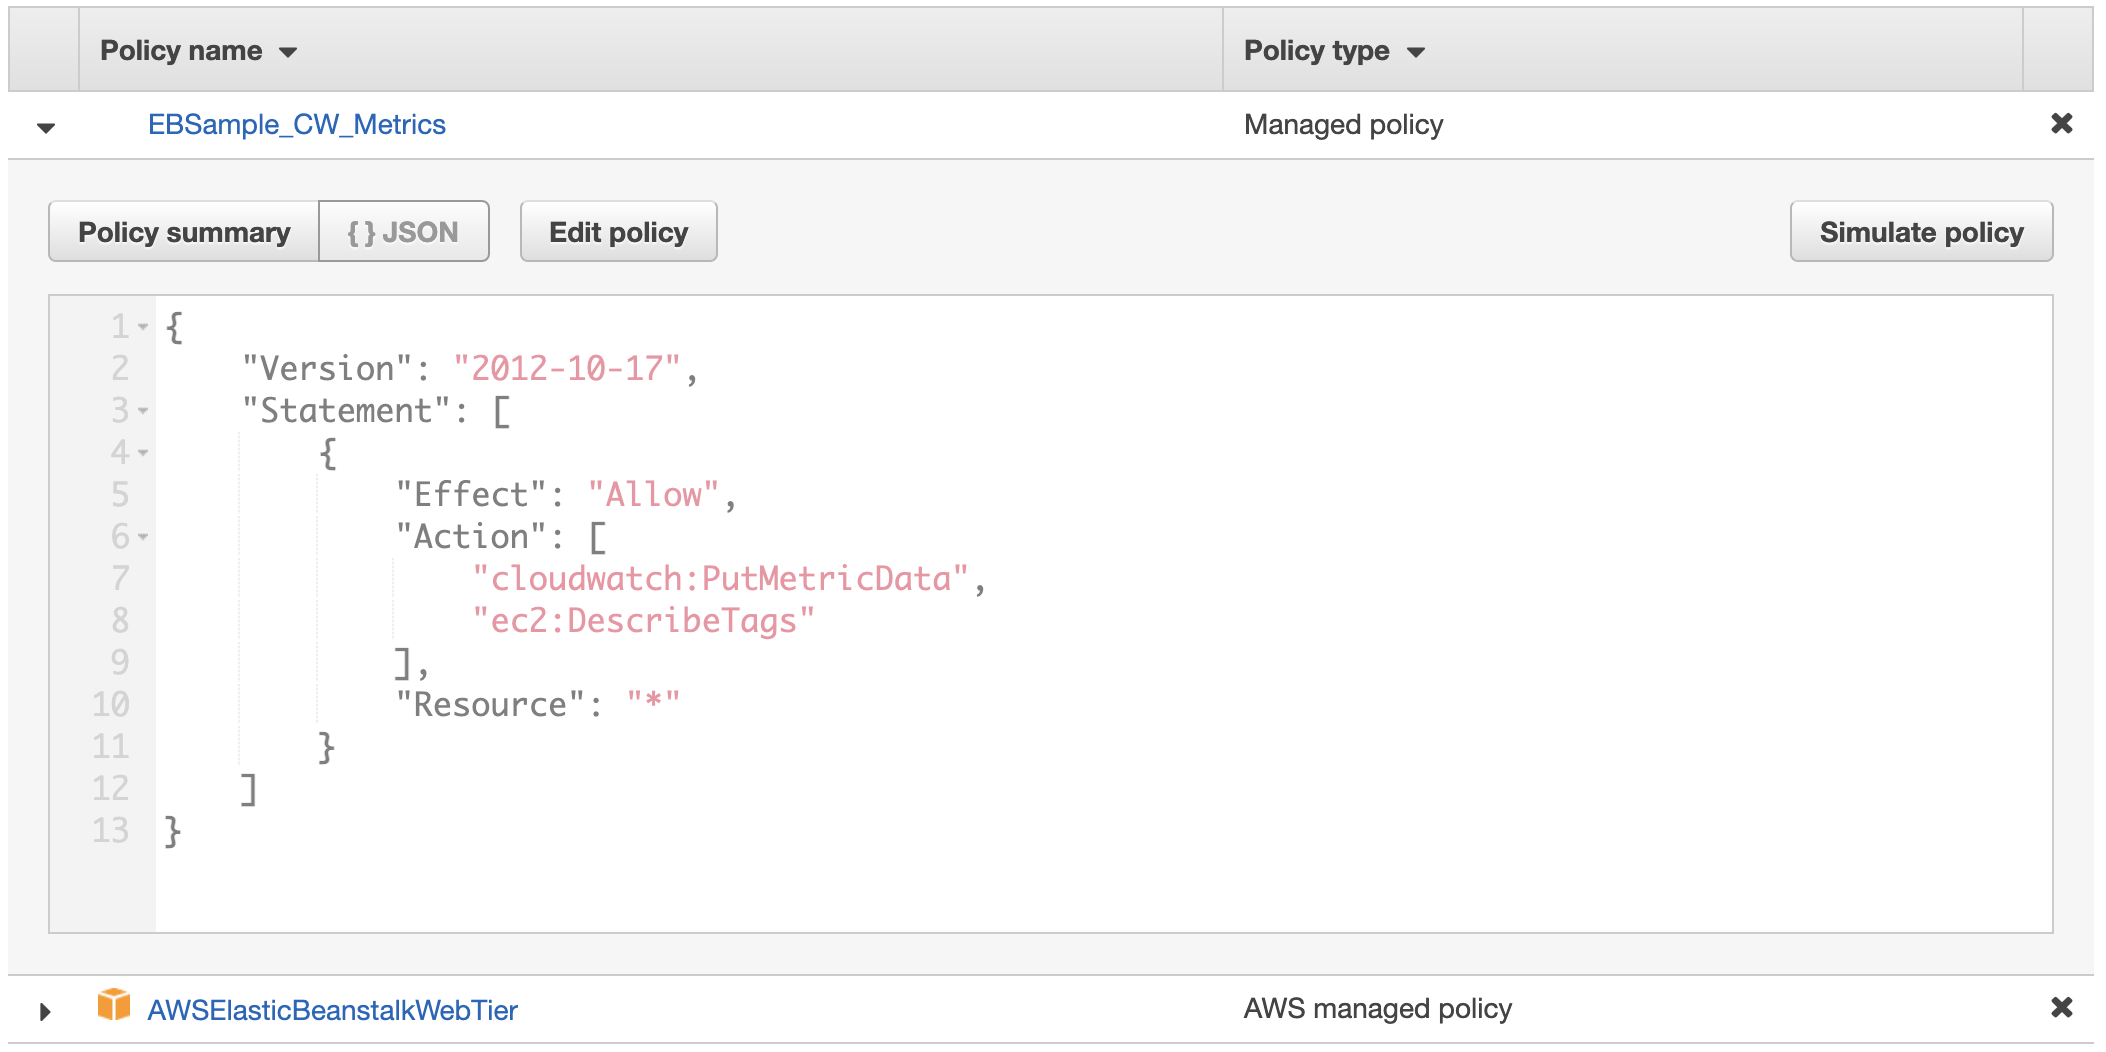
Figure 1: Custom role will contain two policies
Update the environment with the new IAM role
If your Elastic Beanstalk environment was deployed using CloudFormation, your CloudFormation template should be updated to utilize the new IAM role created, and the CloudFormation stack should then be updated. If your CloudFormation template also creates the role and policies, it can be updated to include the policies in the previous step. Alternatively, the Elastic Beanstalk environment can also be updated via the console by following these steps:
- Navigate to the Elastic Beanstalk console, choose Environments in the navigation pane, and then choose the environment name.
- Choose Configuration, and then choose Edit in the security section.
- Under the IAM instance profile, select the new IAM role that was created in the preceding section and choose Apply (Warning: instances will get replaced during deployment).
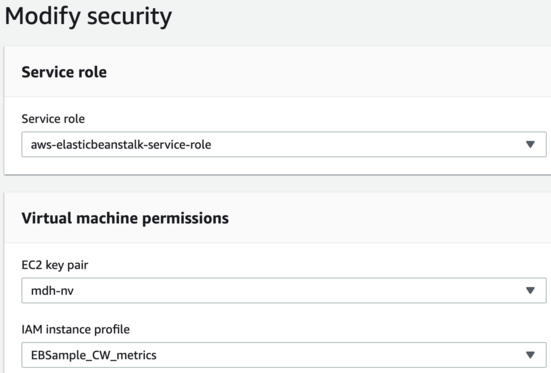
Figure 2: Select the new IAM instance profile, EBSample_CW_Metrics, in the modify security dialog box
- Choose Confirm on the warning message about replacing your instances.
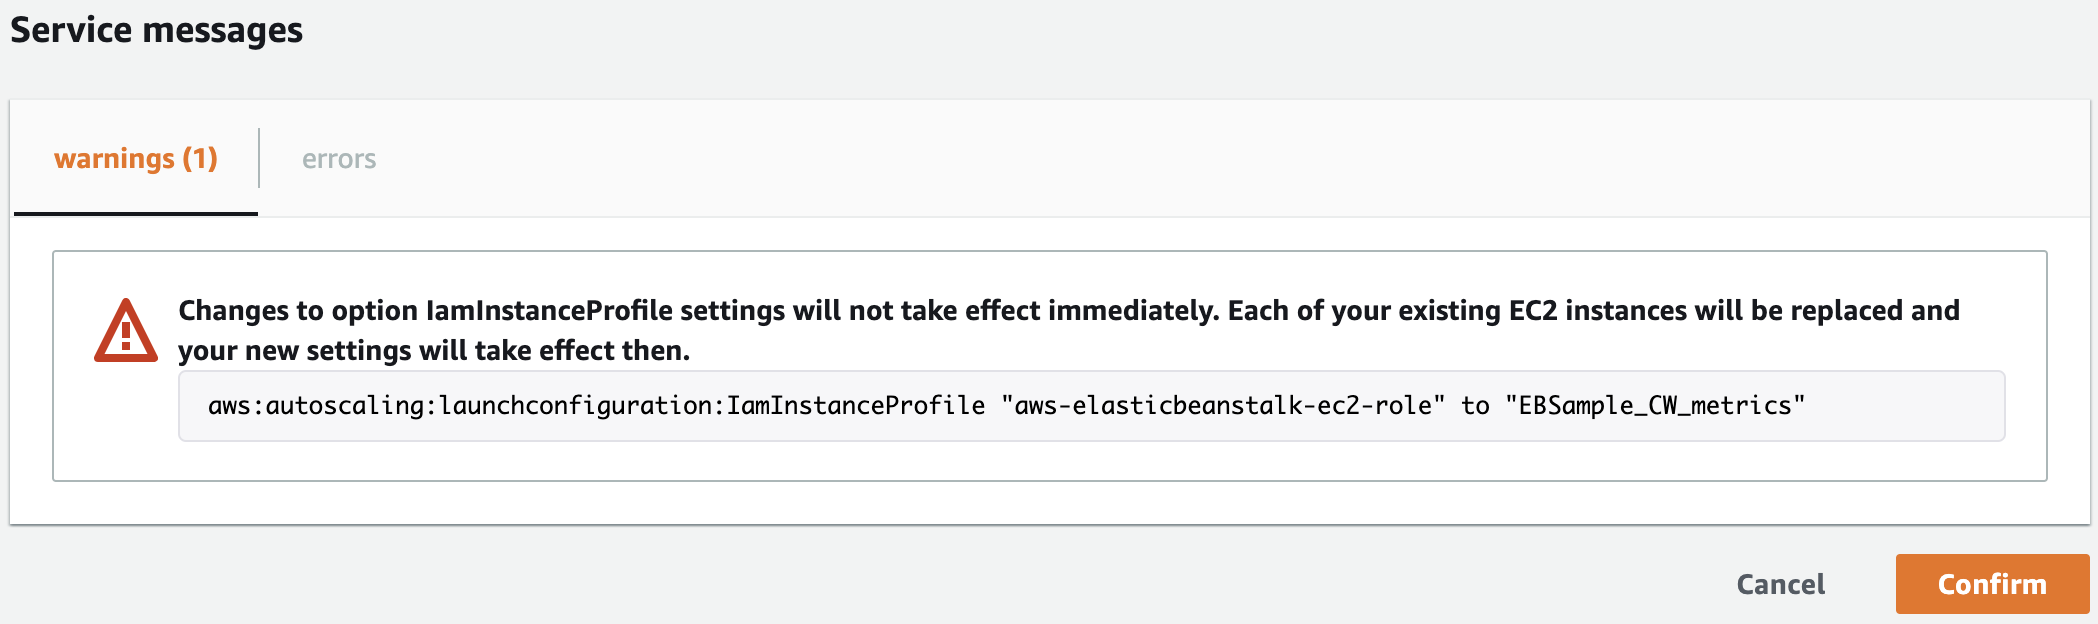
Figure 3: Confirm the change of roles and instance replacement
Create the Application Load Balancer alarm
As mentioned in the preceding section, Elastic Beanstalk resources can be referenced in order to obtain information about them or modify their properties. The cw_alb.config file creates a CloudWatch alarm based on a metric from the Application Load Balancer deployed by Elastic Beanstalk. The CloudFormation code utilizes one of the Elastic Beanstalk supported functions, Fn::GetAtt. Note that the YAML short form syntax is not supported.
Update and deploy your application source code bundle
Unzip your application source code and add a .ebextensions directory. The .ebextensions directory must be created at the top level of the directory structure and contains every previously discussed configuration file. For example:
aspnet.zip
webapi.zip
aws-windows-deployment-manifest.json
.ebextensions
eb_logs.config
eb_metrics.config
cw_metrics_log.config
cw_alb.config
Create a new source code bundle by zipping up the directory structure in the preceding list. Then, upload and deploy the new version by following these steps:
- Navigate to the Elastic Beanstalk console, choose Environments in the navigation pane, and then choose the environment name.
- Choose Upload and deploy, choose Choose file, select the zip file you just created, and choose Open.
- Specify a Version label, choose your Deployment Preferences, and choose Deploy (warning: instances will get replaced during deployment).
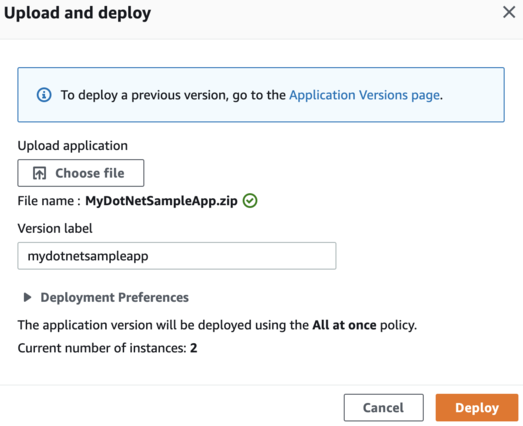
Figure 4: Upload and deploy the new source bundle
Review AWS resource tags
In this step, we will review AWS resource tags and how to utilize them to create dynamic Grafana dashboards. Grafana variables can provide drop-down selections and allow users to change dashboard displays easily. As selections are made, subsequent variables can automatically update their available values, a cascading effect that enables proper filtering. Each variable runs a CloudWatch query that filters values based on AWS resource tags.
For example, the customerid variable returns a list of values for the CustomerID tag from all Amazon Elastic Compute Cloud (Amazon EC2) instances in the Region. Moreover, the env variable returns a list of values for the Env tag from all EC2 instances in the Region with a CustomerID tag equal to the one that was previously selected.
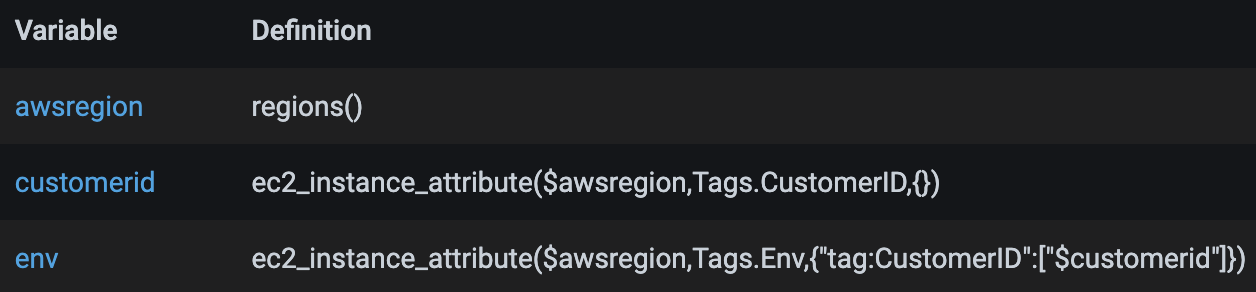
Figure 5: Sample of cascading variables
In order to enable the variables to return the intended data and ultimately render the desired data in the dashboard, a proper resource tagging strategy must be in place. In the sample dashboard, the following tags are used. Your tagging structure will be different, so the tags used within the variables should be modified before import.
CustomerID
Env
AppName
FSName
The tags enable the dashboard to be changed quickly to show only those resources for a specific customer, environment, and application name. These are useful if you deploy the same Elastic Beanstalk environment for multiple customers and run them across multiple environments. The application name, APPName, and file server name, FSName, are utilized to differentiate between Elastic Beanstalk deployed application servers, as well as servers deployed outside of Elastic Beanstalk but that are associated with the environment. In the sample dashboard, the servers deployed outside of Elastic Beanstalk are shown as file servers.
Update the Grafana dashboard configuration
The grafana_dashboard.json file contains a single dashboard with multiple panels displaying metrics collected by CloudWatch. In this step, the following parameters should be updated based on your environment:
datasource – replace with your CloudWatch data source name as configured in Grafana
namespace – update if you modified the namespace defined in the cw_metrics_log.config file
awsregion – if you use Regions outside of the US, modify the regex accordingly
variables – update the namespace and tags as necessary
Import the dashboard into Amazon Managed Grafana
In this step, you will create a new Grafana dashboard by importing the grafana_dashboard.json file. To import, conduct the following steps:
- Navigate to the Amazon Managed Grafana console.
- Choose All workspaces in the navigation pane, and then click on the Grafana workspace URL link.
- Once logged into the Grafana workspace, choose + in the navigation pane, then choose Import.
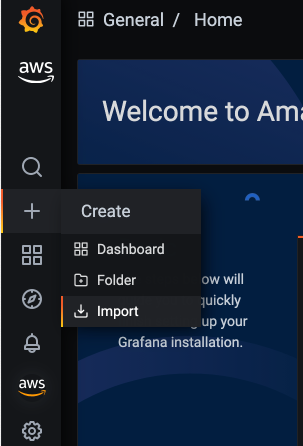
Figure 6: Click Import in the Create menu
- Choose Upload JSON file, select the grafana_dashboard.json file, and then choose Open.
- Specify the dashboard name, select the folder in which to import the dashboard, and choose Import.
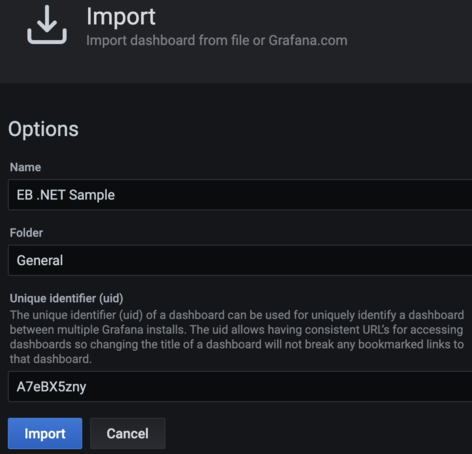
Figure 7: Import the sample dashboard
- Select the values for the five variables at the top of the dashboard in order to display data in the panels, as follows for the EC2 section:
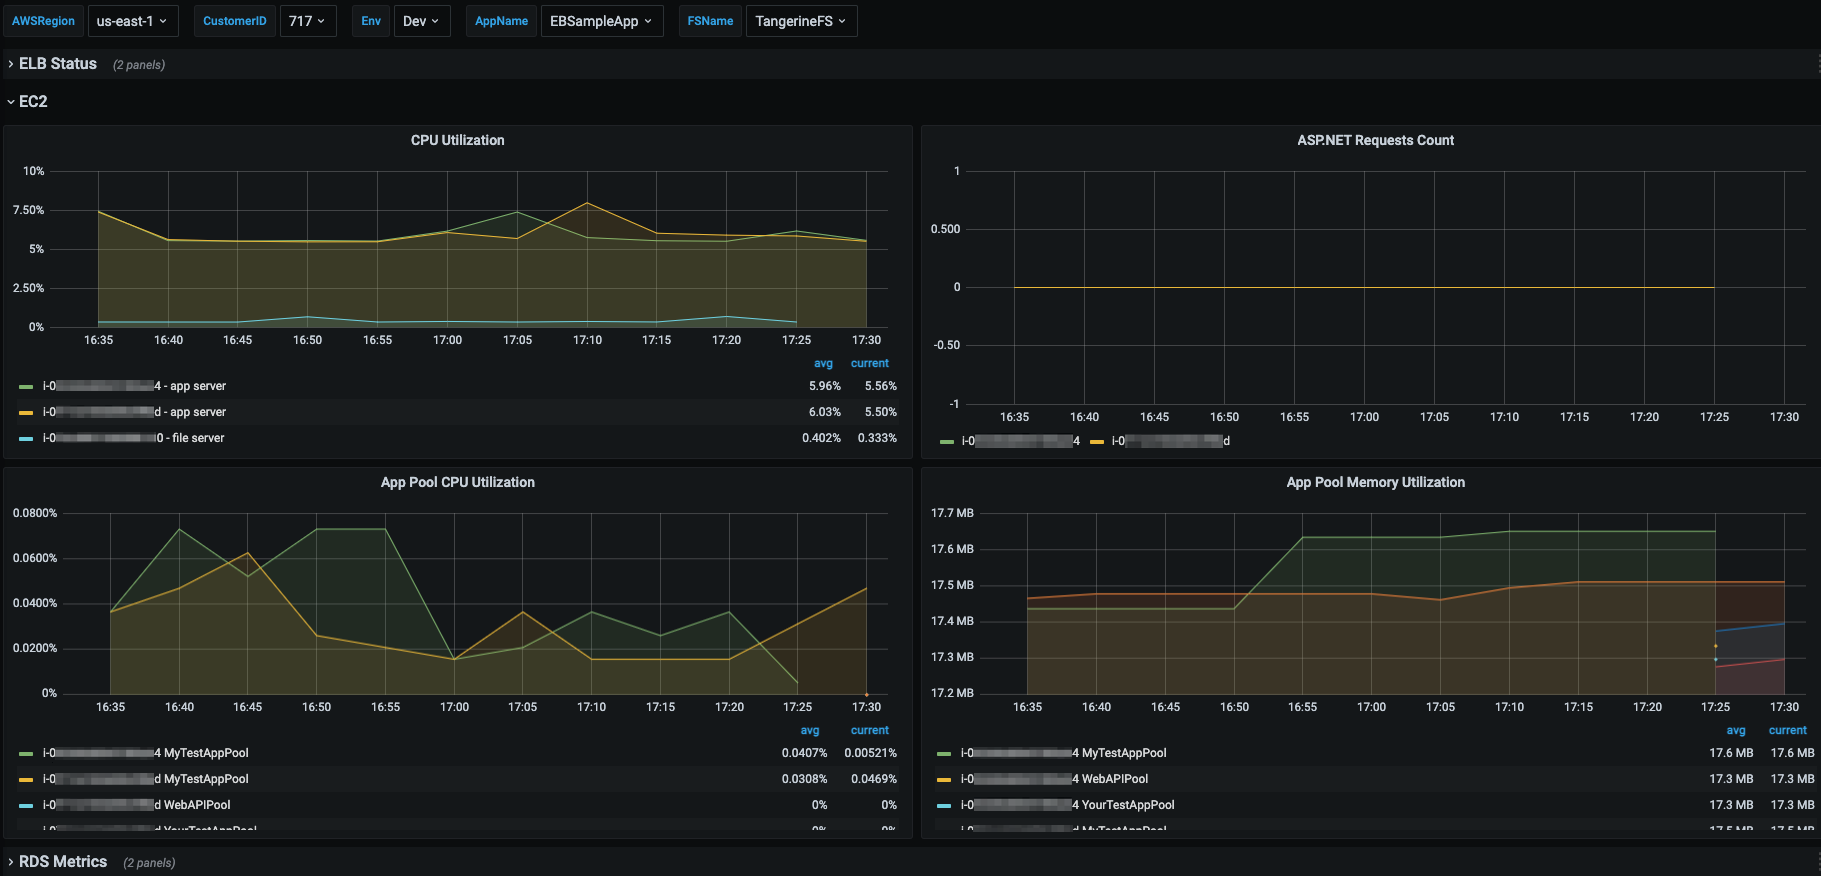
Figure 8: Sample screenshot shows the EC2 panels
Cleaning up
After testing this solution, remember to complete the following steps in order to avoid incurring charges to your AWS account.
Disable CloudWatch metrics and logs
You must disable the forwarding of Elastic Beanstalk enhanced metrics and logs to CloudWatch, remove the custom CloudWatch monitoring configuration, and delete the load balancer alarm. This can be accomplished by conducting the following steps:
- Navigate to the Elastic Beanstalk console, choose Environments, and then choose the environment name.
- Choose Upload and deploy, select Choose file, select your original source bundle zip file, and choose Open.
- Specify a Version label and choose Deploy (warning: instances will get replaced during deployment).
Delete the IAM policy and role
The custom IAM role and policy must be removed from the Elastic Beanstalk environment before they can be deleted. Update your CloudFormation template and update your stack or modify the role through the Elastic Beanstalk console as previously shown. Warning: instances will get replaced when the role is modified.
Next, delete the IAM role by following these steps:
- Navigate to the IAM console and select Roles in the left navigation pane.
- Type your custom role name in the filter roles search box. When the role appears in the list, select the check box next to the role name, and then choose Delete.
- Enter the role name to confirm deletion, and choose Delete.
- Select Policies in the left navigation pane.
- Type your custom policy name in the filter policies search box. When the policy appears in the list, select the check box next to the policy name, choose Actions, and then Delete.
- Enter the policy name to confirm deletion, and choose Delete.
Delete the Grafana dashboard
You also need to delete the imported Grafana dashboard. This is accomplished by conducting the following steps:
- Navigate to your Amazon Managed Grafana workspace, hover over the dashboards icon in the left navigation pane, and then choose Manage.
- Expand the folder in which you imported the Grafana dashboard, and check the box next to the dashboard to be deleted.
- Choose Delete, and then confirm by choosing Delete.
Conclusion
This post demonstrates how to monitor and visualize your Elastic Beanstalk deployed .NET applications by utilizing Elastic Beanstalk provided functionality and custom monitoring and visualization configurations. Within Elastic Beanstalk, we enabled enhanced monitoring and forwarded the enhanced metrics and logs to CloudWatch. Then, we added a custom CloudWatch configuration to the application server instances in order to obtain more granular operating system and process level metrics and custom application log files. Next, an Amazon Managed Grafana dashboard was created to provide dynamic visualization capabilities. Finally, we discussed the importance of a well-defined resource tagging strategy and how tags are utilized to support dynamic dashboards.
The monitoring and visualization capabilities provided in this blog can be further expanded by configuring the CloudWatch agent to collect additional logs and metrics and configuring additional Amazon Managed Grafana data sources to add related data to the dashboard, such as logs from Amazon OpenSearch Service. For more examples of these and other Amazon observability tools, please see the One Observability Workshop.
Page 1|Page 2|Page 3|Page 4