Contents of this page is copied directly from AWS blog sites to make it Kindle friendly. Some styles & sections from these pages are removed to render this properly in 'Article Mode' of Kindle e-Reader browser. All the contents of this page is property of AWS.
Page 1|Page 2|Page 3|Page 4
Monitoring AWS Lambda errors using Amazon CloudWatch
=======================
When we troubleshoot failed invocations from our Lambda functions, we often must identify the invocations that failed (from among all of the invocations), identify the root cause, and reduce mean time to resolution (MTTR). In this post, we will demonstrate how to utilize Amazon CloudWatch to identify failed AWS Lambda invocations. Likewise, we will show how to enable CloudWatch Lambda Insights and AWS X-Ray in order to improve the monitoring experience, and get help identifying Lambda health and performance issues.
AWS Lambda monitors functions for you, and sends metrics to CloudWatch. The AWS Lambda Console creates monitoring graphs for these metrics, and then shows them on the “Monitor” tab for each Lambda function. CloudWatch lets you set alarms to respond to changes in utilization, performance, or error rates. The following image shows three widgets for “Invocation”, “Duration”, and “Error count and success rate (%)” metrics.
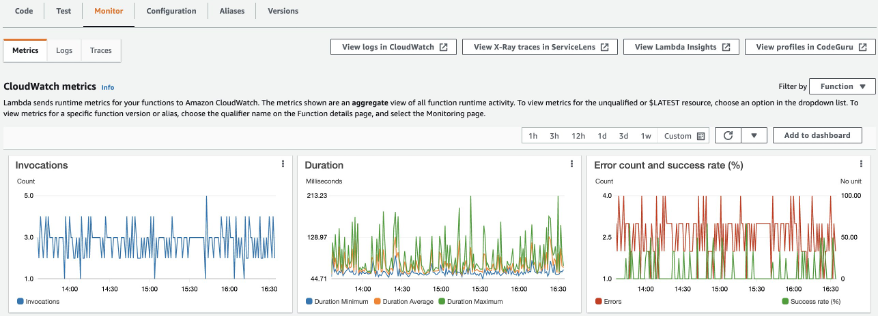
The Errors metric shows the number of invocations resulting in a function error aggregated at one-minute intervals. Function errors include unhandled exceptions thrown by your code, and errors thrown by the Lambda runtime. The runtime returns errors for issues such as timeouts and configuration errors. To calculate the error rate, divide the Errors value by the Invocations value. Note that an errors metric timestamp reflects when the function was invoked, not when the error occurred.
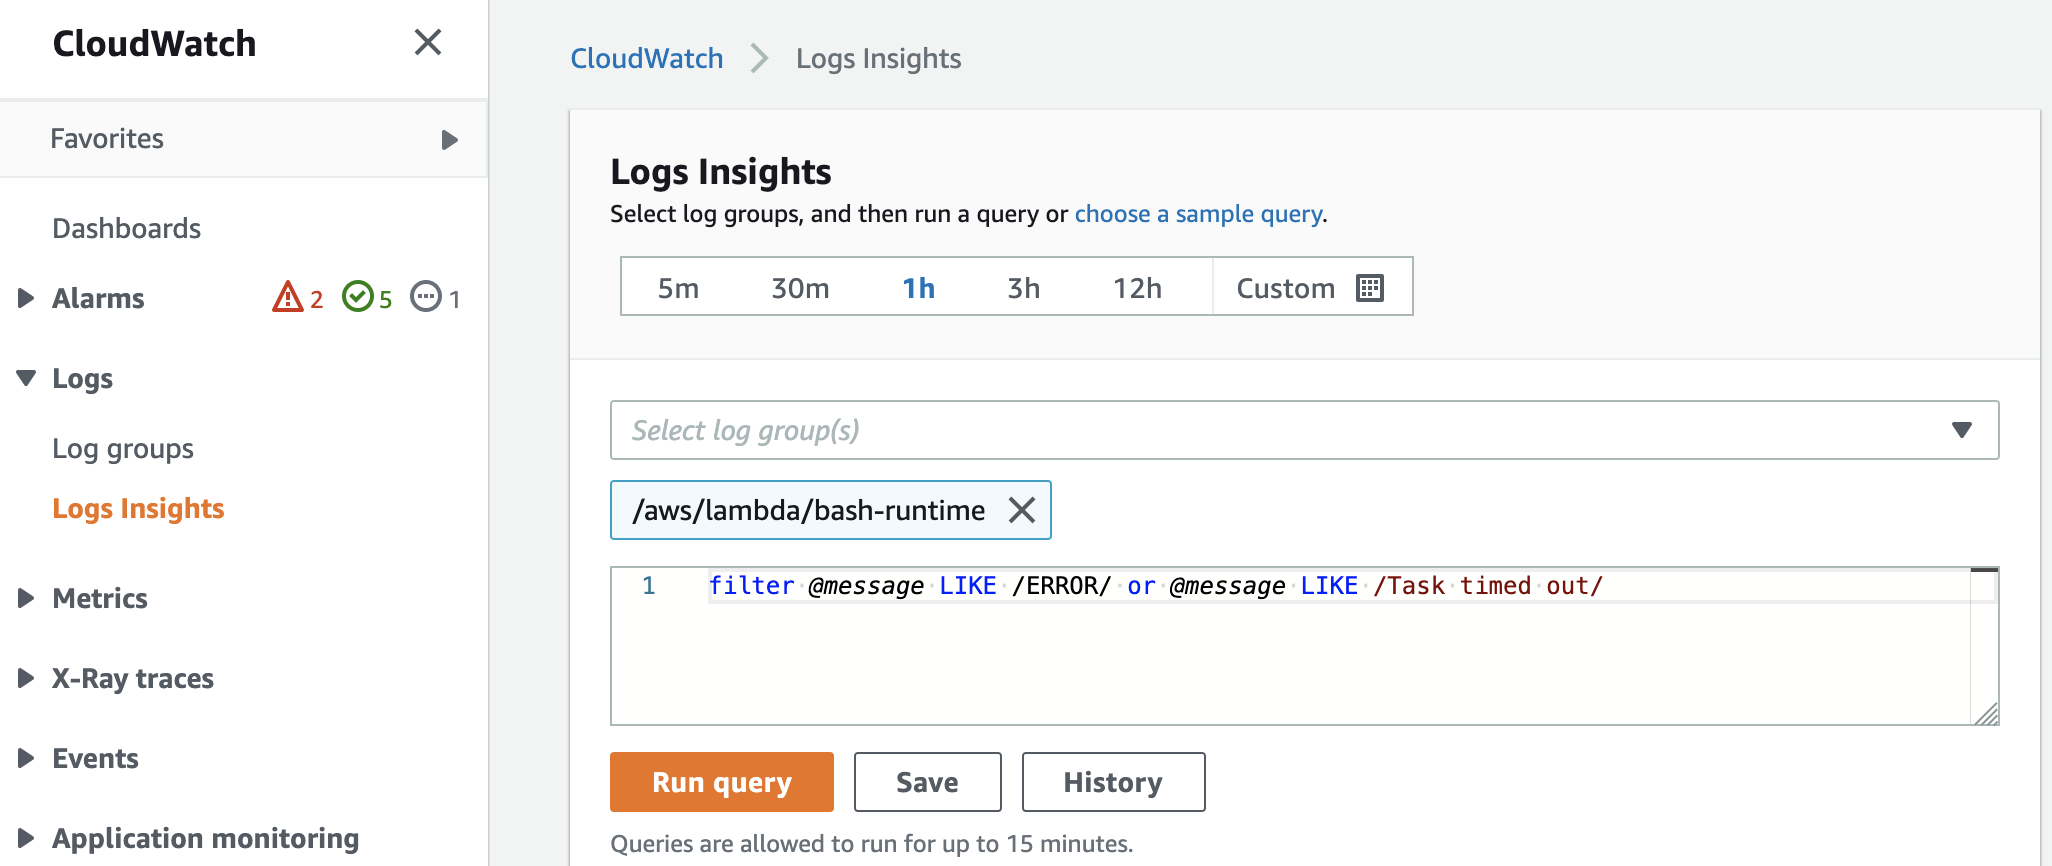
In the CloudWatch console, utilize Logs Insights to query platform logs that Lambda sends for each function execution. Each function stores logs in a function-specific log group. Furthermore, a single request can query up to 20 log groups. You can also save queries that you have created.
We will run the following query across 10 different log groups in order to identify invocations with errors:
filter @message LIKE /ERROR/ or @message LIKE /Task timed out/
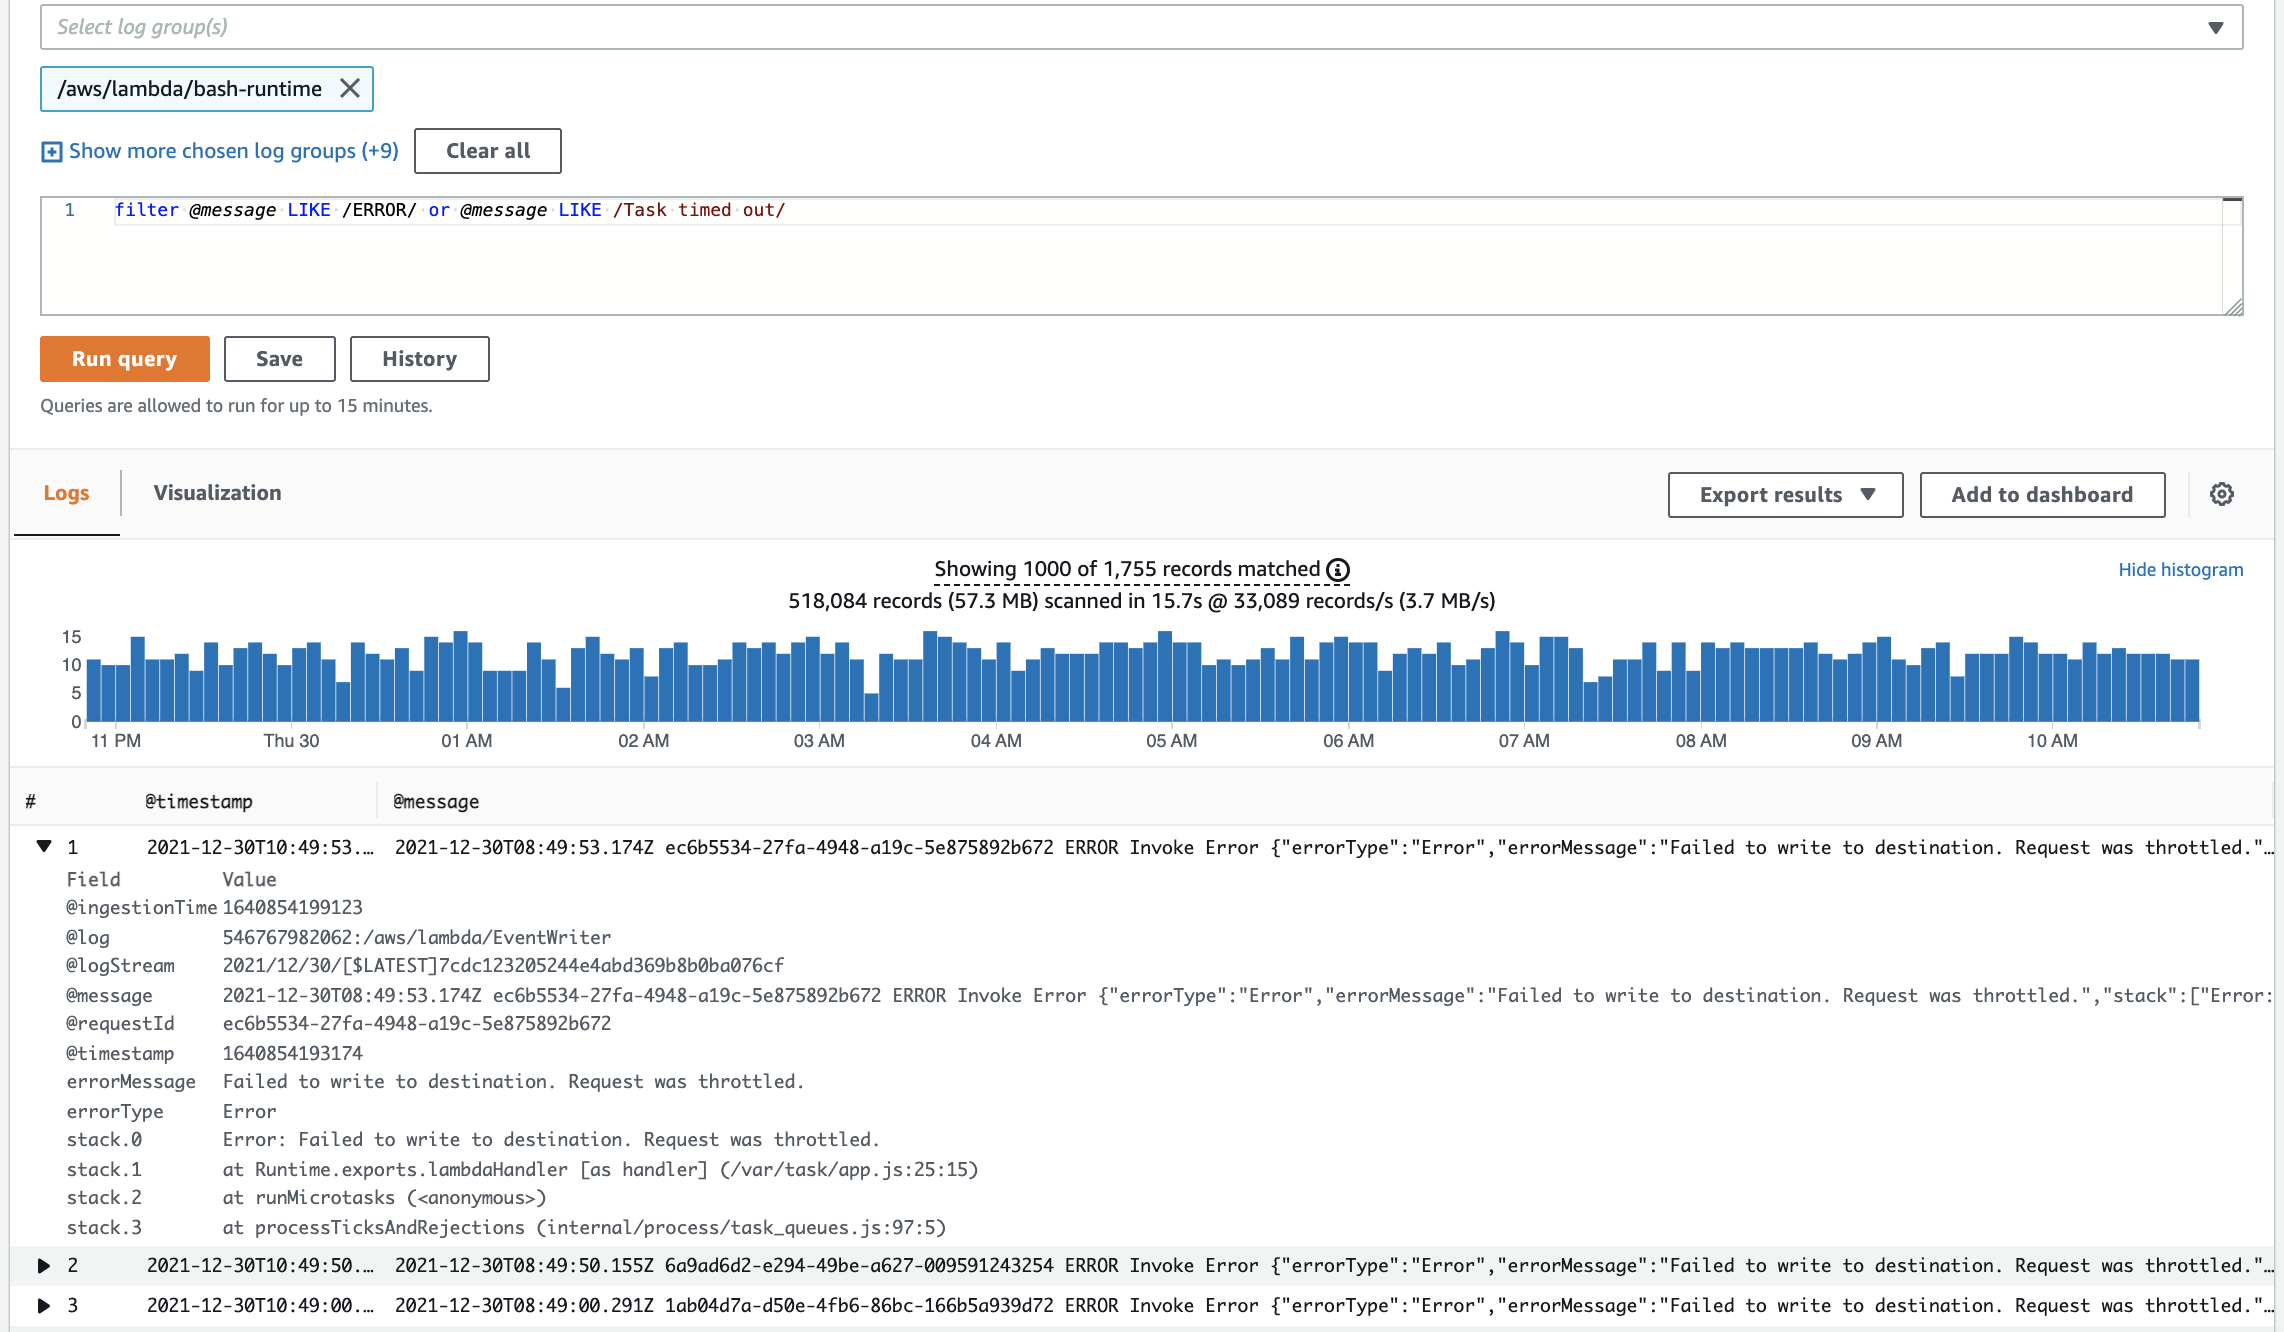
After running the search query, we get a list of log events containing ”ERROR“ or ”Task timed out“ in the payload. Expanding one log event reveals the invocation request ID in the @requestId field. Copy the request ID and add it to the query. We also see that this invocation had the following error “Error: Failed to write to destination. Request was throttled.”
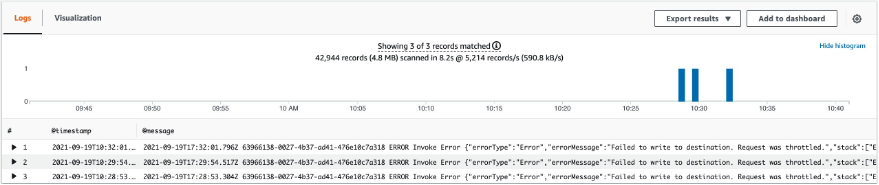
Next, run the following query, which reveals that this invocation has been throttled three times (we can see timestamps for each throttle).
filter (@message LIKE /ERROR/ or @message LIKE /Task timed out/) and @requestId = "63966138-0027-4b37-ad41-476e10c7a318"
This is how you can utilize Amazon CloudWatch to identify failed AWS Lambda invocations. Now we will show you how to get more detailed insights into your Lambda function invocations by using CloudWatch Lambda Insights.
CloudWatch Lambda Insights
Amazon CloudWatch Lambda Insights is provided by the Amazon CloudWatch team, and it enables you to efficiently monitor, troubleshoot, and optimize Lambda functions. Lambda Insights simplifies the collection, visualization, and investigation of detailed compute performance metrics, errors, and logs. Easily isolate and correlate performance problems in order to optimize your Lambda environments. Lambda Insights is available today in every region where AWS Lambda is available.
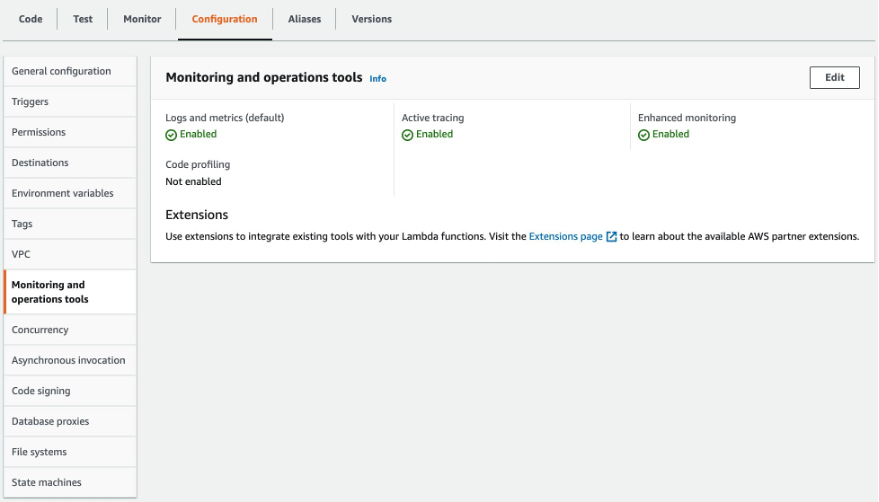
How to Enable Lambda Insights
Utilize the Lambda Console to enable Lambda Insights and X-Ray (Enhanced monitoring) for your Lambda function (see the image below). Alternatively, utilize the AWS CLI, AWS CloudFormation, the AWS Serverless Application Model CLI (AWS SAM), or the AWS Cloud Development Kit (AWS CDK). For more details, see the documentation.
Using Lambda Insights (Multi-Function)
Let’s start looking at Lambda Insights in CloudWatch. To do this, go to CloudWatch and click “Multi-function” under Insights/Lambda Insights. Here, we can observe metrics for multiple Lambda functions enabled, in this account, that have Lambda Insights enabled.
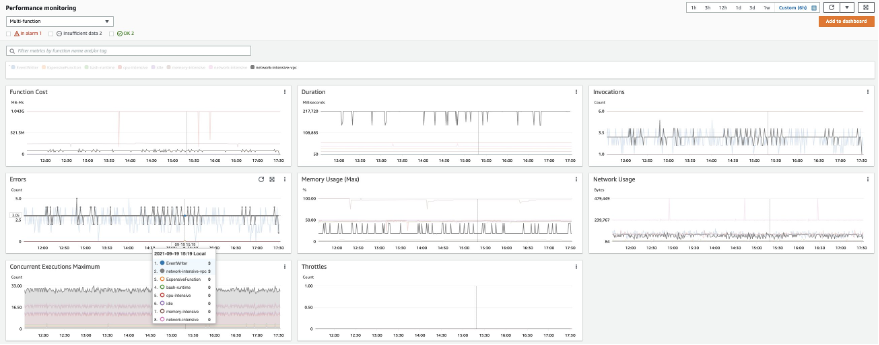
In the Errors metric, we can identify the function “network-intensive-vpc” as having the highest error rate. We will dig deeper into this function.
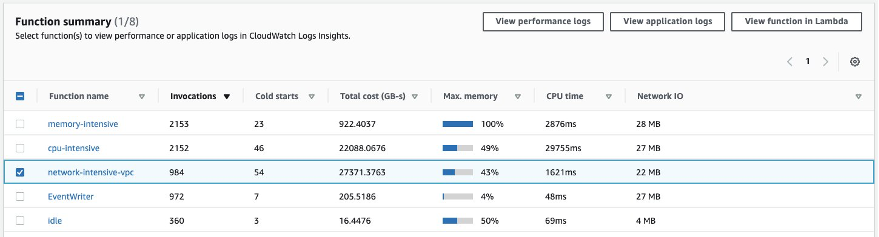
Using Lambda Insights (Single Function)
At the bottom of the Lambda Insights Multi-Function page, select any of the given Lambda functions to see metrics on a per-function basis. Select the Lambda function named network-intensive-vpc:
On the next screen, we can see the Error rate, CPU, memory, and network utilization for the selected Lambda function. If you have enabled AWS X-Ray for your Lambda function, then the Lambda execution trace will be available in the Trace column. Moreover, we can see that the most recent invocations have error. Let’s dig deeper into that.
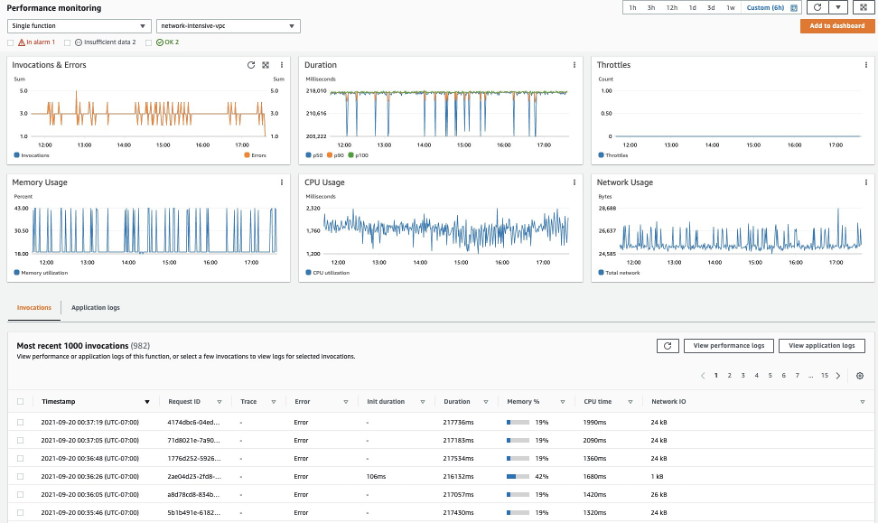
We can also look at the Lambda logs for a particular event by selecting an invocation and going to “View Application Logs”. This takes us to CloudWatch Log Insights. Selecting “View Performance Logs” will again take us to CloudWatch Log Insights for Log Group “/aws/lambda-insights”. Here, we can see the Lambda function performance logs in Embedded Metric Format (EMF).
To get the performance logs, run the following query:
fields @timestamp, @message, @logStream
| filter function_name = “network-intensive-vpc”
| filter request_id = “411821f1-47c2-4bc9-87ab-31b8606facad”
If we expand the resulting log event, then we see that the shutdown_reason field shows “failure”. These are runtime errors, and to verify this we’ll run the following query in the application logs:

fields @timestamp,@message,@logStream
| filter @requestId = “411821f1-47c2-4bc9-87ab-31b8606facad”
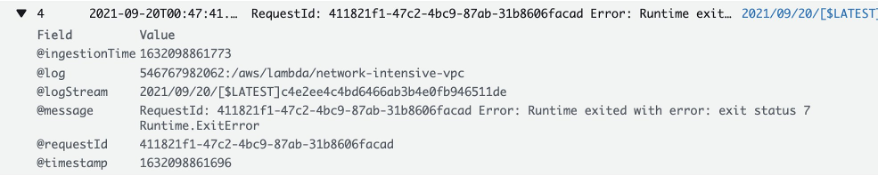
In the log event we see that our function suffered from a runtime error.
This is how you can utilize CloudWatch Lambda Insights to zoom in on an individual invocation of your Lambda function in order to better understand what caused it to fail. CloudWatch Lambda Insights is built using AWS Lambda Extensions, which let you easily integrate Lambda functions with your favorite tools for monitoring, observability, security, and governance.
What are Lambda Extensions?
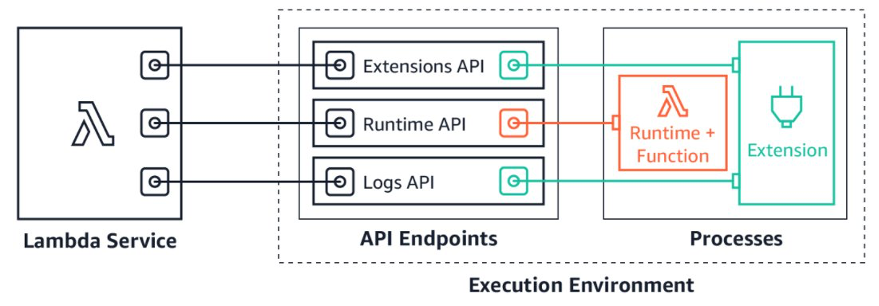
In May 2021, we announced the general availability of AWS Lambda Extensions. Extensions are a new way for tools to more easily integrate deeply into the Lambda execution environment in order to control and participate in Lambda’s lifecycle without complex installation and configuration. Utilize Lambda extensions for use cases such as capturing diagnostic information before, during, and after function invocation. Choose from a wide range of extensions provided by popular AWS services, AWS Lambda partners, and the open source community (see our What’s New post for a list of popular extensions to choose from). Likewise, you can utilize the Lambda Extensions API to build your own extensions.
Lambda extensions are companion processes that augment Lambda function capabilities. Extensions utilize the Extensions API to register for Lambda lifecycle events: initialization, invocation, and shutdown. Then, extensions can run logic or start new processes in response to these lifecycle events. Lambda extensions can also utilize the Runtime Logs API to subscribe to a stream of the same logs that the Lambda service sends to Amazon CloudWatch directly from within the Lambda execution environment. If the extension is subscribed to the Logs API, then the Lambda platform will stream the logs to the extension, so that the extension can process, filter, and send these logs to any preferred destination.
Add extensions to your Lambda functions by using Lambda layers or include them in the image for functions deployed as container images. Install and manage extensions by using the AWS Lambda Console, the AWS Command Line Interface (CLI), or infrastructure as code (IaC) services and tools, such as AWS CloudFormation, AWS Serverless Application Model (AWS SAM), and Terraform.
CloudWatch Lambda Insights Pricing
When you enable Lambda Insights for your Lambda function, Lambda Insights reports eight metrics per function, and every function invocation sends approximately 1 KB of log data to CloudWatch. You only pay for the metrics and logs reported for your function by Lambda Insights. There are no minimum fees or mandatory service usage polices. Furthermore, you do not pay for Lambda Insights if the function is not invoked. For a pricing example, see Amazon CloudWatch pricing.
As well, utilize the AWS Price Calculator to estimate Lambda Insights costs. For example, a function running 500,000 times per month will cost you less than $2.7 per month to be monitored using Lambda Insights.
Conclusion
This post demonstrated how to utilize CloudWatch to troubleshoot AWS Lambda invocation errors, and how to enable Lambda Insights in order to get a deep observability view with additional data that helps reduce the MTTR. To learn more about Lambda extensions, see the documentation. To learn more about AWS observability functionalities on Amazon CloudWatch and AWS X-Ray, see the One Observability Demo workshop.
Visualize Amazon EC2 based VPN metrics with Amazon CloudWatch Logs
=======================
Organizations have many options for connecting to on-premises networks or third parties, including AWS Site-to-Site VPN. However, some organizations still need to use an Amazon Elastic Compute Cloud (Amazon EC2) instance running VPN software, such as strongSwan.
Gaining insight into Amazon EC2-based VPN metrics can be challenging when compared to AWS native VPN services that feature Amazon CloudWatch integration. This post aims to help surface those important metrics, so that administrators can better monitor the status and performance of their EC2 based VPNs.
Publishing these metrics allow administrators to keep meaningful network metrics in CloudWatch to correlate potential VPN issues with other AWS metrics and logs.
To learn more about running strongSwan on an EC2 instance, take a look at this blog post.
Solution overview
In our scenario, we will export key metrics from an EC2 instance running strongSwan and FRRouting to CloudWatch, including latency to a VPN target and the number of BGP prefixes received. We will also export the actual BGP prefixes that are present in the routing table of the EC2 instance to Amazon CloudWatch Logs. This lets administrators troubleshoot potential VPN and routing issues without the need to log in to the EC2 instance.
FRR works along with strongSwan, and it is used to manage dynamic routing. In this case, we’ll use the BGP protocol, though simple modifications could be made to accommodate other dynamic routing protocols.
Walkthrough
When the AWS CloudFormation template is deployed, it will create an AWS Identity and Access Management (IAM) role that is attached to an EC2 instance that you specify. The permissions include access to put metrics into CloudWatch and to put data into a specific CloudWatch Logs log stream.
Prerequisites
To follow along with this blog post, you should have the following:
An AWS account
An EC2 instance running Ubuntu or Amazon Linux 2 with strongSwan and software capable of managing dynamic BGP routing, such as FRR or Quagga
An active VPN connection from your EC2 instance to another VPN device
A target IP address on the remote end of the VPN that is capable of receiving ICMP traffic
Steps
As an overview, we will follow these steps:
Deploy the CloudFormation template
Attach the IAM instance profile to the EC2 instance
Copy the bash file to your EC2 instance running strongSwan
Install the command-line interface (AWS CLI) on the EC2 instance
Create a cron job to schedule metric delivery to CloudWatch and CloudWatch Logs
View the CloudWatch dashboard to visualize the metrics and verify metric delivery
Launch the CloudFormation stack
- Download the CloudFormation template associated with this blog post
- Log in to the AWS console, and navigate to the CloudFormation console
- Select the Create stack button
- Upload the template file that you previously saved, and select Next
- Enter a name for your CloudFormation stack, and fill in the parameters required by the template
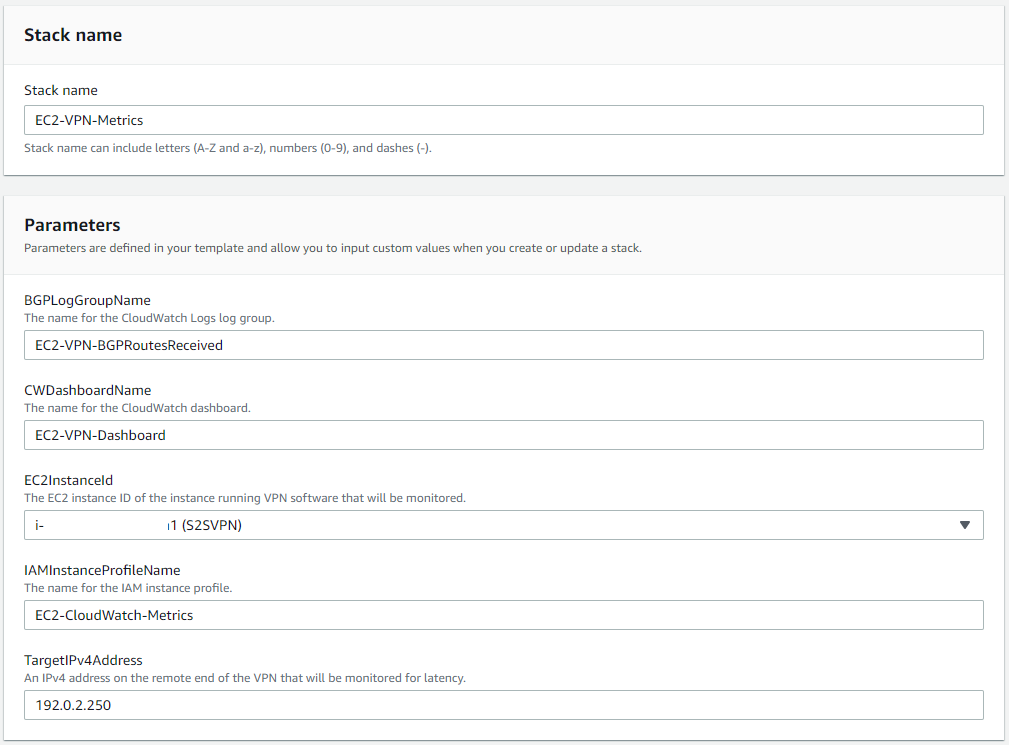
Figure 1: Launching the CloudFormation stack
- Select Next, and optionally specify any tags to apply
- Select Next once more, review the details, select the checkbox to acknowledge that the CloudFormation template will create IAM resources, and select Create stack
- You can monitor the resource creation progress on the Events screen
Attach the instance profile to your EC2 instance
- In the EC2 console, select the instance running strongSwan
- From the Actions dropdown in the top right corner, select Security and then select Modify IAM role
- From the dropdown menu, choose the role called “EC2-CloudWatch-Metrics”, as depicted in Figure 2 (this name may differ if you modified the default options when deploying the CloudFormation template)
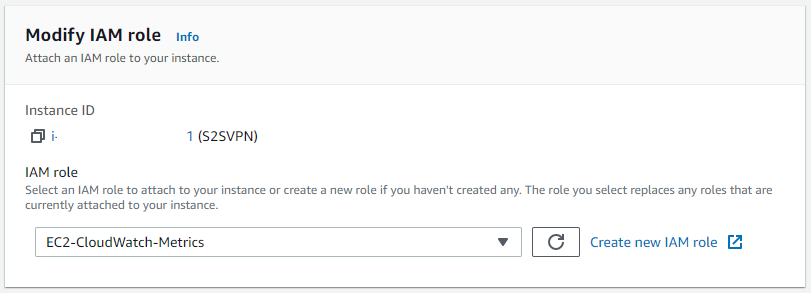
Figure 2: Modify the IAM role on your EC2 instance
Create the bash script in your EC2 instance
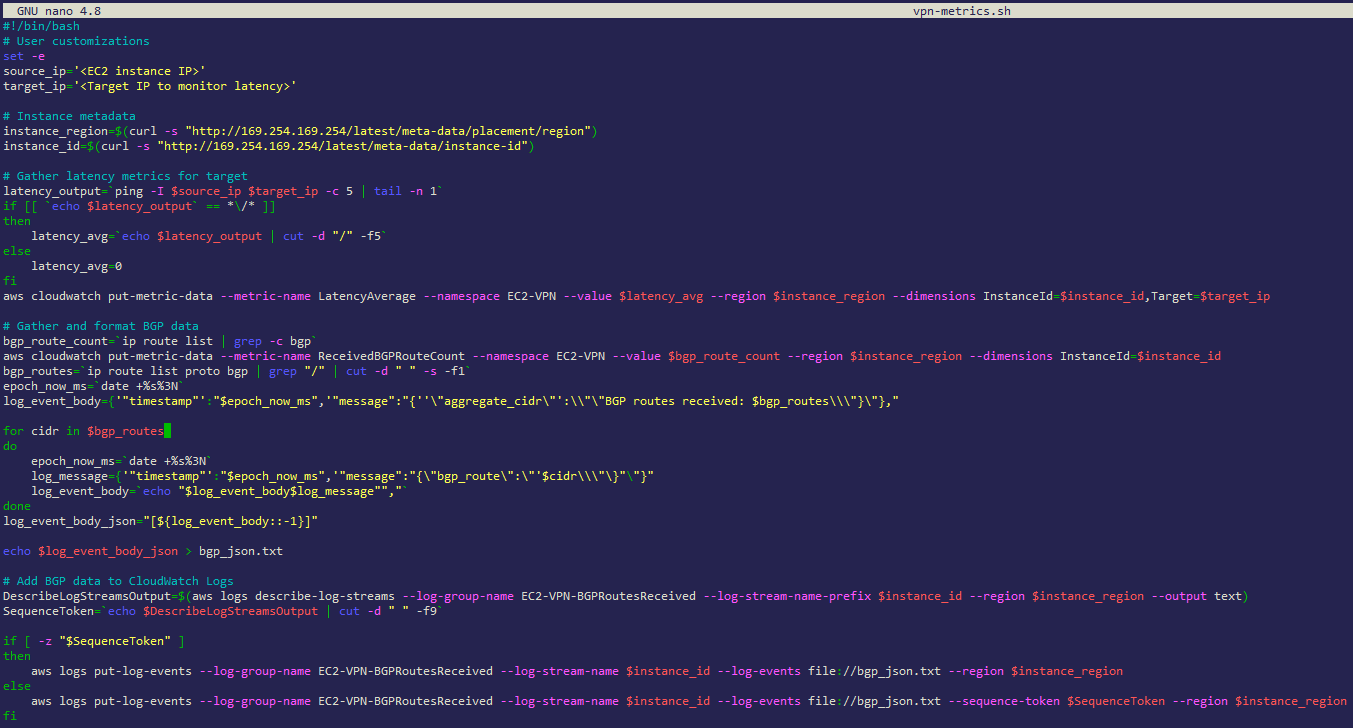
Figure 3: Creating the vpn-metrics.sh script on your EC2 instance
- Log in to the EC2 instance running strongSwan
- Create a new file, and copy the below script into it, as shown above in Figure 3 (the script is also available to download here)
#!/bin/bash
# User customizations
set -e
source_ip='<EC2 instance IP>'
target_ip='<Target IP to monitor latency>'
# Instance metadata
instance_region=$(curl -s "http://169.254.169.254/latest/meta-data/placement/region")
instance_id=$(curl -s "http://169.254.169.254/latest/meta-data/instance-id")
# Gather latency metrics for target
latency_output=`ping -I $source_ip $target_ip -c 5 | tail -n 1`
if [[ `echo $latency_output` == *\/* ]]
then
latency_avg=`echo $latency_output | cut -d "/" -f5`
else
latency_avg=0
fi
aws cloudwatch put-metric-data --metric-name LatencyAverage --namespace EC2-VPN --value $latency_avg --region $instance_region --dimensions InstanceId=$instance_id,Target=$target_ip
# Gather and format BGP data
bgp_route_count=`ip route list | grep -c bgp`
aws cloudwatch put-metric-data --metric-name ReceivedBGPRouteCount --namespace EC2-VPN --value $bgp_route_count --region $instance_region --dimensions InstanceId=$instance_id
bgp_routes=`ip route list proto bgp | grep "/" | cut -d " " -s -f1`
epoch_now_ms=`date +%s%3N`
log_event_body={'"timestamp"':"$epoch_now_ms",'"message":"{''\"aggregate_cidr\"':\\"\"BGP routes received: $bgp_routes\\\"}\"},"
for cidr in $bgp_routes
do
epoch_now_ms=`date +%s%3N`
log_message={'"timestamp"':"$epoch_now_ms",'"message":"{\"bgp_route\":\"'$cidr\\\"\}"\"}"
log_event_body=`echo "$log_event_body$log_message"","`
done
log_event_body_json="[${log_event_body::-1}]"
echo $log_event_body_json > bgp_json.txt
# Add BGP data to CloudWatch Logs
DescribeLogStreamsOutput=$(aws logs describe-log-streams --log-group-name EC2-VPN-BGPRoutesReceived --log-stream-name-prefix $instance_id --region $instance_region --output text)
SequenceToken=`echo $DescribeLogStreamsOutput | cut -d " " -f9`
if [ -z "$SequenceToken" ]
then
aws logs put-log-events --log-group-name EC2-VPN-BGPRoutesReceived --log-stream-name $instance_id --log-events file://bgp_json.txt --region $instance_region
else
aws logs put-log-events --log-group-name EC2-VPN-BGPRoutesReceived --log-stream-name $instance_id --log-events file://bgp_json.txt --sequence-token $SequenceToken --region $instance_region
fi
$ nano vpn-metrics.sh- Paste the script into the file
- Modify the target_ip variable, and specify a target IP address on the other end of the VPN. Make sure that it accepts ICMP echo-request messages. Additionally, specify a source IP address on your local EC2 instance for the source_ip variable. This is where the ICMP messages will be sourced from.
- Save the file
- Press ctrl-X to exit the editor
- Press Y to save the changes
- Give the new file execute permissions
$ chmod +x vpn-metrics.sh
Install the AWS CLI
If you’re using an operating system other than Amazon Linux 2, then you will need to install the AWS CLI.
$ sudo apt install awscli
Create a cron job
A cron job creates a scheduled task that runs at a specified time or interval.
Follow these steps for Amazon Linux 2:
$ crontab -e- Add this line to execute the script every five minutes:
*/5 * * * * /home/ec2-user/vpn-metrics.sh
Follow these steps for Ubuntu:
$ crontab -e- Add this line to execute the script every five minutes:
*/5 * * * * /home/ubuntu/vpn-metrics.sh
When the crontab is saved, crontab: installing new crontab appears.
View the CloudWatch dashboard
- Navigate to the CloudWatch console, and select Dashboards.
- Select the dashboard titled “EC2-VPN-Dashboard”.
- If the cron job has already run, then you will see metrics populated in the three dashboard widgets (if you do not see any metrics yet, then wait a few minutes for CloudWatch to populate them).
- New metrics will continue to appear after the cron job runs and executes the script. Use the refresh icon in the upper right of the CloudWatch console to see new metrics appear in the dashboard widgets. Figure 4, depicts metrics for all three widgets.
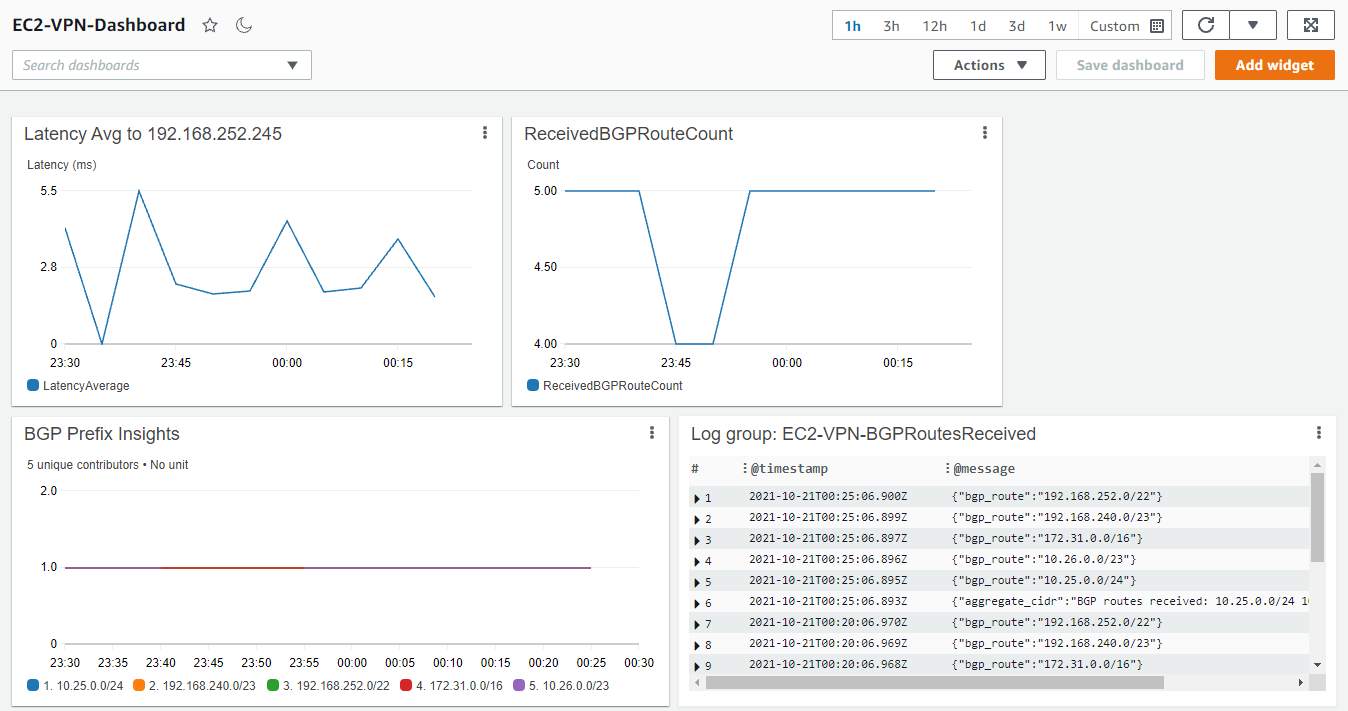
Figure 4: Viewing the CloudWatch Dashboard
The Amazon CloudWatch Contributor Insights widget in the bottom left of Figure 4 will show when a BGP prefix is no longer present in the BGP route table of the EC2 instance. This can be very useful in troubleshooting a scenario where routes from multiple BGP sources are present. The dip in the ReceivedBGPRouteCount widget in Figure 4 correlates with a temporary loss of the prefix 10.26.0.0/23, shown in the BGP Prefix Insights widget in Figure 5.
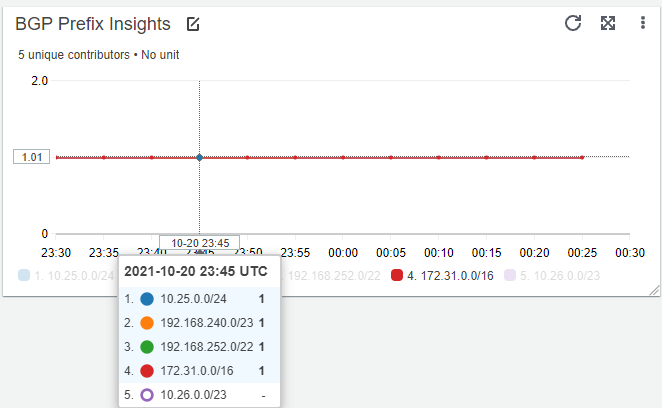
Figure 5: BGP Prefix Insights
The Contributor Insights rule can also be viewed in a standalone fashion by visiting the Contributor Insights link under the CloudWatch service page.
Cleaning up
Disable the cron job running on your EC2 instance to avoid incurring charges. To do this, execute the steps below:
$ crontab -e- Remove this line:
*/5 * * * * /home/ec2-user/vpn-metrics.sh (replace ec2-user with ubuntu, if the EC2 instance is running Ubuntu)
To deprovision the CloudWatch dashboard, log group, and IAM role, delete the CloudFormation stack that was deployed.
Conclusion
This post demonstrated how to publish custom CloudWatch metrics from an EC2 instance to a CloudWatch dashboard and custom namespace. Publishing these metrics lets administrators view key performance metrics for an EC2-based VPN, and have the ability to create CloudWatch alarms if desired.
To publish other EC2 metrics not covered in this post, take a look at the CloudWatch agent to publish in-guest, system-level metrics.
Create metrics and alarms for specific web pages with Amazon CloudWatch RUM
=======================
Amazon CloudWatch RUM makes it easy for AWS customers to access real-world performance metrics from web applications, thereby giving insights into the end-user experience. These user experiences are quantified into discrete metrics that you can then create alarms for. But what if you must have different load time alarms for certain pages? Or you’re testing a specific component of your application with a specific web browser? How can CloudWatch RUM be used to instrument a single web page or dimension differently from the rest of your application?
The telemetry data from CloudWatch RUM can be delivered to Amazon CloudWatch Logs, and from there we can extract datapoints that are important for your application. A classic example is a payment page on an ecommerce site. Although you may have a target page load time of less than two seconds for most parts of your application, it can typically take much longer than this to process a payment card transaction. What if you must have a CloudWatch alarm that triggers only when payment page loads take longer than 10 seconds?
In our approach, application telemetry comes from real web browsers and is received by CloudWatch RUM, where it is analyzed, indexed, parsed, and the data then optionally delivered to a CloudWatch Logs log group. By using a combination of CloudWatch RUM, CloudWatch Logs, and CloudWatch metric filters, we can achieve exactly this goal of alerting us when our application performance is abnormal and our business outcomes at risk. The flow of data in my example is visualized in figure one.
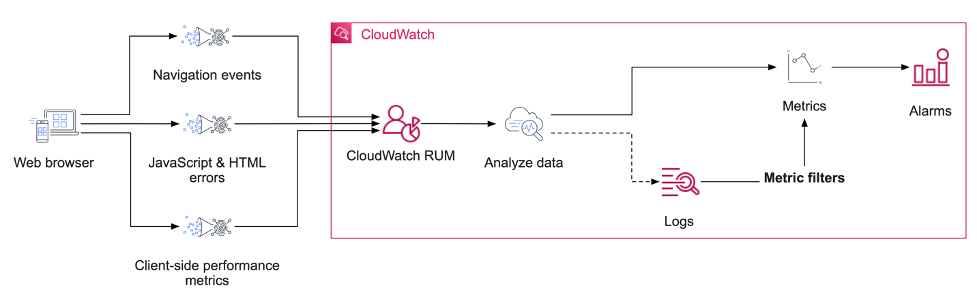
Figure 1: An architectural diagram of services used in this solution.
Exporting data from CloudWatch RUM to CloudWatch Logs
To perform your own granular data inspection, alarms, and metrics based on arbitrary parts of your web application, you must enable the storing of your CloudWatch RUM data in CloudWatch Logs. This can be done when creating your application monitor with the data storage option, or afterward by editing the application configuration in your console.
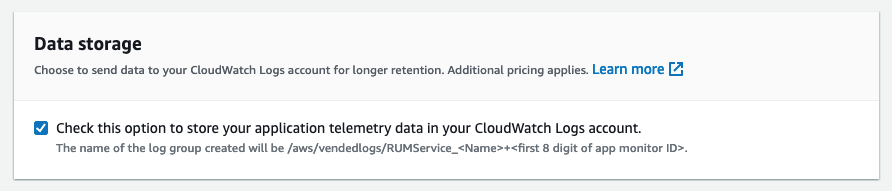
Figure 2: The data storage option enables the storage of CloudWatch telemetry directly into CloudWatch Logs.
With the logging to CloudWatch Logs now enabled, you will see a new log group that has /aws/vendedlogs/RUMService prefixed to it.
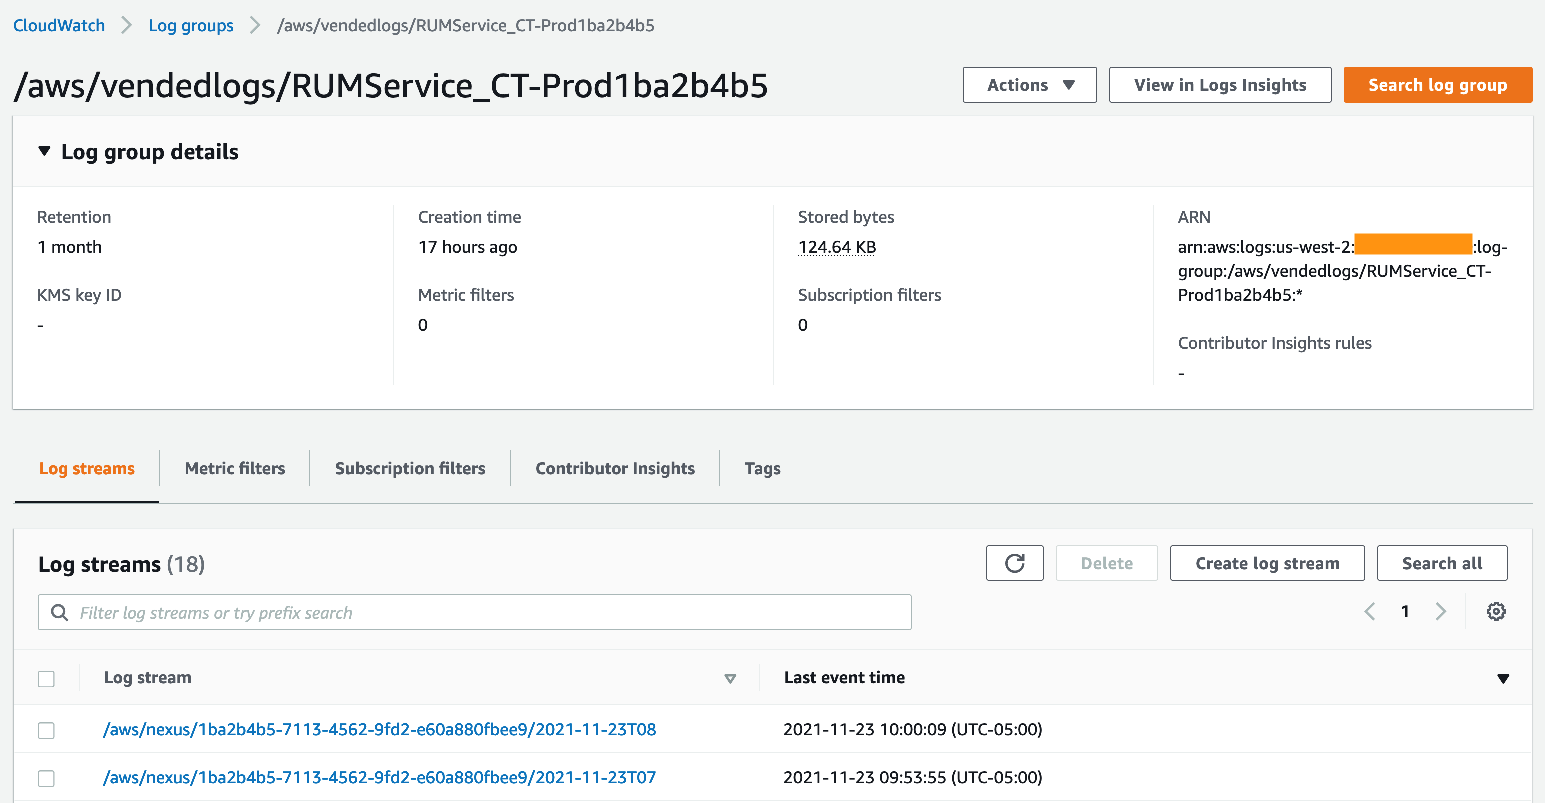
Figure 3: Logs from CloudWatch RUM now appear as a log group.
Examining a single event from a stream will show a great deal of telemetry that has been emitted by the web client. Here, we see an example of a performance event:
{
"event_timestamp": 1637680063000,
"event_type": "com.amazon.rum.performance_resource_event",
"event_id": "11001825-a754-4f24-8435-af55180253c2",
"event_version": "1.0.0",
"log_stream": "2021-11-23T08",
"application_id": "6C879487-BBDC-4080-B9DC-908819D87CD9",
"application_version": "1.0.0",
"metadata": {
"version": "1.0.0",
"browserLanguage": "en-US",
"browserName": "Firefox",
"browserVersion": "91.0",
"osName": "Mac OS",
"osVersion": "10.15",
"deviceType": "desktop",
"platformType": "web",
"domain": "localhost.localdomain",
"title": "Title of the web page",
"pageId": "/core/awesome-page/",
"interaction": 1,
"parentPageId": "/core/overview/",
"countryCode": "US",
"subdivisionCode": "WA"
},
"user_details": {
"sessionId": "14844601-f8ae-4bbf-8d0e-a6b910b46fb7",
"userId": "f9d7bba3-880c-499f-9ea0-c6b48b4f44f0"
},
"event_details": {
"version": "1.0.0",
"initiatorType": "script",
"duration": 72,
"fileType": "script",
"transferSize": 0,
"targetUrl": "https://localhost.localdomain/js/highlight.pack.js?1637619531"
}
}
There is a lot of data to unpack here from this one event, and there are many other event types that we can discuss. However, for the moment, let’s focus on this being an event that tracks the time to fetch a specific resource. I will focus on the highlight.pack.js resource for this example. In this specific instance, the resource required 72 ms to be retrieved by the web browser.
Using Amazon CloudWatch Logs Insights, we can search for all occurrences of highlight.pack.js being retrieved. This is a good step to perform before creating a metric filter, thereby making sure that our data is present and displayed as expected. Our query is as follows:
filter @logStream = ‘yourLogStream’
| filter event_details.targetUrl like /highlight.pack.js/
| fields event_details.duration, @timestamp, @message
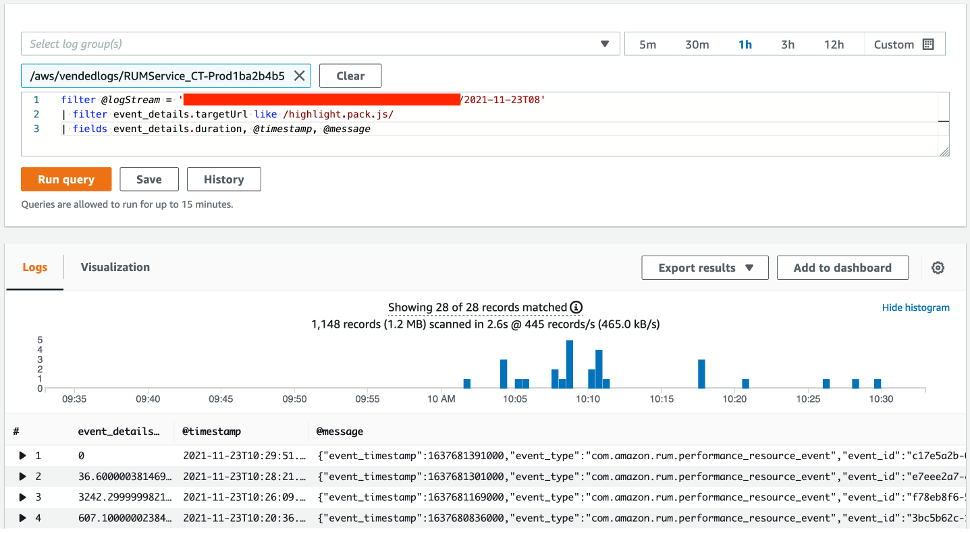
Figure 4: Searching through CloudWatch Logs Insights is performed often through the AWS console.
In this example, you will see that one of the events has a duration of zero milliseconds. This was a cache hit from the local browser and is normal behavior.
Creating metric filters from CloudWatch RUM
Metric filters are a powerful feature of CloudWatch Logs that can count pattern matches in CloudWatch log streams, and even extract values from these logs. Each log entry for the com.amazon.rum.performance_resource_event type can be converted into a metric using a metric filter, and then you can create alarms and even anomaly detection models based on this data.
In our example, we will create a new metric filter specifically for the highlight.pack.js resource, and maintain a metric with the load time of non-zero (i.e., not cached) duration. To this we:
- Visit the log group in the CloudWatch Logs console
- Then, select the vended log group (which starts with
/aws/vendedlogs/RUMService_)
- Select Metric filters
- Finally, select Create metric filter
Our next step is to create the filter pattern. The metric filter query syntax is different from CloudWatch Logs Insights, though still easily accessible. For this resource, we will use this specific query:
{$.event_details.targetUrl = "*highlight.pack.js*" && $.event_details.duration > 0}
Now, select the Select log data to test drop-down and choose a log stream. Then, select Test pattern. If you have data that matches, then it will appear in the following Results window.
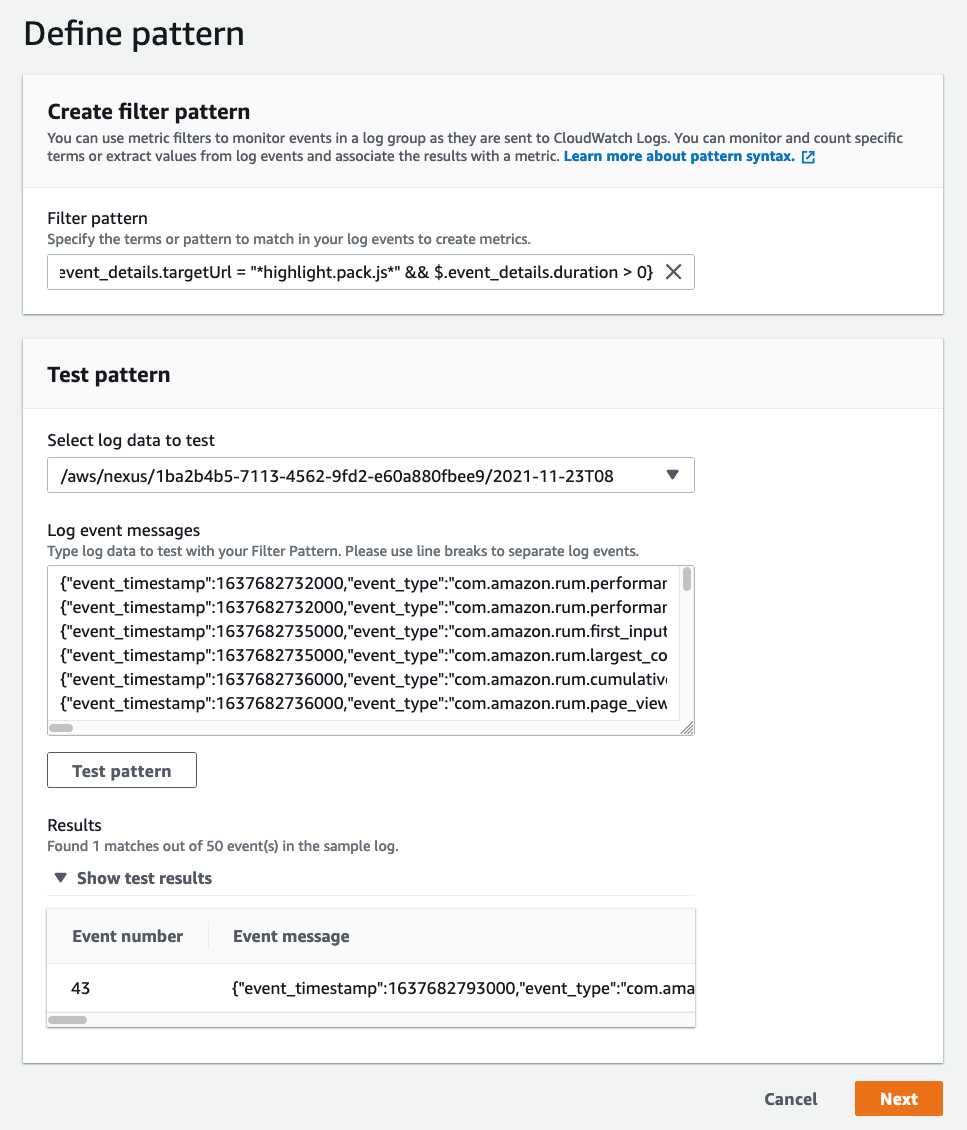
Figure 5: This is an example of the metric filter creation process from the CloudWatch console.
Select Next to proceed to the next step. Now, give the metric filter a name, assign it to a namespace (or create a new one), and name the metric itself (in our example we use highlight.pack.js duration). The Metric_value follows the same JSON matching syntax as the previous step. In this case, it will be $.event_details.duration. Change the Unit to Milliseconds, and then select Next.
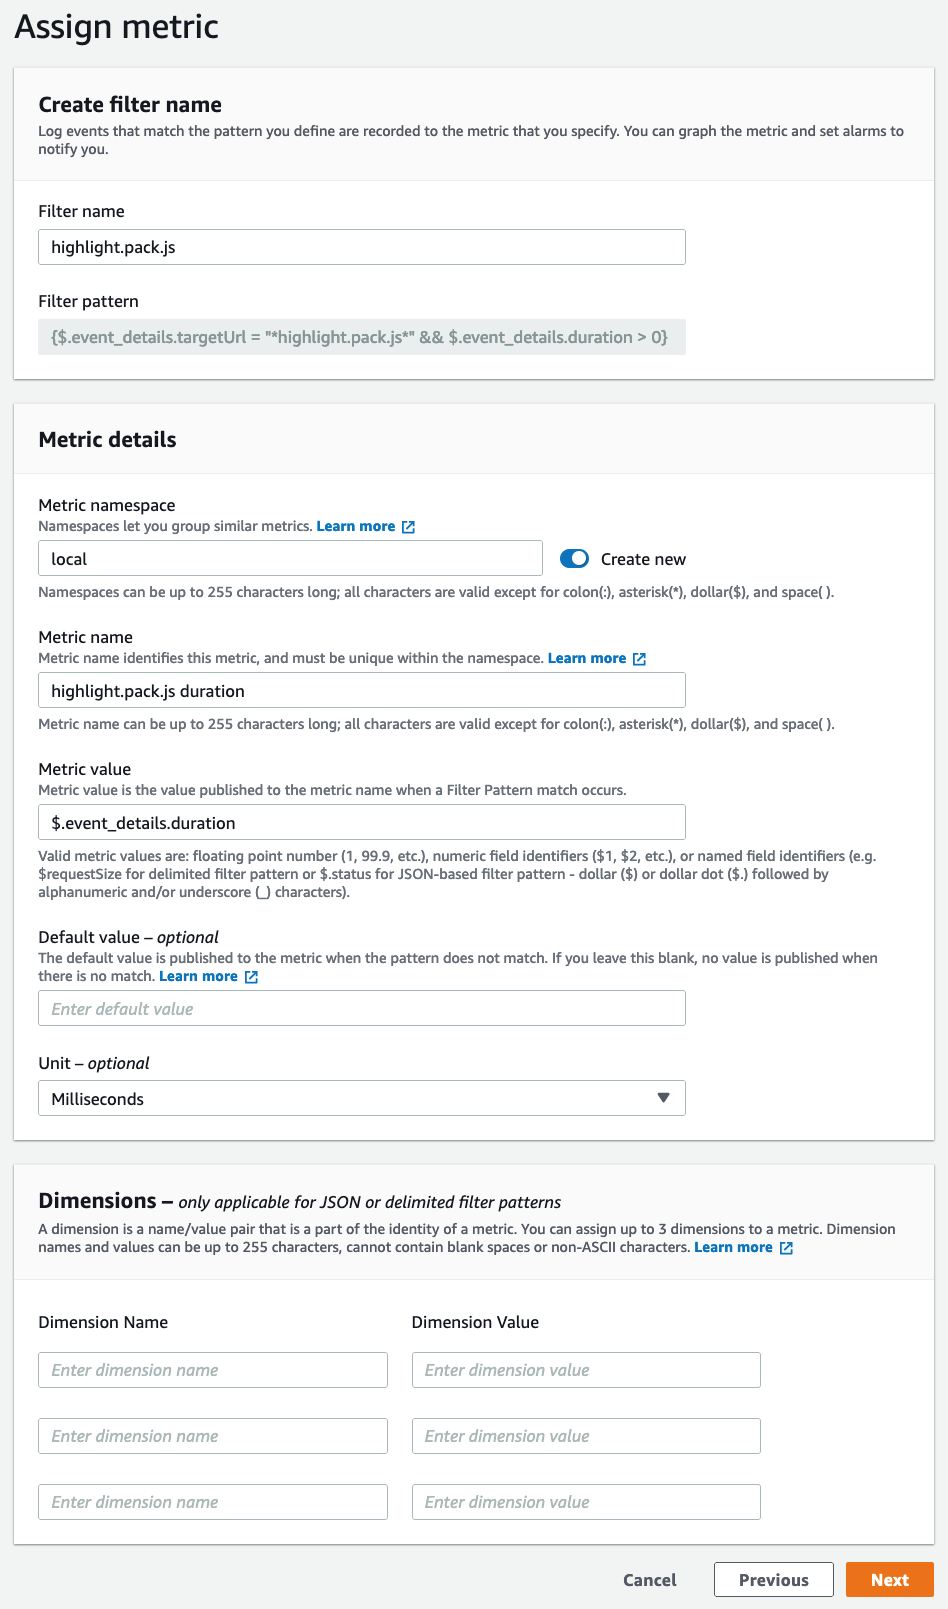
Figure 6: The second step of the metric filter creation process.
On the final page, select Create metric filter. Note that this process can also be performed using the AWS CLI or AWS CloudFormation.
After a few minutes, your metric filter will create your new metric, and now you can view the results of the end-user load time for the highlight.pack.js resource!
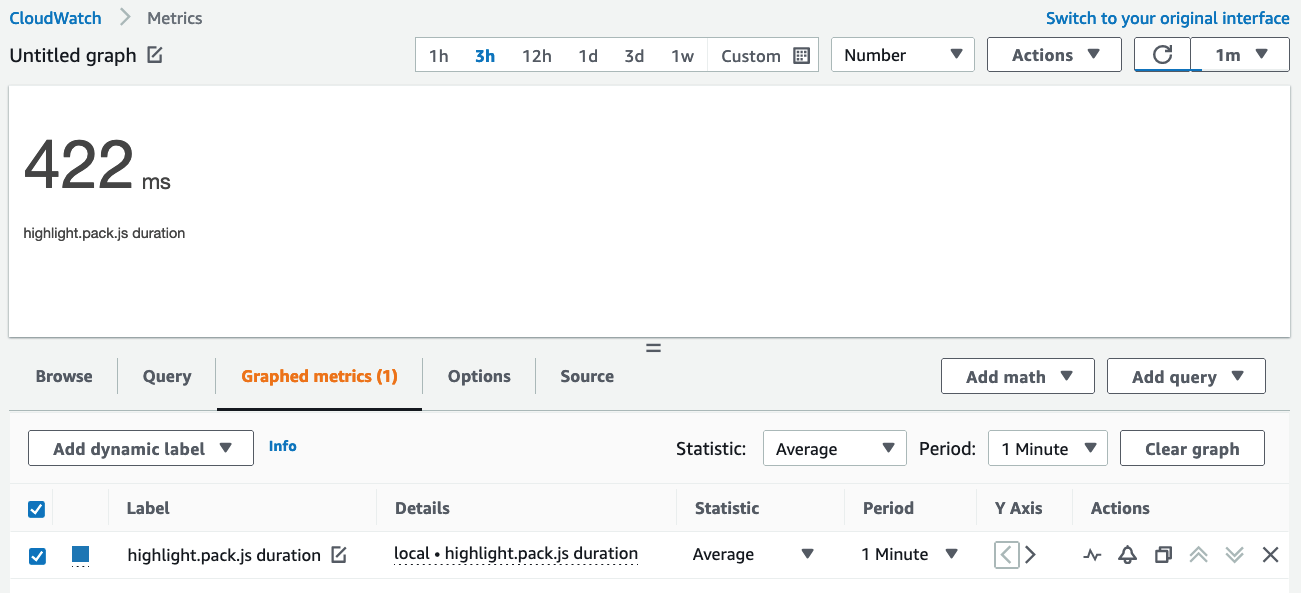
Figure 7: The metrics for our resource load time are now available.
Creating alarms
Now that we have created a metric that reflects the load time for this particular resource, we can use CloudWatch alarms to alert us when the average response time exceeds a reasonable threshold.
You can even filter your data with more granularity if you wish, and target specific browser or device types. A good example is different alarm thresholds for mobile devices, as they may be on networks of varying speeds. Country and subdivision (e.g., US, and Washington State) are also available, and you may wish to target traffic from two regions for a comparative analysis.
For our newly-created metric, we can create an alarm by first selecting the alarm icon in the metrics view:
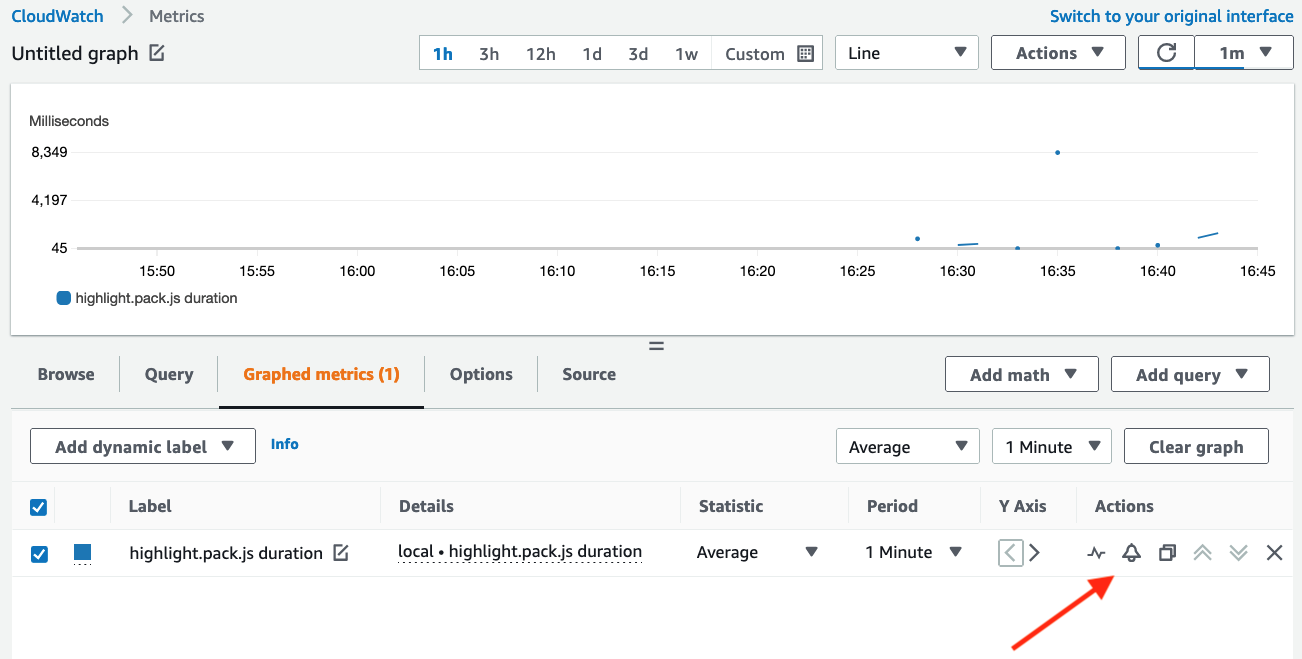
Figure 8: Create alarms by clicking on the alarm icon.
Now you can create your alarm with a threshold value that makes sense for your workload, and even use an anomaly detection model to learn your normal application behavior. This removes the need for you to know these thresholds in advance!
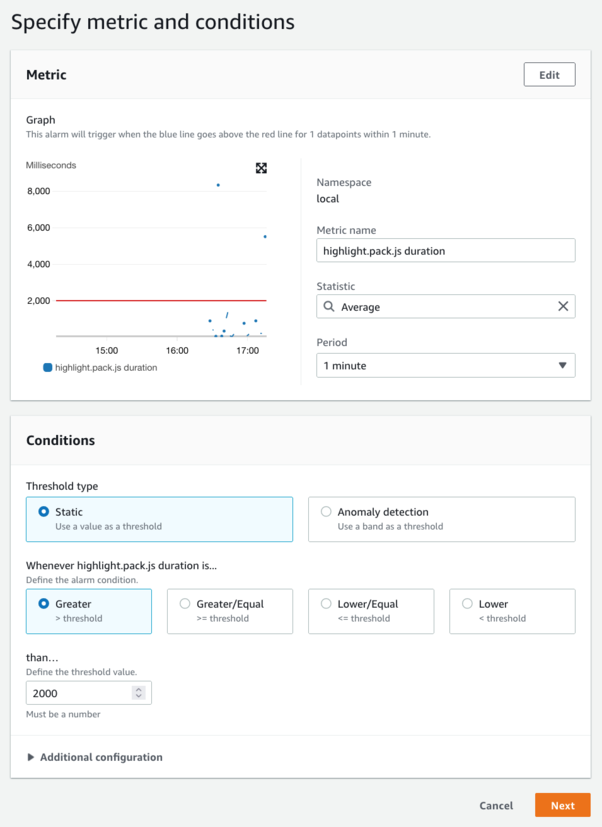
Figure 9: Create an alarm based on load time.
Conclusion
CloudWatch RUM creates a powerful new mechanism to measure the quality of your web applications as they are experienced by users in the real world. When combined with CloudWatch Logs, metric filters, and alarms, you have almost unlimited possibilities for observing and alerting on actual user experience with a new degree of granularity. What we described here only scratches the surface of what you can gain visibility into and build.
Additional resources
You can find additional information about CloudWatch RUM through our official documentation, our launch announcement, and by example through the One Observability Workshop.
Proactive autoscaling of Kubernetes workloads with KEDA using metrics ingested into Amazon Managed Service for Prometheus
=======================
Orchestration platforms such as Amazon EKS and Amazon ECS have simplified the process of building, securing, operating, and maintaining container-based applications, thereby helping organizations focus on building applications. We simplified this further with the launch of AWS Fargate, where customers no longer have to manage Amazon Elastic Compute Cloud (EC2) instances for their Amazon EKS/ECS clusters. Customers have started adopting event-driven deployment, which is the ability to activate a Kubernetes deployment (i.e., no pods to a single pod) and subsequently to more pods based on events from various event sources.
By implementing eventdriven deployment andautoscaling, customers can achieve cost savings by providing on-demand compute and autoscale efficiently based on application logic. Kubernetes supports cluster level autoscaling using cluster autoscaler and application level autoscaling using Horizontal Pod Autoscaler and Vertical Pod Autoscaler. Horizontal Pod Autoscaler (HPA) and Vertical Pod Autoscaler can scale pods based on observed CPU utilization and memory usage. For complex scenarios like eventdriven autoscaling, customers rely on metrics related to application logic.
KEDA (Kubernetes-based Event Driven Autoscaler) lets you drive the autoscaling of Kubernetes workloads based on the number of events, such as a custom metric scraped breaching a specified threshold or when there is a message in the Kafka queue. KEDA is a single-purpose and lightweight component that can be added into any Kubernetes cluster. It works alongside standard Kubernetes components, such as the Horizontal Pod Autoscaler, and can extend functionality without overwriting or duplication. KEDA lets you explicitly map the apps you want to use event-driven scale, while other apps continuing to function. This makes KEDA a flexible and safe option to run alongside any number of other Kubernetes applications or frameworks.
Amazon Managed Service for Prometheus is a serverless, Prometheus-compatible monitoring service for container metrics that makes it easier to securely monitor container environments at scale. Amazon Managed Service for Prometheus lets you use the same opensource Prometheus data model and query language that you use today to monitor the performance of your containerized workloads, and also enjoy improved scalability, availability, and security without having to manage the underlying infrastructure.
In this post, we will show you how you can use KEDA to autoscale Amazon EKS Pods by querying the metrics stored in Amazon Managed Service for Prometheus
Prerequisites
You will need the following to complete the steps in this post:
AWS CLI version 2
eksctl
kubectl
jq
helm
An Amazon Managed Service for Prometheus workspace configured in your AWS account. For instructions, see Create a workspace in the Amazon Managed Service for Prometheus User Guide.
The following diagram shows the complete setup that we will walk through in this blog post
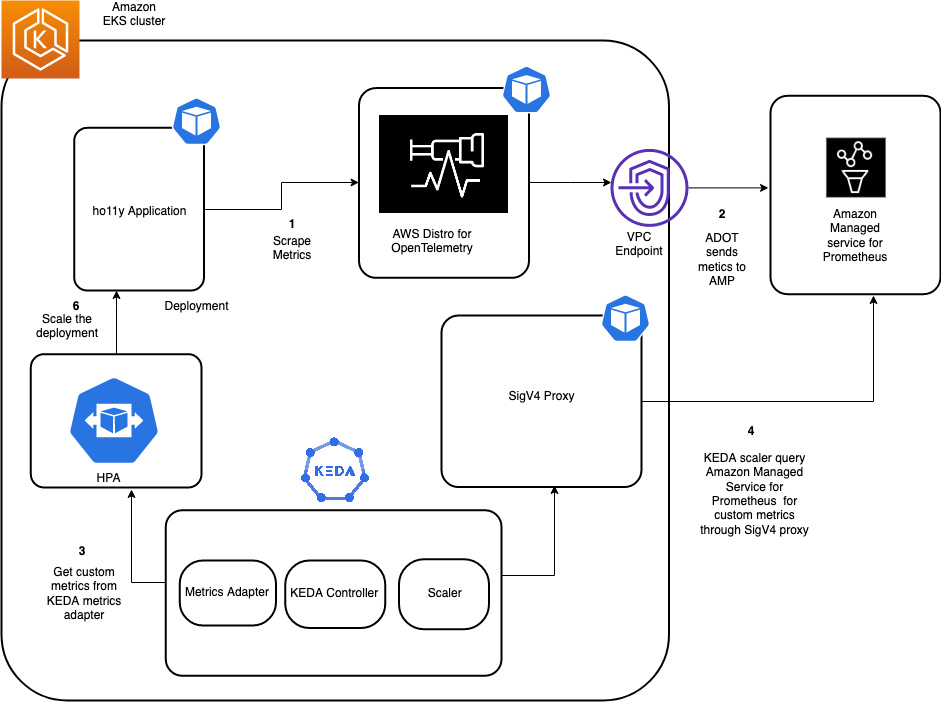
Figure 1: Architecture diagram
Step 1: Create an Amazon EKS Cluster and KEDA operator
First, create an Amazon EKS cluster for running the sample application and the KEDA operator. The eksctl CLI tool will deploy the cluster using the eks-cluster-config.yaml file:
export AMP_KEDA_CLUSTER=AMP-KEDA-CLUSTER
export AMP_ACCOUNT_ID=<Your Account id>
export AWS_REGION=<Your Region>
cat << EOF > eks-cluster-config.yaml
---
apiVersion: eksctl.io/v1alpha5
kind: ClusterConfig
metadata:
name: $AMP_KEDA_CLUSTER
region: $AWS_REGION
version: '1.20'
iam:
withOIDC: true
serviceAccounts:
- metadata:
name: keda-operator
namespace: keda
labels: {aws-usage: "application"}
attachPolicyARNs:
- "arn:aws:iam::aws:policy/AmazonPrometheusQueryAccess"
managedNodeGroups:
- name: default-ng
minSize: 1
maxSize: 3
desiredCapacity: 2
labels: {role: mngworker}
iam:
withAddonPolicies:
certManager: true
cloudWatch: true
cloudWatch:
clusterLogging:
enableTypes: ["*"]
EOF
Execute the following command to create the EKS cluster:
eksctl create cluster -f eks-cluster-config.yaml
This creates an Amazon EKS cluster named AMP-KEDA-CLUSTER and a service account named keda-operator that the KEDA scaler will use.
KEDA performs two key roles within Kubernetes: The Agent activates and deactivates Kubernetes Deployments to scale to and from zero on no events. This is one of the primary roles of the keda-operator container that runs when you install KEDA. KEDA also acts as a Kubernetes metrics server that exposes rich event data, such as queue length or any custom metric to the Horizontal Pod Autoscaler to drive scale out. It is up to the Deployment to consume the events directly from the source. This preserves rich event integration and enables gestures like completing or abandoning queue messages to work out of the box. The metric serving is the primary role of the keda-operator-metrics-apiserver container that runs when you install KEDA.
Next, use the following commands to install the keda operator in the Keda namespace:
helm repo add kedacore https://kedacore.github.io/charts
We will create the values.yaml for the KEDA operator to set the right security context:
cat << EOF > values.yaml
operator:
name: keda-operator
podSecurityContext:
fsGroup: 1001
securityContext:
runAsGroup: 1001
runAsUser: 1001
serviceAccount:
create: false
name: keda-operator
EOF
helm install keda kedacore/keda --namespace keda -f values.yaml
We can describe the pods in the Keda namespace to verify:
Admin:~/environment $ kubectl get pods -n keda
NAME                                              READY   STATUS    RESTARTS   AGE
keda-operator-6d74df9577-vc6gs                    1/1     Running   0          48s
keda-operator-metrics-apiserver-fc6df469f-vlf9r   1/1     Running   0          48s
Step 2: Create an Amazon Managed Service for Prometheus workspace
The Amazon Managed Service for Prometheus workspace ingests the Prometheus metrics collected from envoy. A workspace is a logical and isolated Prometheus server dedicated to Prometheus resources such as metrics. A workspace supports fine-grained access control for authorizing its management, such as update, list, describe, and delete, as well as ingesting and querying metrics.
aws amp create-workspace --alias AMP-KEDA --region $AWS_REGION
Next, optionally create an interface VPC endpoint to securely access the managed service from resources deployed in your VPC. This makes sure that data ingested by the managed service won’t leave your AWS account VPC. Utilize the AWS CLI as shown here. Replace the placeholder strings, such as VPC_ID, AWS_REGION, with your values.
export VPC_ID=<Your EKS Cluster VPC Id> aws ec2 create-vpc-endpoint \ --vpc-id $VPC_ID \ --service-name com.amazonaws.<$AWS_REGION>.aps-workspaces \ --security-group-ids <SECURITY_GROUP_IDS> \ --vpc-endpoint-type Interface \ --subnet-ids <SUBNET_IDS>
Step 3: Deploy sample application and scrape metrics using AWS Distro for OpenTelemetry
In this post, we will use a sample application called ho11y, which is a synthetic signal generator letting you test observability solutions for microservices. It emits logs, metrics, and traces in a configurable manner.
To install the application, execute the following commands:
git clone https://github.com/aws-observability/aws-o11y-recipes.git
cd ./aws-o11y-recipes/sandbox/ho11y/
docker build . -t "$AMP_ACCOUNT_ID.dkr.ecr.$AWS_REGION.amazonaws.com/ho11y:latest
aws ecr get-login-password --region $AWS_REGION | docker login --username AWS --password-stdin  "$ACCOUNT_ID.dkr.ecr.$AWS_REGION.amazonaws.com"
aws ecr create-repository --repository-name ho11y
docker push "$ACCOUNT_ID.dkr.ecr.$AWS_REGION.amazonaws.com/ho11y:latest"
kubectl create namespace ho11y
cat << EOF > holly.yaml
---
apiVersion: apps/v1
kind: Deployment
metadata:
name: frontend
spec:
selector:
matchLabels:
app: frontend
replicas: 1
template:
metadata:
labels:
app: frontend
spec:
containers:
- name: ho11y
image: "$ACCOUNT_ID.dkr.ecr.$AWS_REGION.amazonaws.com/ho11y:latest"
ports:
- containerPort: 8765
env:
- name: DISABLE_OM
value: "on"
- name: HO11Y_LOG_DEST
value: "stdout"
- name: OTEL_RESOURCE_ATTRIB
value: "frontend"
- name: OTEL_EXPORTER_OTLP_ENDPOINT
value: "adot:4317"
- name: HO11Y_INJECT_FAILURE
value: "enabled"
- name: DOWNSTREAM0
value: "http://downstream0"
- name: DOWNSTREAM1
value: "http://downstream1"
imagePullPolicy: Always
---
apiVersion: apps/v1
kind: Deployment
metadata:
name: downstream0
spec:
selector:
matchLabels:
app: downstream0
replicas: 1
template:
metadata:
labels:
app: downstream0
spec:
containers:
- name: ho11y
image: public.ecr.aws/mhausenblas/ho11y:stable
ports:
- containerPort: 8765
env:
- name: DISABLE_OM
value: "on"
- name: HO11Y_LOG_DEST
value: "stdout"
- name: OTEL_RESOURCE_ATTRIB
value: "downstream0"
- name: OTEL_EXPORTER_OTLP_ENDPOINT
value: "adot:4317"
- name: DOWNSTREAM0
value: "https://mhausenblas.info/"
imagePullPolicy: Always
---
apiVersion: apps/v1
kind: Deployment
metadata:
name: downstream1
spec:
selector:
matchLabels:
app: downstream1
replicas: 1
template:
metadata:
labels:
app: downstream1
spec:
containers:
- name: ho11y
image: public.ecr.aws/mhausenblas/ho11y:stable
ports:
- containerPort: 8765
env:
- name: DISABLE_OM
value: "on"
- name: HO11Y_LOG_DEST
value: "stdout"
- name: OTEL_RESOURCE_ATTRIB
value: "downstream1"
- name: OTEL_EXPORTER_OTLP_ENDPOINT
value: "adot:4317"
- name: DOWNSTREAM0
value: "https://o11y.news/2021-03-01/"
- name: DOWNSTREAM1
value: "DUMMY:187kB:42ms"
- name: DOWNSTREAM2
value: "DUMMY:13kB:2ms"
imagePullPolicy: Always
---
apiVersion: v1
kind: Service
metadata:
name: frontend
spec:
ports:
- port: 80
targetPort: 8765
selector:
app: frontend
---
apiVersion: v1
kind: Service
metadata:
name: downstream0
spec:
ports:
- port: 80
targetPort: 8765
selector:
app: downstream0
---
apiVersion: v1
kind: Service
metadata:
name: downstream1
spec:
ports:
- port: 80
targetPort: 8765
selector:
app: downstream1
---
EOF
kubectl apply -f holly.yaml -n ho11y
This will create three deployments: frontend, downstream0, and downstream1 and 3 services for each deployment.
Admin:~/environment $ kubectl get deployments -n ho11y
NAME          READY   UP-TO-DATE   AVAILABLE   AGE
downstream0   2/2     2            2           4d2h
downstream1   1/1     1            1           4d2h
frontend      1/1     1            1           4d2h
Admin:~/environment $ kubectl get svc -n ho11y
NAME          TYPE        CLUSTER-IP     EXTERNAL-IP   PORT(S)   AGE
downstream0   ClusterIP   10.100.6.63    <none>        80/TCP    4d2h
downstream1   ClusterIP   10.100.8.55    <none>        80/TCP    4d2h
frontend      ClusterIP   10.100.83.92   <none>        80/TCP    4d2h
Next, we will have to deploy a collector that can scrape the application metrics emitted by ho11y. Amazon Managed Service for Prometheus does not directly scrape operational metrics from containerized workloads in a Kubernetes cluster. You must deploy and manage a Prometheus server or an OpenTelemetry agent, such as the AWS Distro for OpenTelemetry Collector (ADOT) or the Grafana Agent to perform this task. The ADOT-AMP pipeline lets us use the ADOT Collector to scrape a Prometheus-instrumented application, and then send the scraped metrics to Amazon Managed Service for Prometheus.
This post will also walk you through the steps to configure an AWS Identity and Access Management (IAM) role to send Prometheus metrics to Amazon Managed Service for Prometheus. We install the ADOT collector on the Amazon EKS cluster and forward metrics to Amazon Managed Service for Prometheus.
Configure permissions
We will be deploying the ADOT collector to run under the identity of a Kubernetes service account “amp-iamproxy-service-account”. IAM roles for service accounts (IRSA) lets you associate the AmazonPrometheusRemoteWriteAccess role with a Kubernetes service account, thereby providing IAM permissions to any pod utilizing the service account to ingest the metrics to Amazon Managed Service for Prometheus.
You need kubectl and eksctl CLI tools to run the script. They must be configured to access your Amazon EKS cluster.
eksctl create iamserviceaccount --name adot-collector --namespace ho11y --cluster $AMP_KEDA_CLUSTER --attach-policy-arn arn:aws:iam::aws:policy/AmazonPrometheusRemoteWriteAccess --approve
export WORKSPACE=$(aws amp list-workspaces | jq -r '.workspaces[] | select(.alias=="AMP-KEDA").workspaceId')
export REGION=$AWS_REGION
export REMOTE_WRITE_URL="https://aps-workspaces.$REGION.amazonaws.com/workspaces/$WORKSPACE/api/v1/remote_write"
Now create a manifest file, amp-eks-adot-prometheus-daemonset.yaml, with the scrape configuration to extract envoy metrics and deploy the ADOT collector. This example deploys a deployment named adot. The adot deployment collects metrics from pods on the cluster.
cat << EOF > amp-eks-adot-prometheus-daemonset.yaml
---
apiVersion: v1
kind: ConfigMap
metadata:
name: adot-collector
labels:
app: aws-adot
component: adot-collector
data:
adot-collector-config: |
receivers:
otlp:
protocols:
grpc:
endpoint: 0.0.0.0:4317
http:
endpoint: 0.0.0.0:55681
awsxray:
endpoint: 0.0.0.0:2000
transport: udp
prometheus:
config:
global:
scrape_interval: 15s
scrape_timeout: 10s
scrape_configs:
- job_name: kubernetes-service-endpoints
kubernetes_sd_configs:
- role: endpoints
relabel_configs:
- action: keep
regex: true
source_labels: [__meta_kubernetes_service_annotation_prometheus_io_scrape]
- action: replace
regex: (https?)
source_labels: [__meta_kubernetes_service_annotation_prometheus_io_scheme]
target_label: __scheme__
- action: replace
regex: (.+)
source_labels: [__meta_kubernetes_service_annotation_prometheus_io_path]
target_label: __metrics_path__
- action: replace
regex: ([^:]+)(?::\d+)?;(\d+)
replacement: $$1:$$2
source_labels:
- __address__
- __meta_kubernetes_service_annotation_prometheus_io_port
target_label: __address__
- action: labelmap
regex: __meta_kubernetes_service_label_(.+)
- action: replace
source_labels: [__meta_kubernetes_namespace]
target_label: k8s_namespace
- action: replace
source_labels: [__meta_kubernetes_service_name]
target_label: k8s_service
- action: replace
source_labels: [__meta_kubernetes_pod_node_name]
target_label: k8s_node
- action: replace
source_labels: [__meta_kubernetes_pod_name]
target_label: k8s_pod
- action: replace
source_labels: [__meta_kubernetes_pod_container_name]
target_label: k8s_container
- job_name: adot
kubernetes_sd_configs:
- role: pod
relabel_configs:
- action: replace
regex: ([^:]+)(?::\d+)?
replacement: $${1}:8888
source_labels: [__address__]
target_label: __address__
- action: replace
source_labels: [__meta_kubernetes_namespace]
target_label: k8s_namespace
- action: replace
source_labels: [__meta_kubernetes_pod_name]
target_label: k8s_pod
- action: keep
source_labels: [__meta_kubernetes_pod_label_app]
regex: adot
- job_name: ho11y
kubernetes_sd_configs:
- role: pod
relabel_configs:
- action: replace
source_labels: [__meta_kubernetes_namespace]
target_label: k8s_namespace
- action: replace
source_labels: [__meta_kubernetes_pod_name]
target_label: k8s_pod
- action: keep
source_labels: [__meta_kubernetes_pod_label_app]
regex: frontend|downstream(.*)
processors:
batch/traces:
timeout: 1s
send_batch_size: 20
batch/metrics:
timeout: 10s
exporters:
awsxray:
awsemf:
awsprometheusremotewrite:
endpoint: "$REMOTE_WRITE_URL"
aws_auth:
region: "$REGION"
service: "aps"
logging:
loglevel: debug
extensions:
health_check:
pprof:
zpages:
service:
extensions: [pprof, zpages, health_check]
pipelines:
traces:
receivers: [otlp, awsxray]
processors: [batch/traces]
exporters: [awsxray]
metrics:
receivers: [prometheus]
processors: [batch/metrics]
exporters: [logging, awsprometheusremotewrite]
---
kind: ClusterRole
apiVersion: rbac.authorization.k8s.io/v1
metadata:
name: adot-collector
rules:
- apiGroups: [""]
resources:
- nodes
- nodes/proxy
- services
- endpoints
- pods
verbs: ["get", "list", "watch"]
- apiGroups:
- extensions
resources:
- ingresses
verbs: ["get", "list", "watch"]
- nonResourceURLs: ["/metrics"]
verbs: ["get"]
---
kind: ClusterRoleBinding
apiVersion: rbac.authorization.k8s.io/v1
metadata:
name: adot-collector-binding
subjects:
- kind: ServiceAccount
name: adot-collector
namespace: ho11y
roleRef:
kind: ClusterRole
name: adot-collector
apiGroup: rbac.authorization.k8s.io
---
apiVersion: apps/v1
kind: Deployment
metadata:
name: adot
labels:
app: aws-adot
component: adot-collector
spec:
selector:
matchLabels:
app: adot
replicas: 1
template:
metadata:
labels:
app: adot
spec:
serviceAccountName: adot-collector
containers:
- name: adot-collector
image: public.ecr.aws/aws-observability/aws-otel-collector:v0.11.0
command:
- "/awscollector"
- "--config=/conf/adot-collector-config.yaml"
- "--log-level=DEBUG"
ports:
- containerPort: 55681
- containerPort: 55680
- containerPort: 4317
- containerPort: 8888
env:
- name: AWS_REGION
value: "$REGION"
volumeMounts:
- name: adot-collector-config-vol
mountPath: /conf
livenessProbe:
httpGet:
path: /
port: 13133
readinessProbe:
httpGet:
path: /
port: 13133
volumes:
- configMap:
name: adot-collector
items:
- key: adot-collector-config
path: adot-collector-config.yaml
name: adot-collector-config-vol
---
apiVersion: v1
kind: Service
metadata:
name: adot
labels:
app: aws-adot
component: adot-collector
spec:
ports:
- name: receiver-http
port: 55681
- name: receiver-grpc-legacy
port: 55680
- name: receiver-grpc
port: 4317
- name: metrics
port: 8888
selector:
app: adot
---
EOF
kubectl apply -f amp-eks-adot-prometheus-daemonset.yaml -n ho11y
After the ADOT collector is deployed, it will collect the metrics and ingest them into the specified Amazon Managed Service for Prometheus workspace. The scrape configuration is similar to that of a Prometheus server. We have added the necessary configuration for scraping the ho11y metrics.
Step 4: Configure sigv4 authentication for querying Amazon Managed Service for Prometheus and setup autoscaling using KEDA scaled object
AWS Signature Version 4 is a process to add authentication information to requests made to AWS APIs using HTTP. The AWS Command Line Interface (AWS CLI) and the AWS SDKs already use this protocol to make calls to the AWS APIs. Amazon Managed Service for Prometheus requires the API calls to have sigv4 authentication, and since KEDA doesn’t support sigv4, we will be deploying a sigv4 proxy service to act as a gateway for KEDA to access the query endpoint of the Amazon Managed Service for Prometheus.
Execute the following commands to deploy the sig-v4 proxy:
cat << EOF > keda-sigv4.yaml
---
apiVersion: apps/v1
kind: Deployment
metadata:
labels:
app: keda-sigv4
name: keda-sigv4
namespace: keda
spec:
replicas: 1
selector:
matchLabels:
app: keda-sigv4
template:
metadata:
labels:
app: keda-sigv4
name: keda-sigv4
spec:
serviceAccountName: keda-operator
containers:
- name: aws-iamproxy
image: public.ecr.aws/aws-observability/aws-sigv4-proxy:1.0
args:
- --name
- aps
- --region
- $REGION
- --host
- aps-workspaces.us-east-1.amazonaws.com
ports:
- containerPort: 8080
---
apiVersion: v1
kind: Service
metadata:
name: keda-sigv4
namespace: keda
spec:
ports:
- port: 80
targetPort: 8080
selector:
app: keda-sigv4
---
EOF
kubectl apply -f keda-sigv4.yaml
Let’s create the ScaledObject that will scale the deployment by querying the metrics stored in Amazon Managed Service for Prometheus.
A ScaledObject represents the desired mapping between an event source, such as a Prometheus metric and the Kubernetes Deployment, StatefulSet, or any Custom Resource that defines /scale subresource.
Behind the scenes, KEDA acts to monitor the event source and feed that data to Kubernetes and the HPA (Horizontal Pod Autoscaler) to drive the rapid scale of a resource. Each replica of a resource is actively pulling items from the event source.
KEDA also supports the scaling behavior that we configure in Horizontal Pod Autoscaler. This means that we can configure pollingInterval, cooldownPeriod, fallback configuration and make your scaling even more powerful.
The following commands will deploy the scaledobject named ho11y-hpa that will query the Amazon Managed Service for Prometheus query endpoint for a metric called holly_total.
holly_total metric represents the number of invokes of the application, and the threshold is specified as 1. Depending on the value over a period of one minute, you can scale in/out the downstream0 deployment between 1 and 10 pods.
cat << EOF > scaledobject.yaml
---
apiVersion: keda.sh/v1alpha1
kind: ScaledObject
metadata:
name: ho11y-hpa
namespace: ho11y
spec:
scaleTargetRef:
apiVersion: apps/v1
kind: Deployment
name: downstream0
pollingInterval:  30
cooldownPeriod:   300
fallback:
failureThreshold: 3
replicas: 2
minReplicaCount: 1        # Optional. Default: 0
maxReplicaCount: 10       # Optional. Default: 100
triggers:
- type: prometheus
metadata:
serverAddress: http://keda-sigv4.keda.svc.cluster.local/workspaces/$WORKSPACE
metricName: ho11y_total
awsRegion: "us-east-1"
identityOwner: operator
threshold: '1'
# Note: query must return a vector/scalar single element response
query: rate(ho11y_total[1m])
---
EOF
kubectl apply -f scaledobject.yaml
Once we deploy the scaledobject, the KEDA will also create a HPA object in the ho11y namespace with the configuration specified in the scaledobject.yaml:
Admin:~/environment $ kubectl get hpa -n ho11y
NAME                 REFERENCE                TARGETS        MINPODS   MAXPODS   REPLICAS   AGE
keda-hpa-ho11y-hpa   Deployment/downstream0   0/1 (avg)   1         10        1          43m
Let’s put some load on the application by running the following command:
frontend_pod=`kubectl get pod -n ho11y --no-headers -l app=frontend  -o jsonpath='{.items[*].metadata.name}'`
loop_counter=0
while [ $loop_counter -le 300 ] ; do kubectl exec -n ho11y -it $frontend_pod  -- curl downstream0.ho11y.svc.cluster.local; echo ; loop_counter=$[$loop_counter+1];done
Describing the HPA should show something such as the following:
$ kubectl describe hpa -n ho11y
Name:                                                                                                                       keda-hpa-ho11y-hpa
Namespace:                                                                                                                  holly
Labels:                                                                                                                     app.kubernetes.io/managed-by=keda-operator
app.kubernetes.io/name=keda-hpa-ho11y-hpa
app.kubernetes.io/part-of=ho11y-hpa
app.kubernetes.io/version=2.4.0
scaledobject.keda.sh/name=ho11y-hpa
Annotations:                                                                                                                <none>
CreationTimestamp:                                                                                                          Fri, 12 Nov 2021 17:49:24 +0000
Reference:                                                                                                                  Deployment/downstream0
Events:
Type     Reason                        Age                  From                       Message
----     ------                        ----                 ----                       -------
Normal   SuccessfulRescale             40m                  horizontal-pod-autoscaler  New size: 2; reason: external metric prometheus-http---10-100-166-65-workspaces-ws-597472e4-0868-4752-a5d5-9b654b86b9a5-ho11y_total(&LabelSelector{MatchLabels:map[string]string{scaledobject.keda.sh/name: ho11y-hpa,},MatchExpressions:[]LabelSelectorRequirement{},}) above target
This confirms that the KEDA could successfully scale the application using the metrics ingested into Amazon Managed Service for Prometheus.
Clean-up
Use the following commands to delete resources created during this post:
aws amp delete-workspace --workspace-id $WORKSPACE
eksctl delete cluster $AMP_KEDA_CLUSTER
Conclusion
This post demonstrated how we can utilize KEDA operator to autoscale deployments based on some custom metrics stored in Amazon Managed Service for Prometheus. This helps customers provide on-demand compute by provisioning the pods only when they must have them. Amazon Managed Service for Prometheus lets you store the metrics reliably, and KEDA can monitor and scale the workloads out/in efficiently based on the events as they occur.
Further Reading
KEDA Concepts
Getting Started with Amazon Managed Service for Prometheus
AWS One Observability Demo Workshop: What’s new with Prometheus, Grafana, and OpenTelemetry
Using Prometheus Adapter to autoscale applications running on Amazon EKS
How to fix SSH issues on EC2 Linux instances using AWS Systems Manager
=======================
In a previous blog post, we provided a walkthrough of how to fix unreachable Amazon EC2 Windows instances using the EC2Rescue for Windows tool. In this blog post, I will walk you through how to utilize EC2Rescue for Linux to fix unreachable Linux instances. This Knowledge Center Article describes how EC2Rescue for Linux can be used to “manually” fix common issues, such as OpenSSH file permissions, or gather system (OS) logs for analysis and troubleshooting. This blog post will demonstrate how the AWS Systems Manager AWSSupport-ExecuteEC2Rescue automation document can automate the same process smoothly.
Walkthrough
The AWS Systems Manager Automation Document, “AWSSupport-ExecuteEC2Rescue” uses the EC2Rescue for Linux and EC2Rescue for Windows tools.
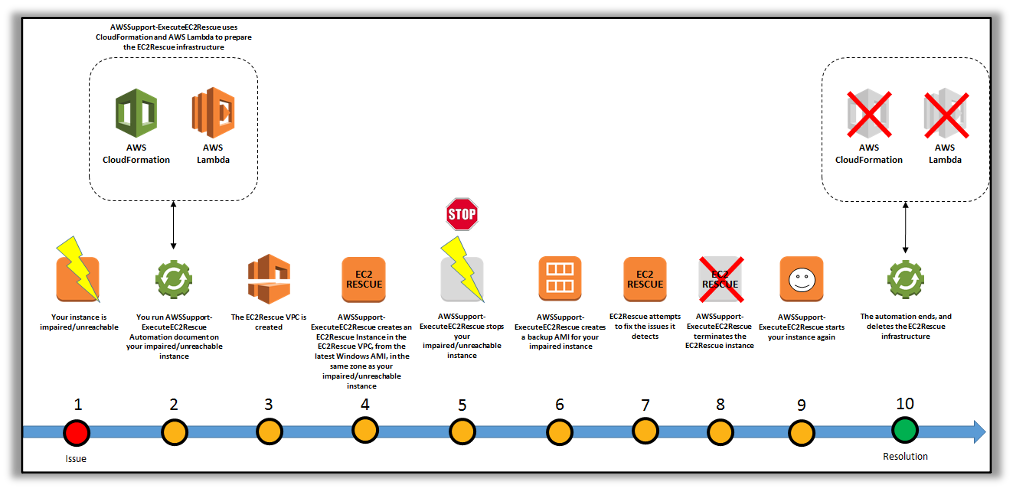
The Automation document runs EC2Rescue for Linux on an offline instance by creating rescue EC2 instance, moving the target instance root volume to the rescue instance, and later reattaching the root volume to the original instance. These are conducted via an automated set of steps in the document::
- Specify the Instance ID of the unreachable instance and run the Automation workflow.
- The document creates a temporary Amazon VPC, and then it runs a series of AWS Lambda functions in order to configure the VPC. Otherwise, you can input the Subnet ID (optional) for the EC2 Rescue instance to be launched.
- The document identifies a subnet for your temporary VPC in the same Availability Zone as your original instance.
- The document launches a temporary, AWS Systems Manager enabled helper instance.
- The document stops your original instance, and then creates a backup. Next, it attaches the original root volume to the helper instance.
- The document utilizes Run Command to run EC2Rescue on the helper instance. EC2Rescue identifies and attempts to fix issues on the attached, original root volume. When finished, EC2Rescue reattaches the root volume back to the original instance.
- The document restarts your original instance, and then terminates the temporary instance. The system also terminates the temporary VPC and the Lambda functions created at the start of the automation.
Note: You do not need to worry about the problematic unreachable instance in order to have an SSM agent installed, because, as per workflow of this document, it will launch a rescue Instance that will have SSM-enabled.
To know more about this document walkthrough, check here.
Prerequisites
Before proceeding with the next steps, you need the following prerequisites:
Instance ID of the unreachable instance. You will specify this ID in the procedure. This is a required parameter.
In addition, the document takes optional parameters that you can refer here.
An IAM role for this execution of this document. If no role is specified, AWS Systems Manager Automation will utilize your IAM permissions to execute this document. To know more about granting permissions by using IAM policies, refer here.
Next, I will illustrate how this document works with an example of a common Linux SSH issue.
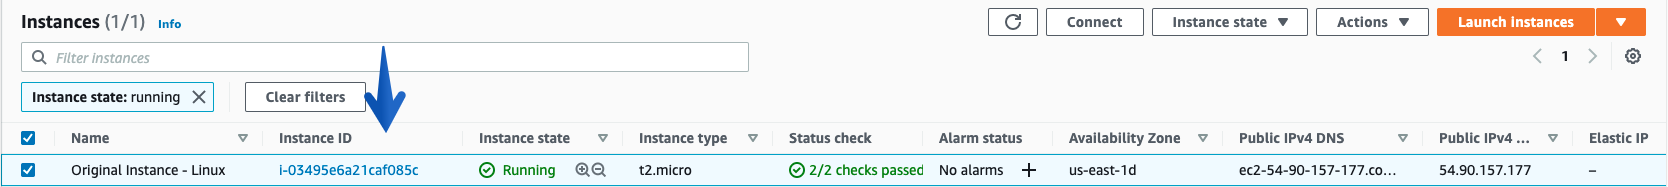
Under EC2 console, I have selected the test instance where I will be modifying the permissions of /home/ec2-user for this example.
Issue: I have changed permissions of /home directory to 777 and now I am not able to SSH and getting a “Permission denied” error

Checking SSH output:
# ssh -i “Linux.pem” ec2-user@ec2-54-90-157-177.compute.amazonaws.com
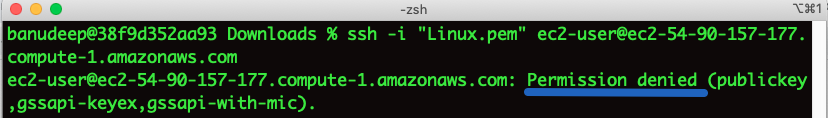
Getting the permission denied error.
Now, let’s use “AWSSupport-ExecuteEC2Rescue” Automation Document to fix this issue:
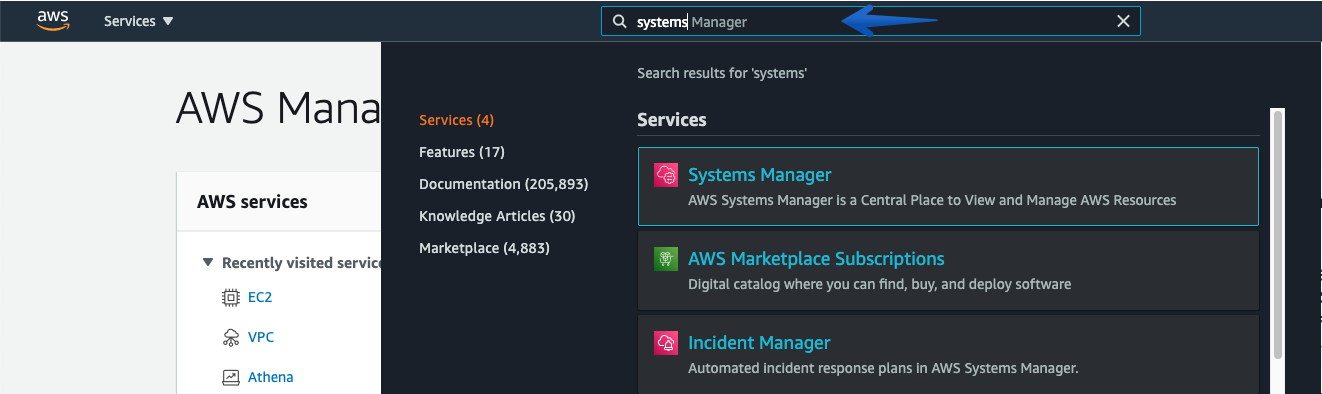
Open the AWS Systems Manager via AWS Management Console, and Type “Systems Manager“
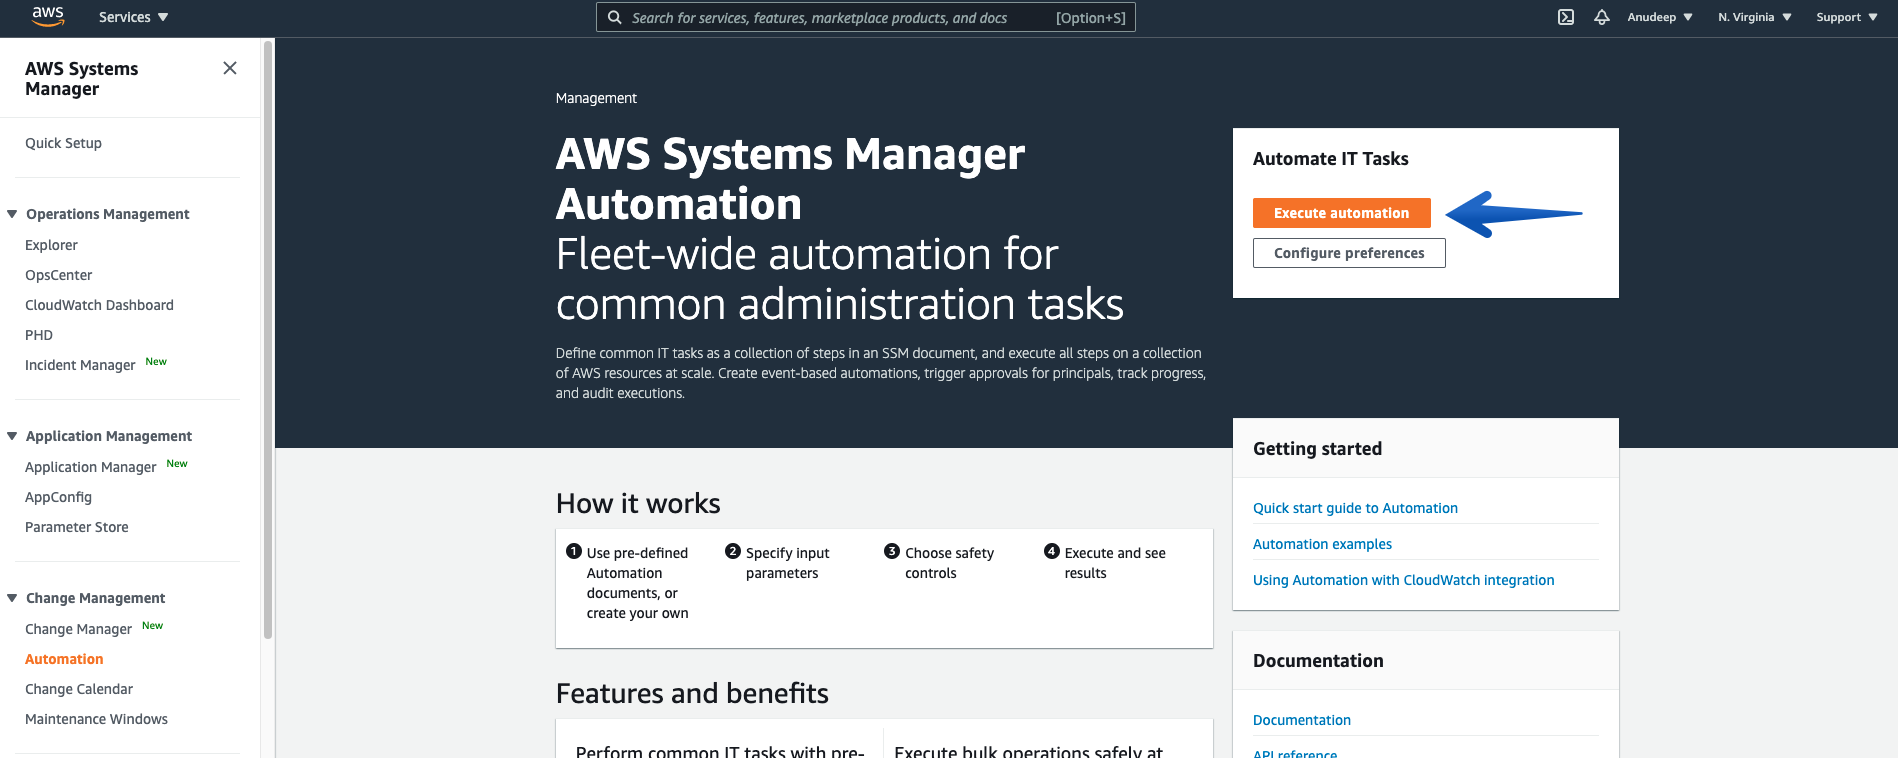
In the navigation pane, choose Automation—-> Choose Execute Automation.
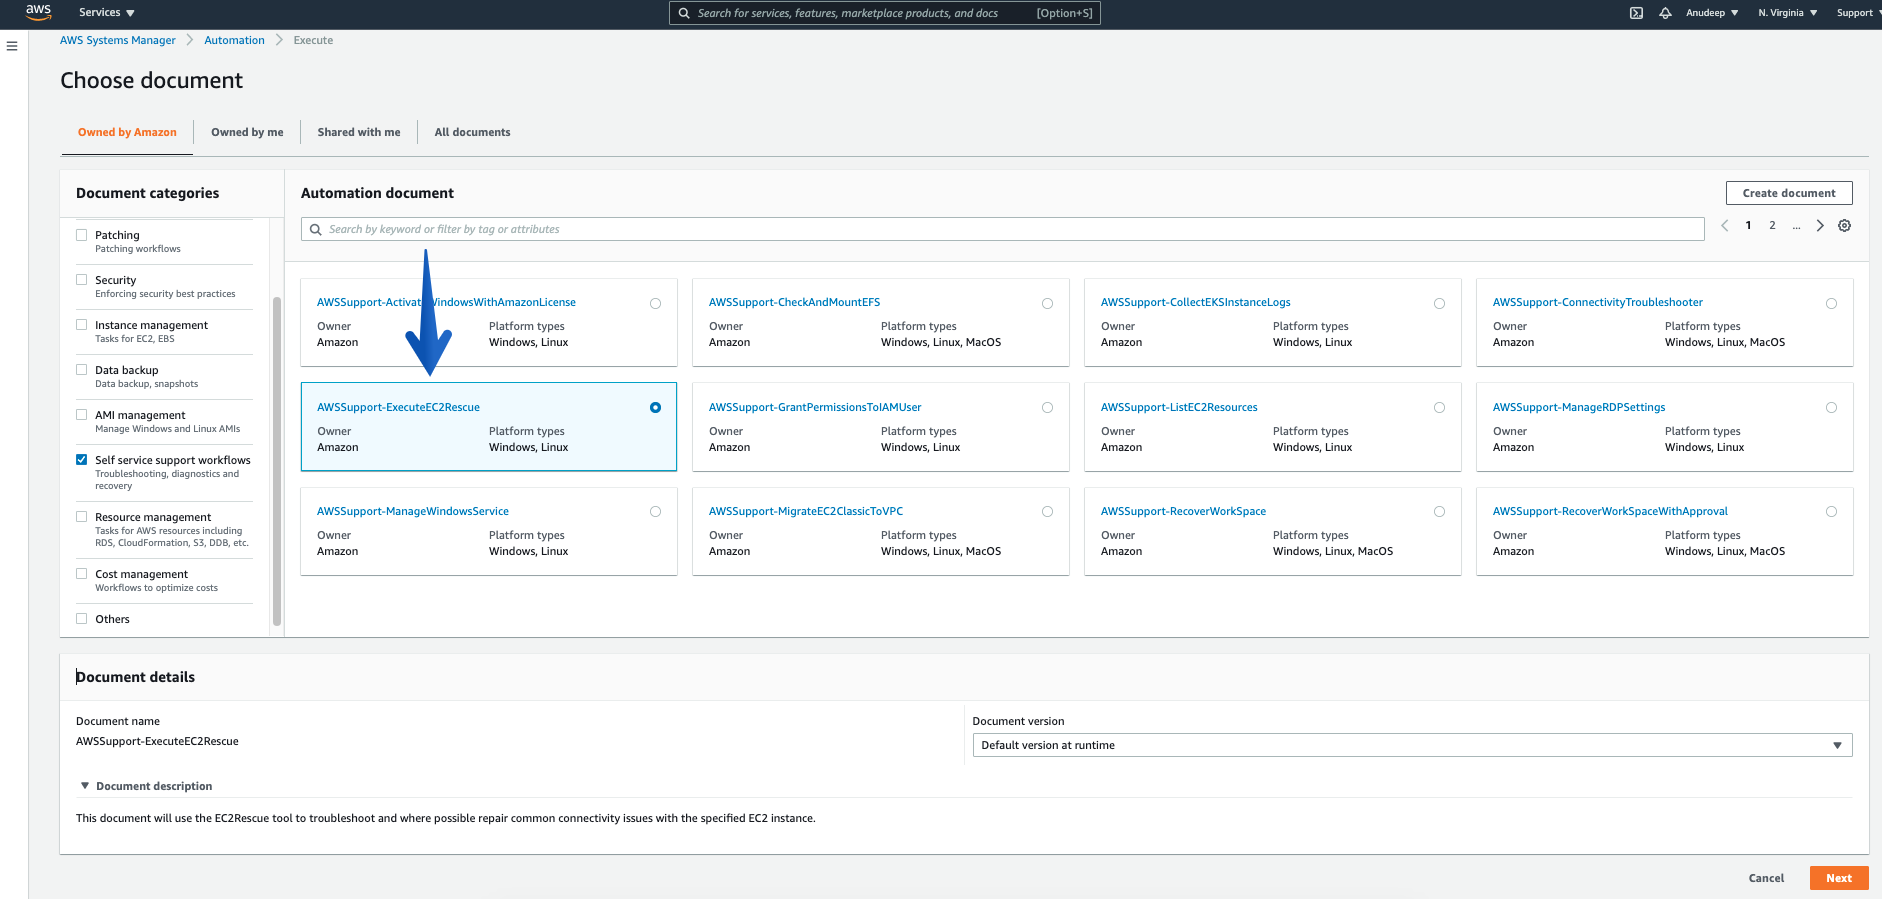
In the Automation document section categories, choose “Self service support workflows”, check for the Document named – “AWSSupport-ExecuteEC2Rescue”, and click “Next”
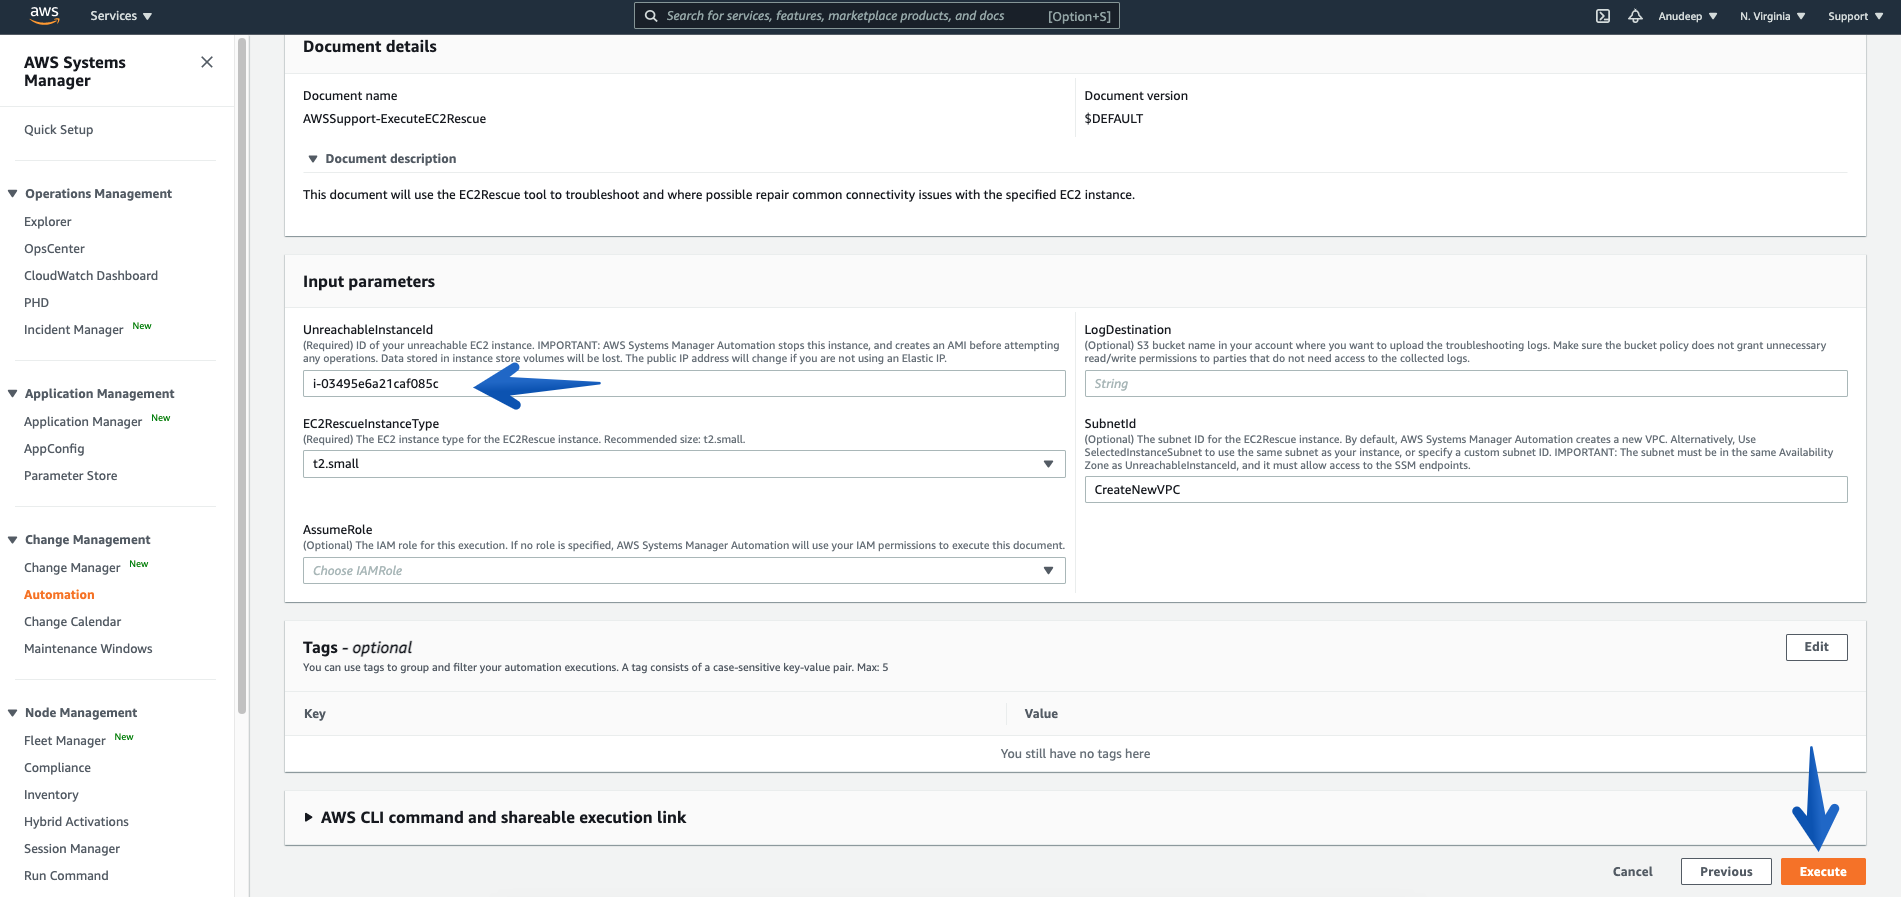
Please provide the Instance ID of unreachable Instance (Required), and then click the Execute button to start Automation workflow:
Some Information about Input Parameters:
Mandatory/Required:
UnreachableInstanceId : (Required) ID of your unreachable EC2 instance.
IMPORTANT: AWS Systems Manager Automation stops this instance, and then creates an AMI before attempting any operations. Data stored in instance store volumes will be lost. The public IP address will change if you are not using an Elastic IP address.
EC2RescueInstanceType : (Required) The EC2 instance type for the EC2Rescue instance. Recommended size: t2.small. (it is auto-selected by default)
Optional:
LogDestination: (Optional) Amazon Simple Storage Service (S3) bucket name in your account where you want to upload the troubleshooting logs. Make sure that the bucket policy does not grant unnecessary read/write permissions to parties that do not need access to the collected logs.
SubnetId: (Optional) The subnet ID for the EC2Rescue instance. By default, AWS Systems Manager Automation creates a new VPC. Alternatively, use SelectedInstanceSubnet to use the same subnet as your instance, or specify a custom subnet ID.
IMPORTANT: The subnet must be in the same Availability Zone as UnreachableInstanceId, and it must allow access to the SSM endpoints.
AssumeRole: (Optional) The IAM role for this execution. If no role is specified, AWS Systems Manager Automation will utilize your IAM permissions to execute this document. To know more about granting permissions by using IAM policies, refer here.
Now, let’s proceed:
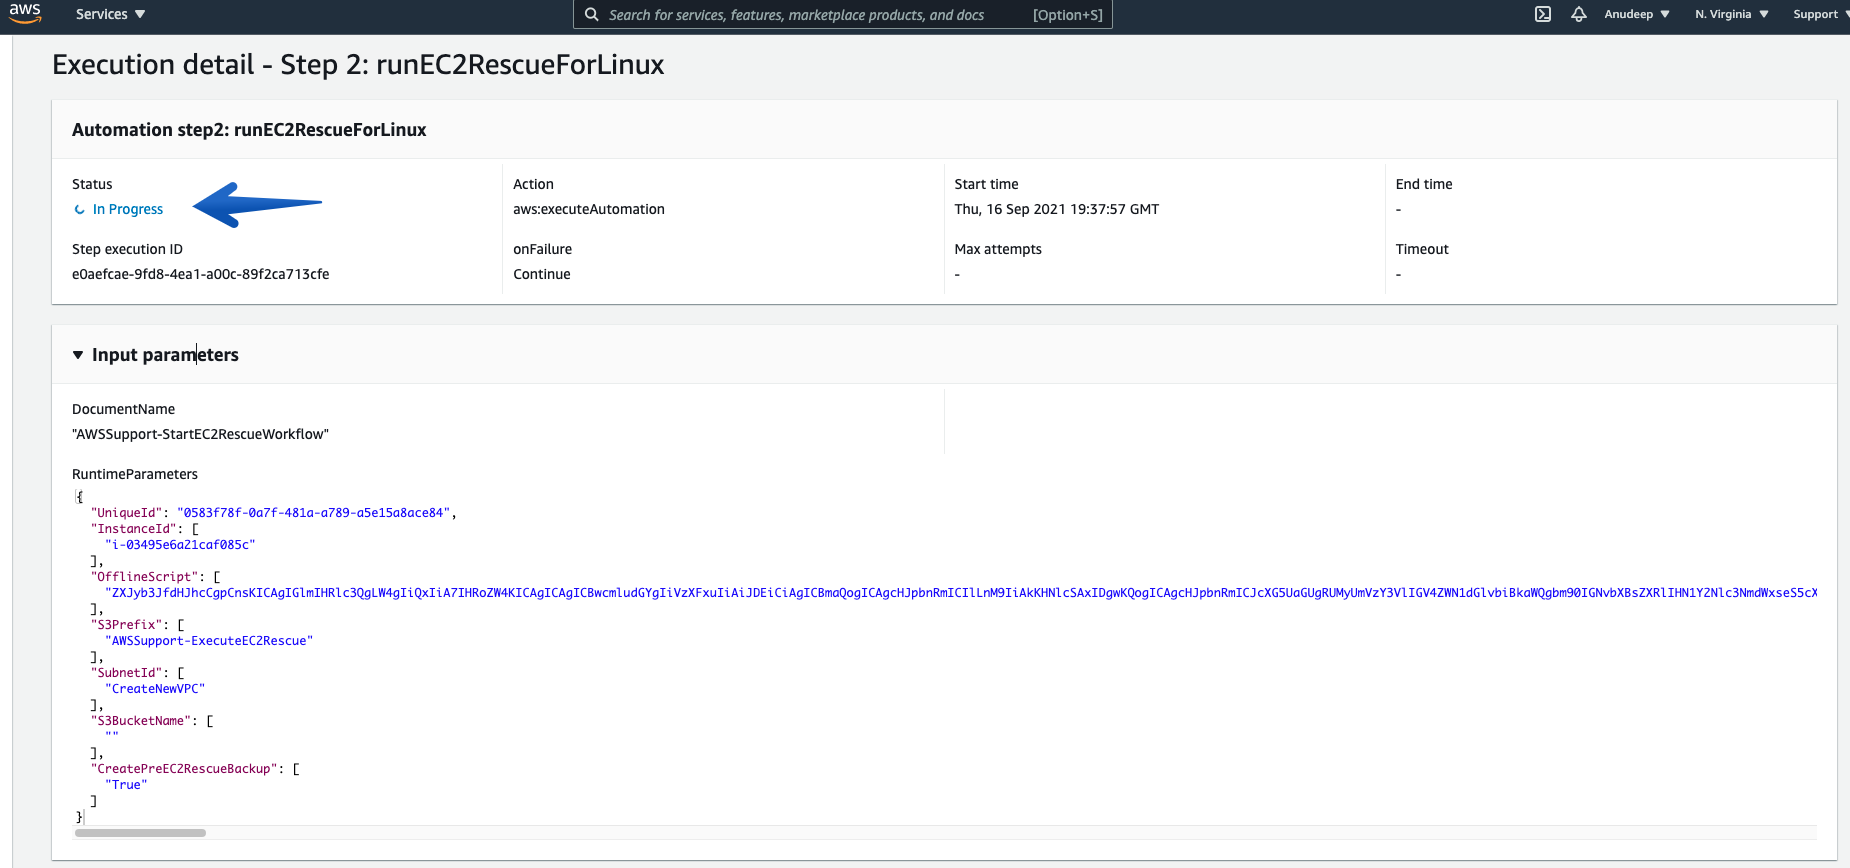
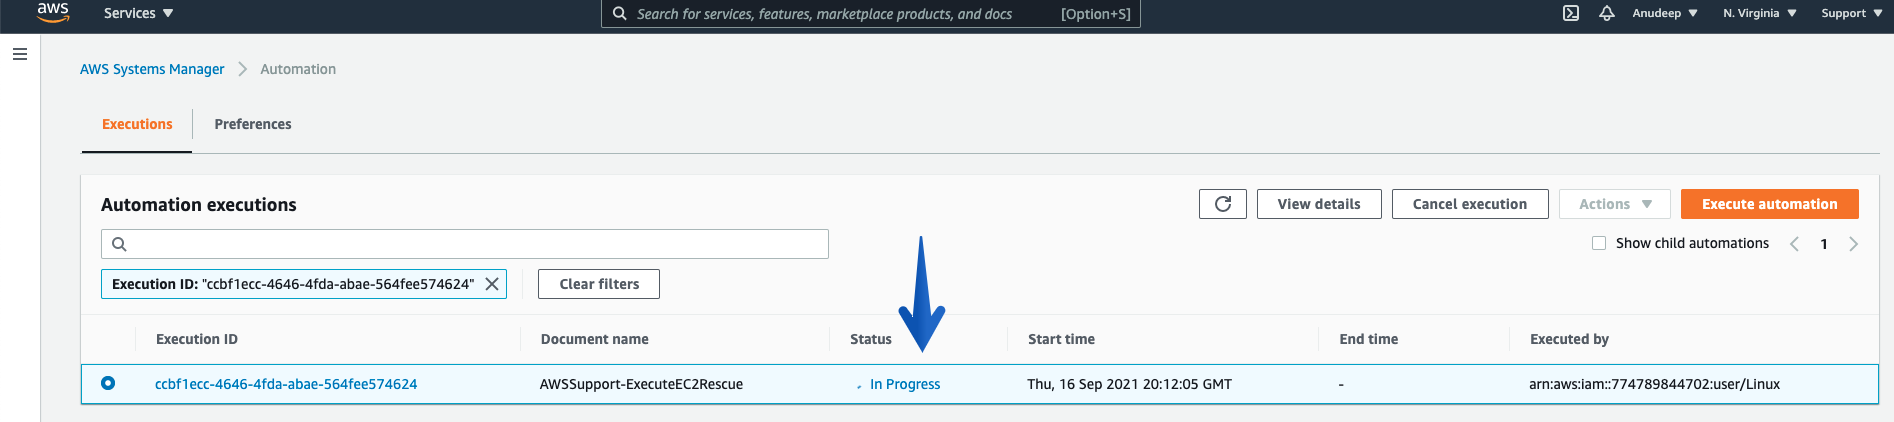
Once you click the “Execute” button, the Automation will start, and you can see the Status “In Progress”:
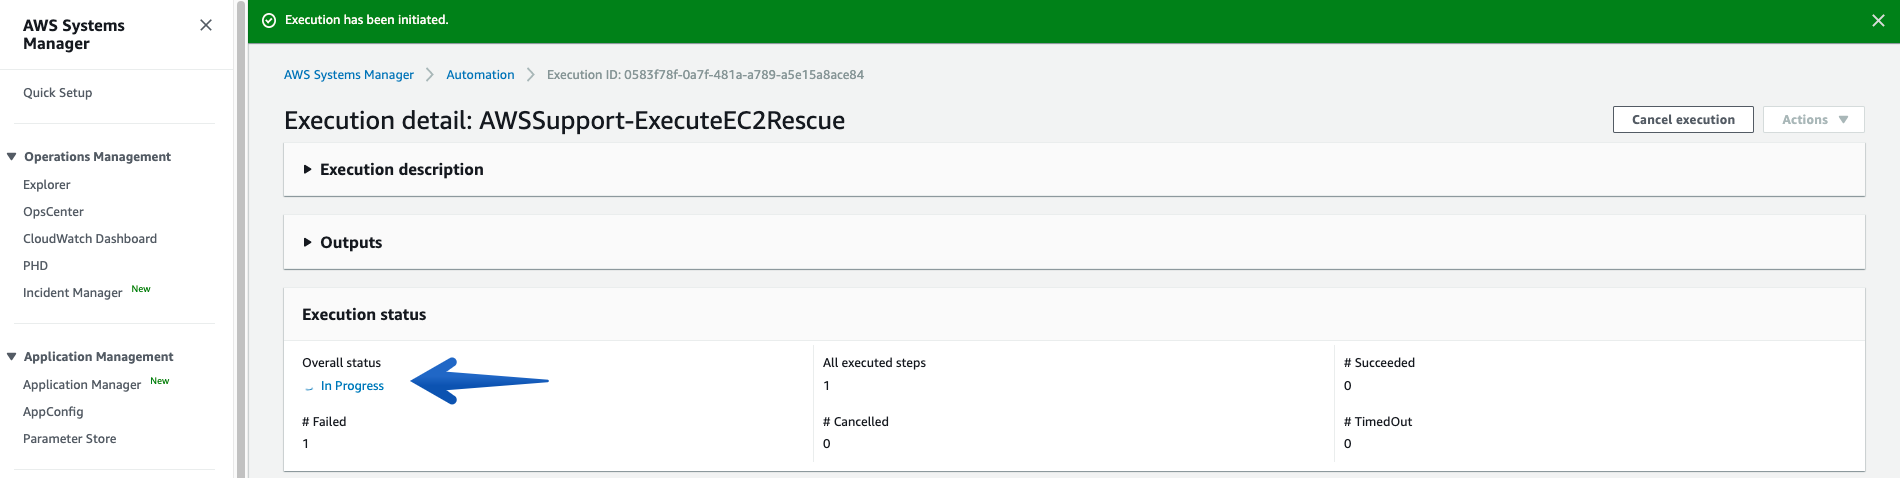
See more details under Executed Steps.
Checking what it does in the background:
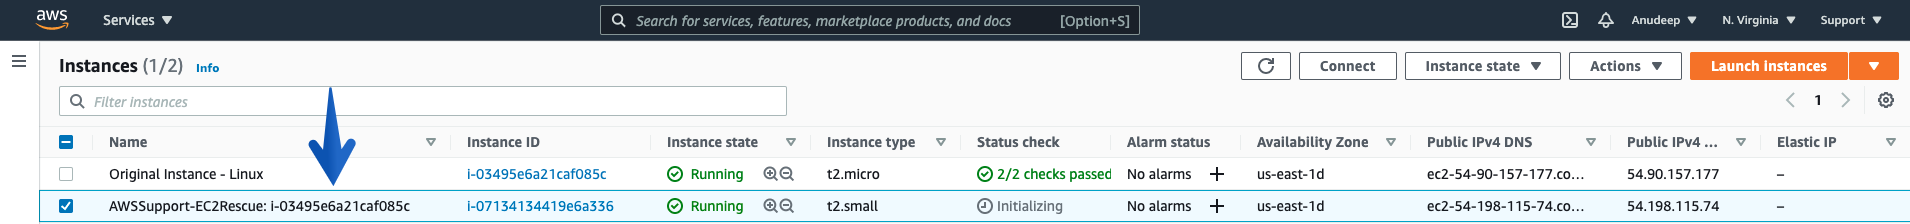
Procedure creates an SSM helper Instance/recovery Instance with the name tag AWS-Support-EC2Rescue-I-xxxx
Creates an AMI for backup purpose before it runs further steps:

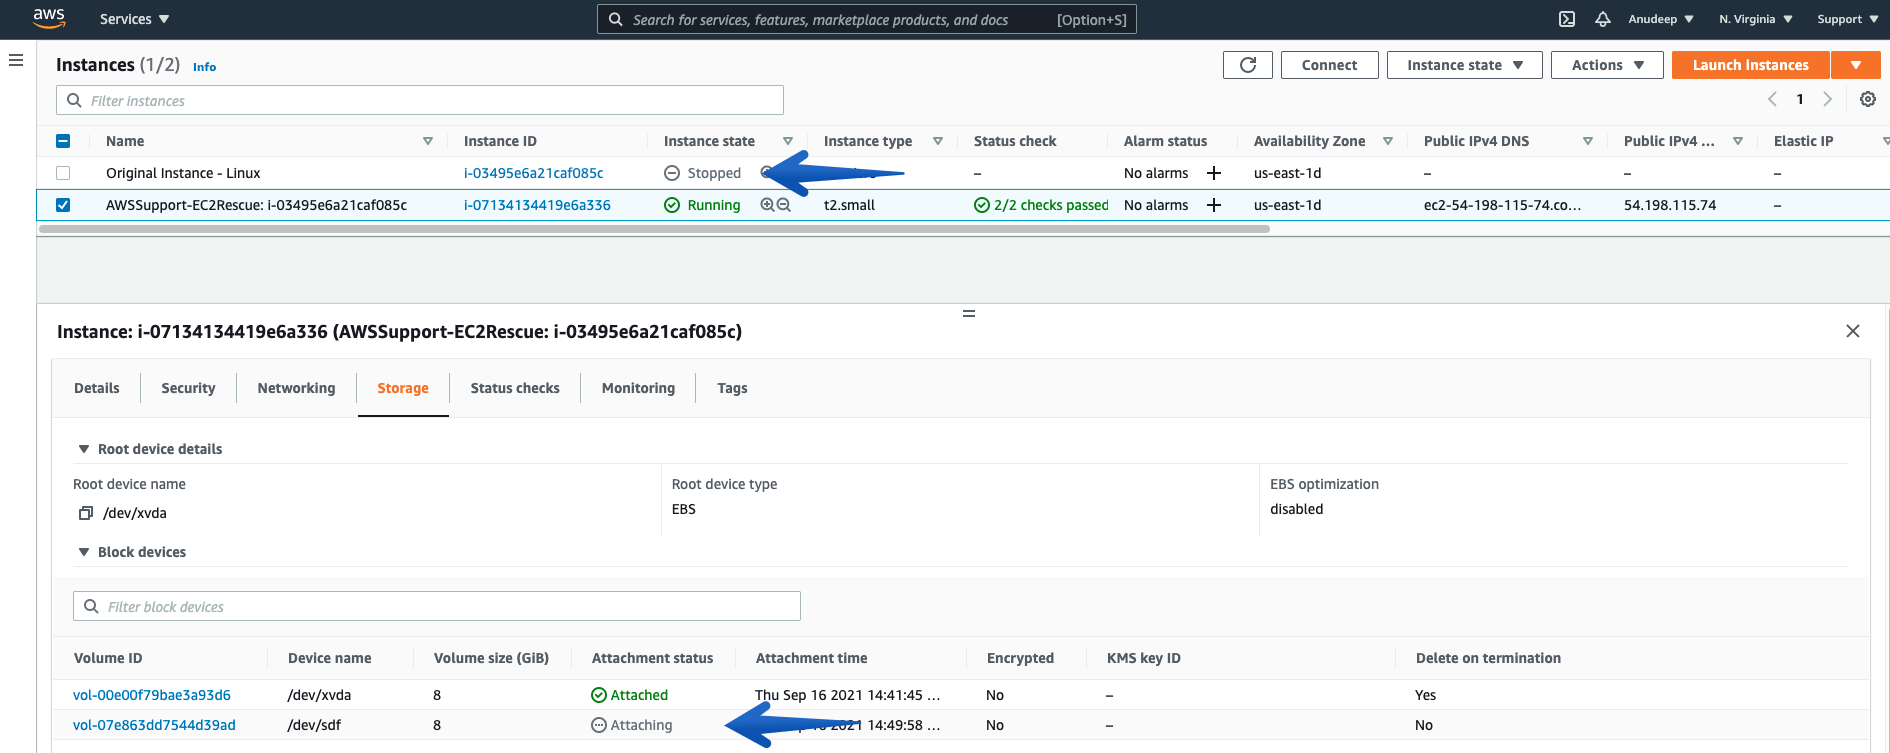
Stops the Problematic Unreachable Instance, Detaches the Root Volume from it, and Attaches on the SSM enabled Recovery/Helper Instance:
Then, the procedure runs EC2Rescue for Linux over rescue Instance in order to Fix the Issue and you can also track the steps below:
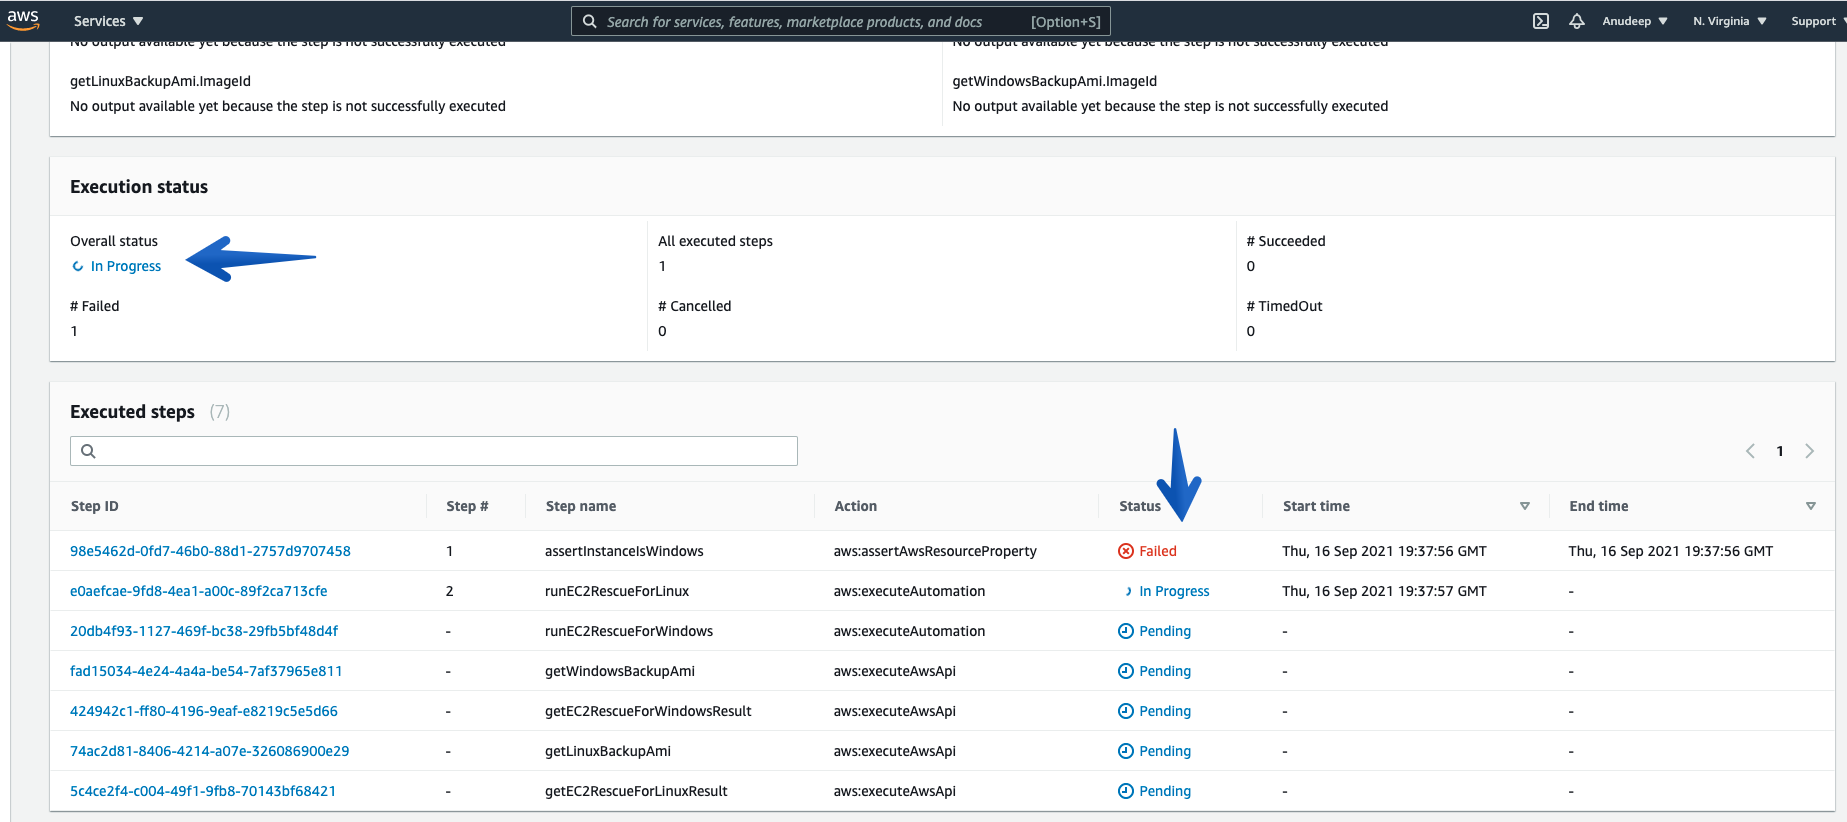
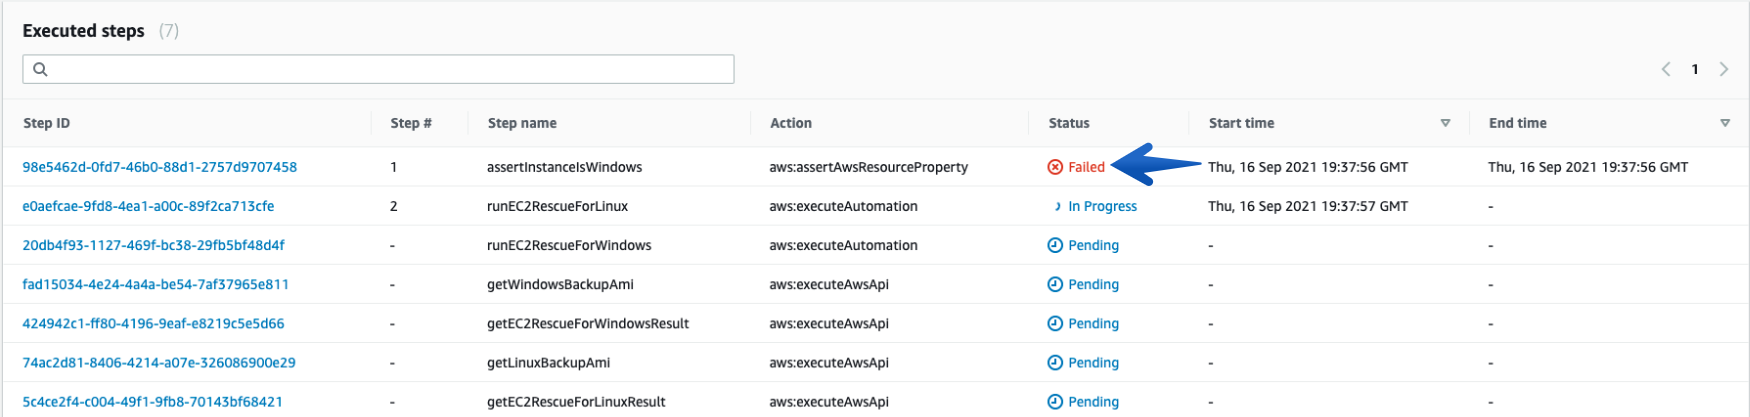
You can always check the details of each “Execution ID” and its Associated steps using “Step ID”.
Note: Linux Instances will have a “Failed” status for the first step every time.
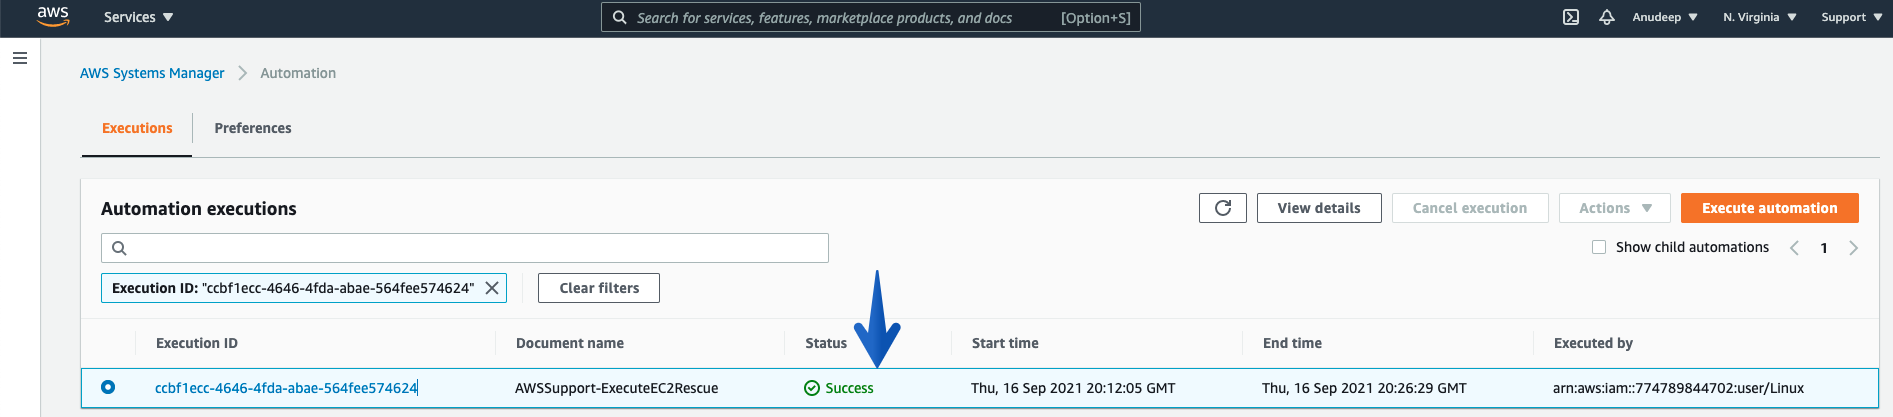
Monitor the Overall Status of the Procedure using the Execution Status tab under Automation Executions, and wait for it to get “Success”, which marks it as complete.
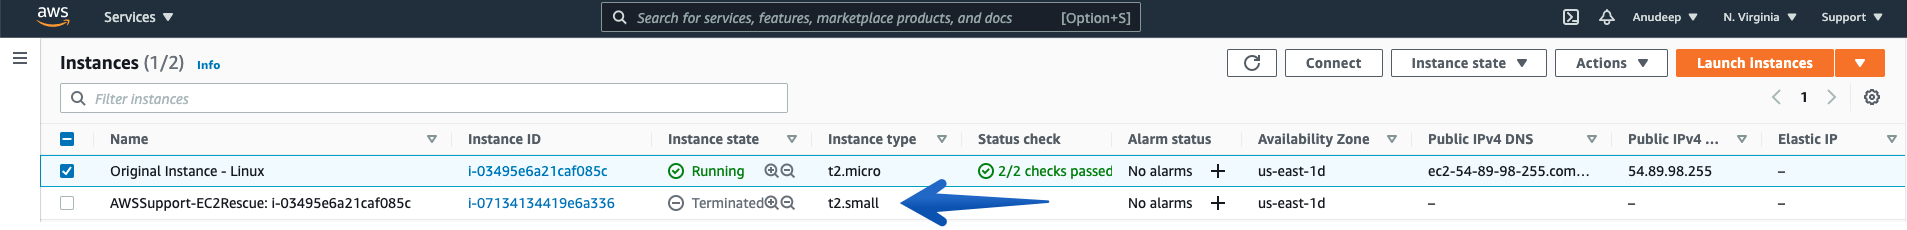
Now, checking the Instance state again, you can see the Rescue / SSM enabled Rescue Instance has been terminated and Automation have Started the Original Unreachable Instance again after fixing the issue:
Now, let’s try to connect to the Instance:
I am able to SSH and Issue has been fixed. 😃
Note: As the instance has a public IP address associated with it, after a stop/start of the instance during the automation runtime, the Public IP address has changed. If you would like to have a static IP, please associate an Elastic IP to the instance.
How to check the logs for what steps our procedure conducted on Instance:
Check the details of Step ID “runScriptForLinux”, which will provide you with a location of the log presence on instance.
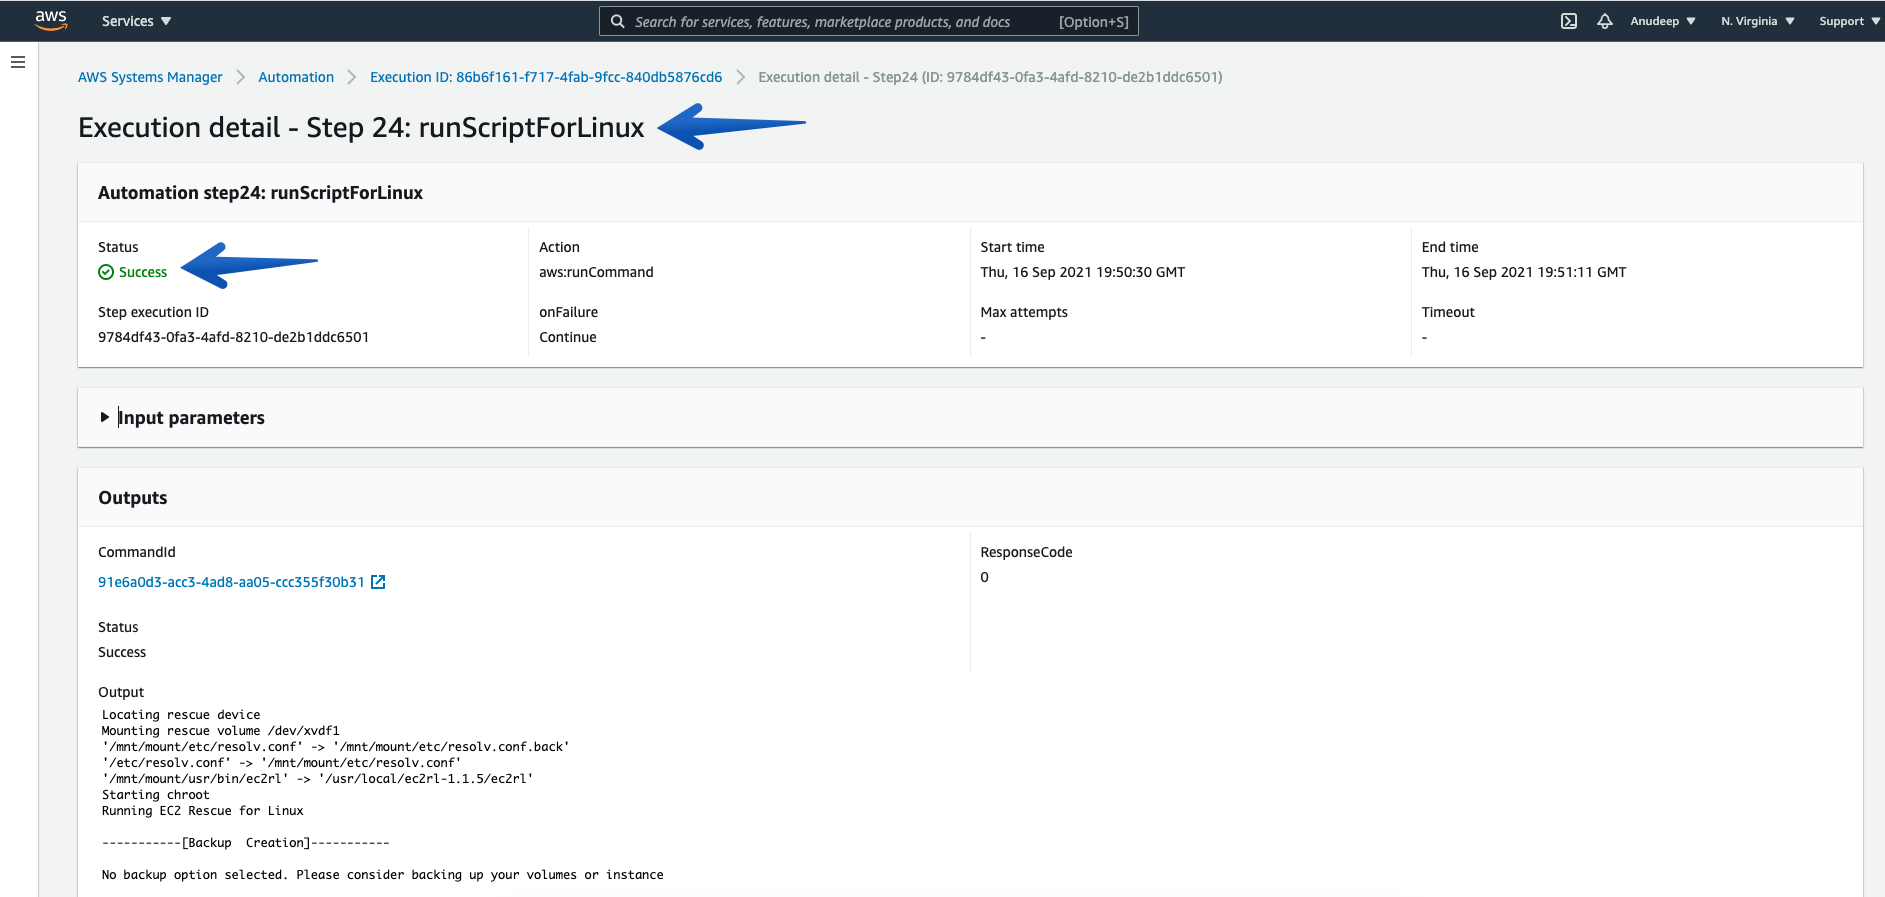
Please note the location displayed there. For example, in my case the output logs are located in /var/tmp/ec2rl/2021-09-16T19_50_33.565132
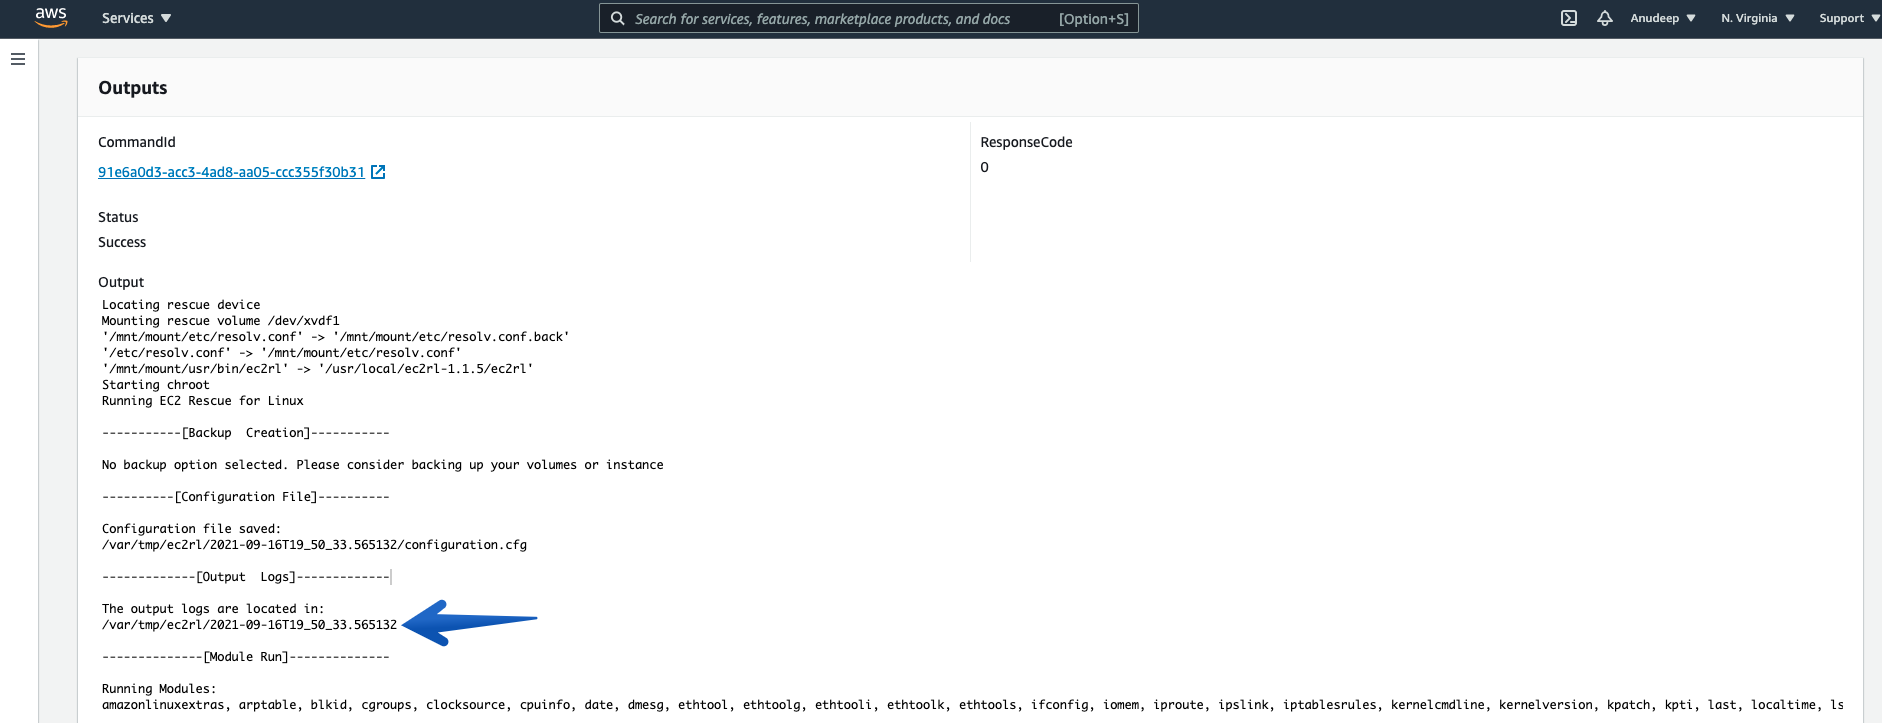
Now, I will check the Log location and see detailed information as follows:
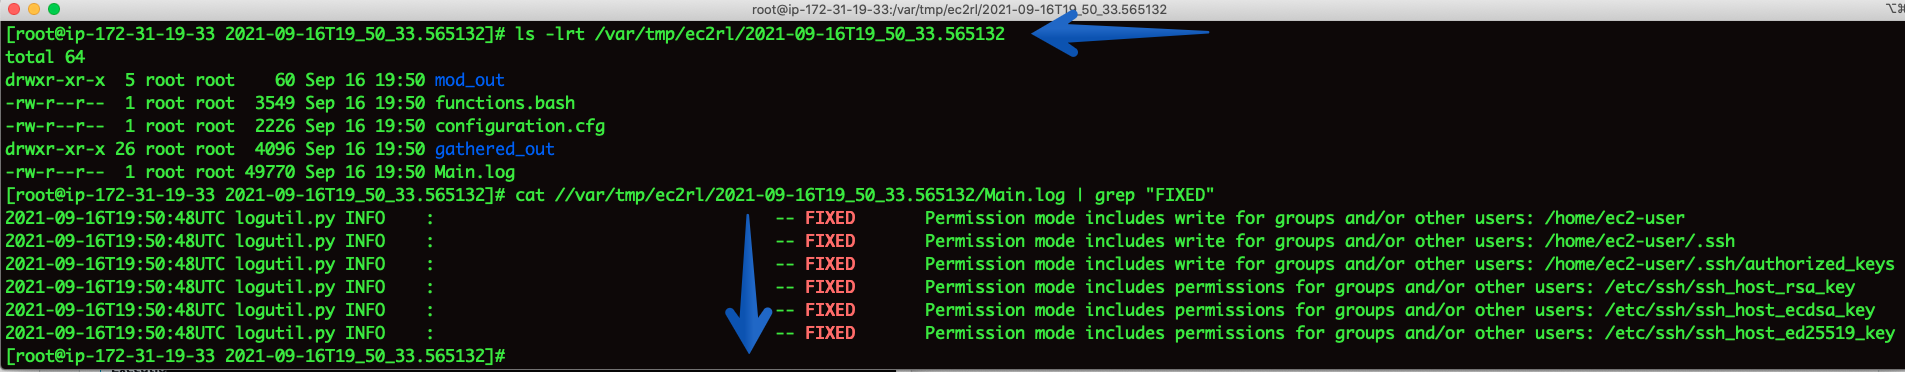
Therefore, I have also identified what fixes have been applied by EC2Rescue for Linux over instance to fix the issue in an automated way.
How to conduct the above steps using AWS CLI:
Running the Automation Document for an unreachable Instance (i-03495e6a21caf085c) :
# aws ssm start-automation-execution --document-name "AWSSupport-ExecuteEC2Rescue" --document-version "\$DEFAULT" --parameters '{"UnreachableInstanceId":["i-03495e6a21caf085c"],"EC2RescueInstanceType":["t2.small"],"SubnetId":["CreateNewVPC"]}' --region us-east-1
{
"AutomationExecutionId": "ccbf1ecc-4646-4fda-abae-564fee574624"
}
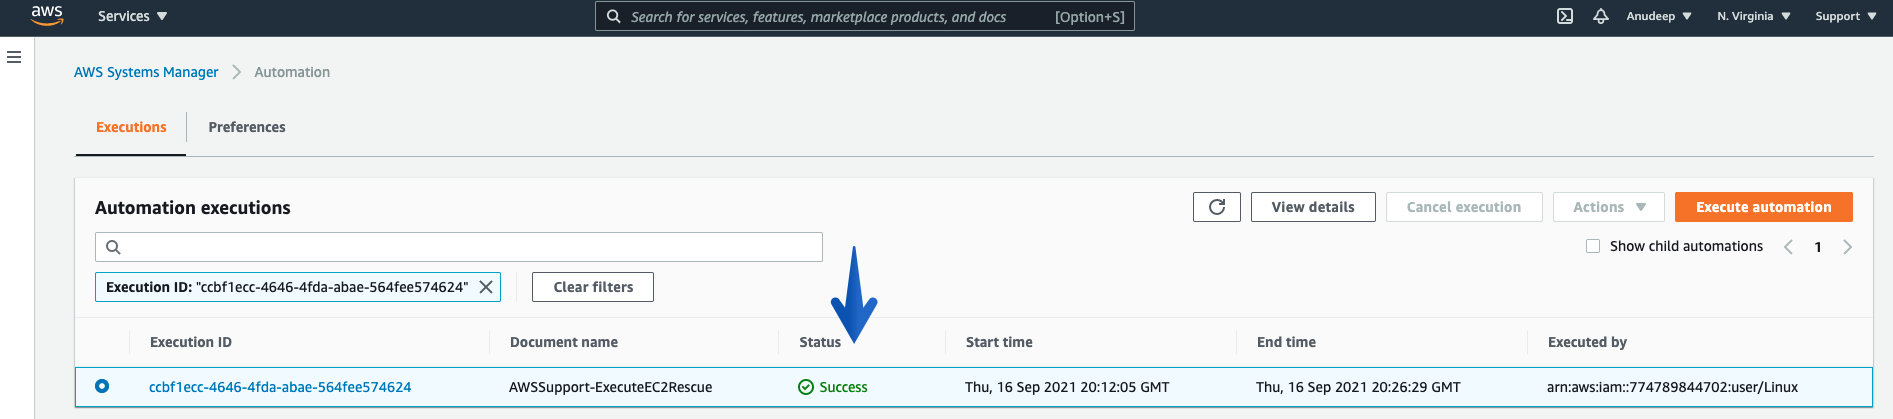
You can also see the Automation Scheduled (using Console):
Checking the Automation progress/Status:
# aws ssm get-automation-execution --automation-execution-id "ccbf1ecc-4646-4fda-abae-564fee574624" --output text --query "AutomationExecution.AutomationExecutionStatus"  --region us-east-1
InProgress
Let’s wait a few minutes to get this completed and Can check the Status again:
# aws ssm get-automation-execution --automation-execution-id "ccbf1ecc-4646-4fda-abae-564fee574624" --output text --query "AutomationExecution.AutomationExecutionStatus"  --region us-east-1
Success
You can also see this (using Console):
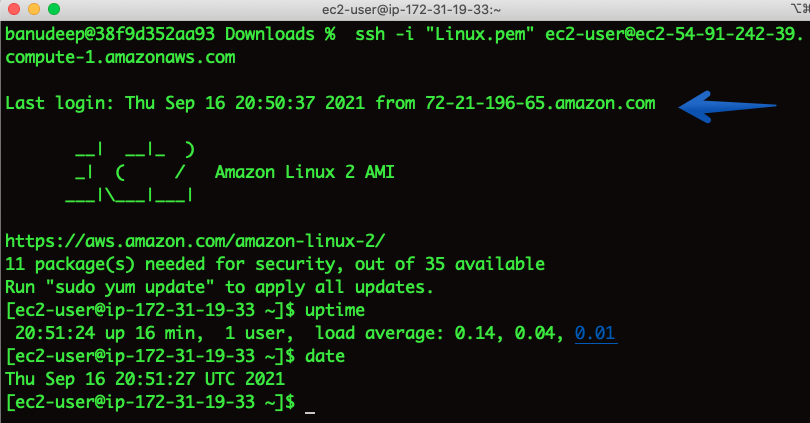
After the Status is returned as “Success”, let’s try to SSH to the Instance again: (Success)
# ssh -i "Linux.pem" ec2-user@ec2-54-91-242-39.compute-1.amazonaws.com
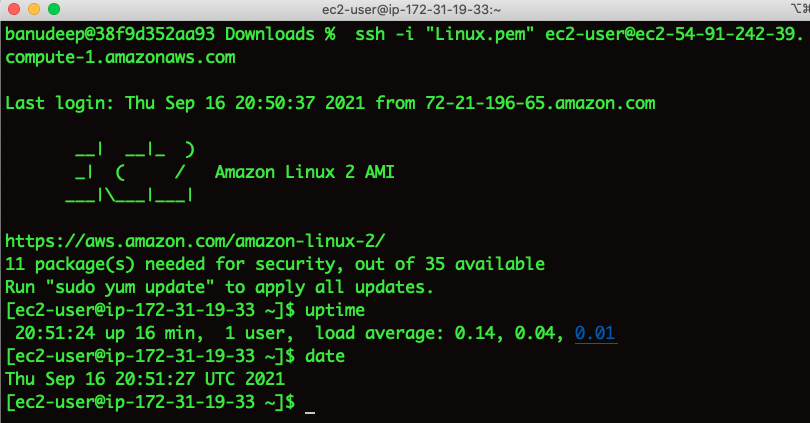
I am able to log in to the EC2 Instance now – Issue resolved. 😃
Conclusion
AWSSupport-ExecuteEC2Rescue is a new Automation document that automates every step required to fix common issues on your unreachable Windows and Linux instance utilizing respective EC2Rescue for Linux and EC2Rescue for Windows tool tools.
In this blog post I have demonstrated how the integration between CloudWatch Events and Systems Manager Automation enables to run AWSSupport-ExecuteEC2Rescue automatically in response to an event in your infrastructure.
Amazon Athena, Amazon Redshift Plugins and New Features in Amazon Managed Grafana
=======================
During late August 2021, we made Amazon Managed Grafana generally available, and around re:Invent we launched some new features, specifically for new plugins. This post provides you with the high-level overview and shows you some of them in action.
Amazon Managed Grafana is a fully managed service that handles the provisioning, setup, scaling, and maintenance of Grafana servers. It is generally available in US East (N. Virginia), US East (Ohio), US West (Oregon), Europe (Ireland), Europe (Frankfurt), Europe (London), Asia Pacific (Singapore), Asia Pacific (Tokyo), Asia Pacific (Sydney), and Asia Pacific (Seoul). At re:Invent 2021, we upgraded the Amazon Managed Grafana data plane to use Grafana 8.2 (from 8.0), and now it also supports CloudFlare, Zabbix, and Splunk Infrastructure Monitoring data sources. We worked with Grafana Labs to make a series of plugins available as open source (more later on in this post) for self-managed Grafana. Moreover, we’re offering them for you to use in Amazon Managed Grafana. Let’s look closer at the new data sources and visualization.
Geomap visualization
You can now use the Geomap panel visualization to visualize geospatial data in a map view. You can configure multiple overlay styles to visually represent important location-based characteristics of your data, such as the heatmap overlay to cluster data points for visualizing hotspot locations with high data densities.
The following example shows the OpenStreetMap on AWS open data set (OSM) in action, using the Geomap panel that’s readily available on the left-hand side drop down within the Amazon Managed Grafana workspace. To re-create this, upload the OSM data into an S3 bucket, configure Athena as a data source, and then visualize the query results of available restaurants in Las Vegas by using the Geomap visualization.
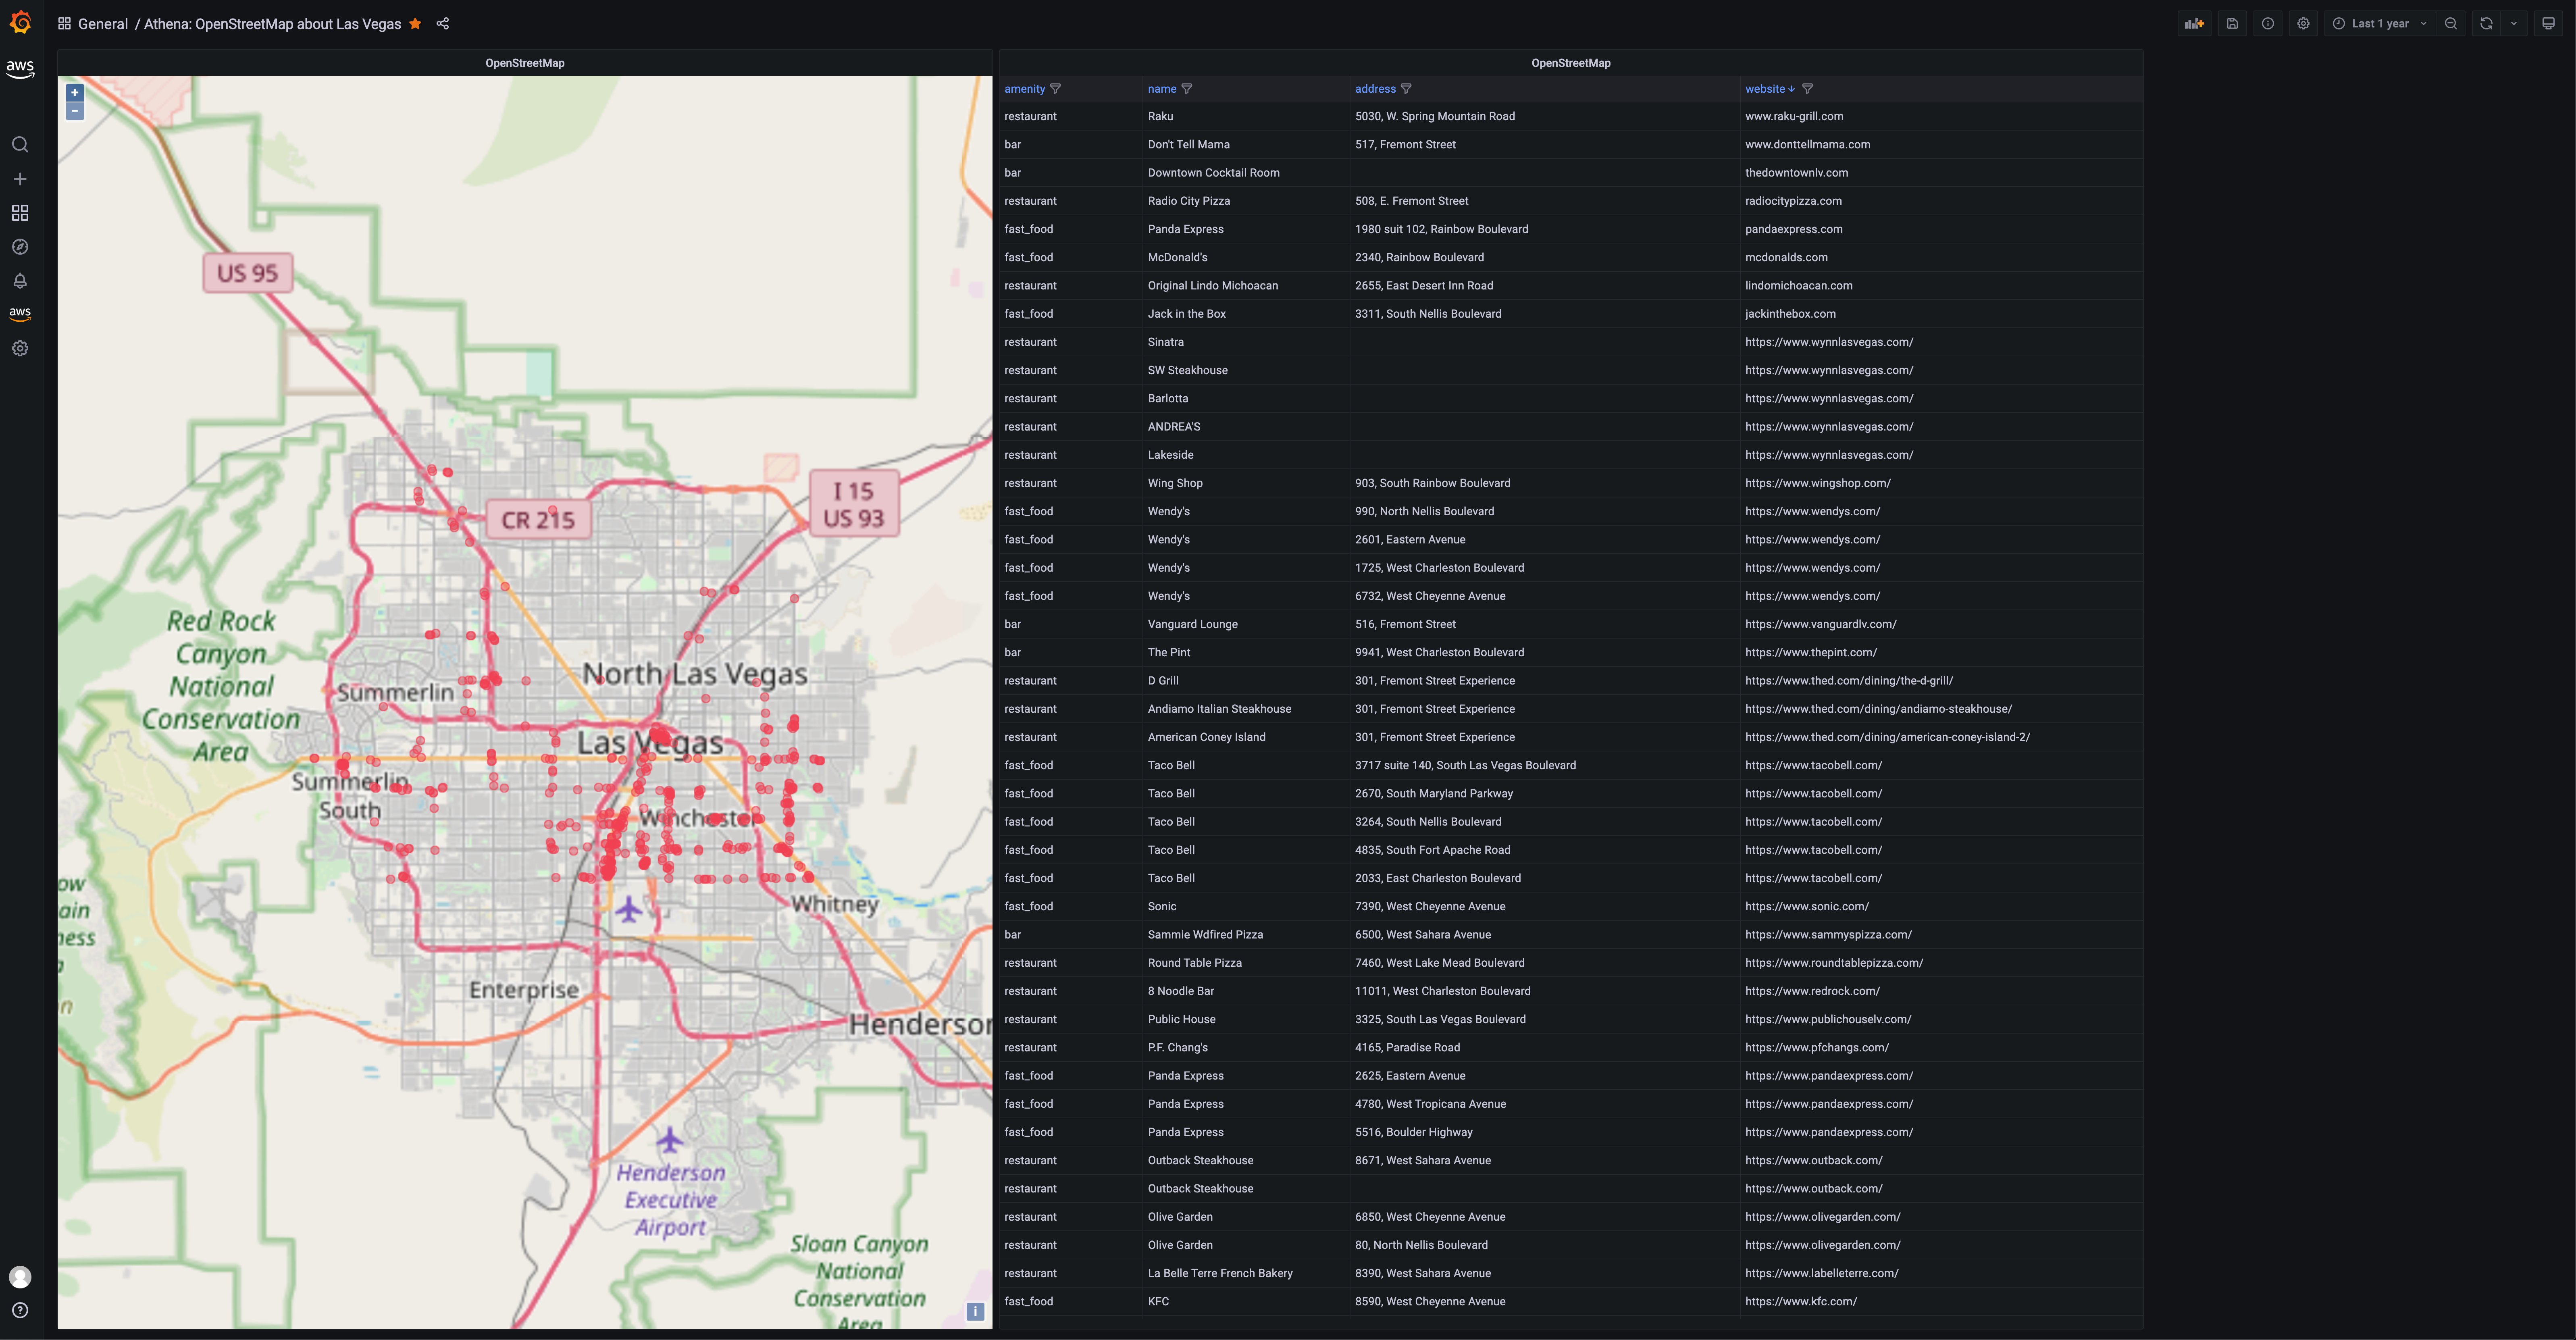
Figure 1: Grafana Geomap visualization showing a map of Las Vegas with restaurant locations plotted
See also:
Grafana/Geomap plugin docs and or AWS docs
Building the Geomap plugin for Grafana 8.1
Amazon Athena/S3 data source
Amazon Athena is a distributed query engine (think: PrestoDB as a service) that lets you query a range of structured data formats (including JSON, CSV, ORC, and Parquet) using SQL, with the data stored in Amazon Simple Storage Service (S3) buckets. This means that for a number of non-relational datasets, from security (VPC flow logs) to budgeting (Cost and Usage Report (CUR)) to the previously mentioned OpenStreetMap geo data, you can now use Grafana to query and visualize your data.
The default dashboard that we bundled with the Athena data source is for the CUR data, and it looks like this:
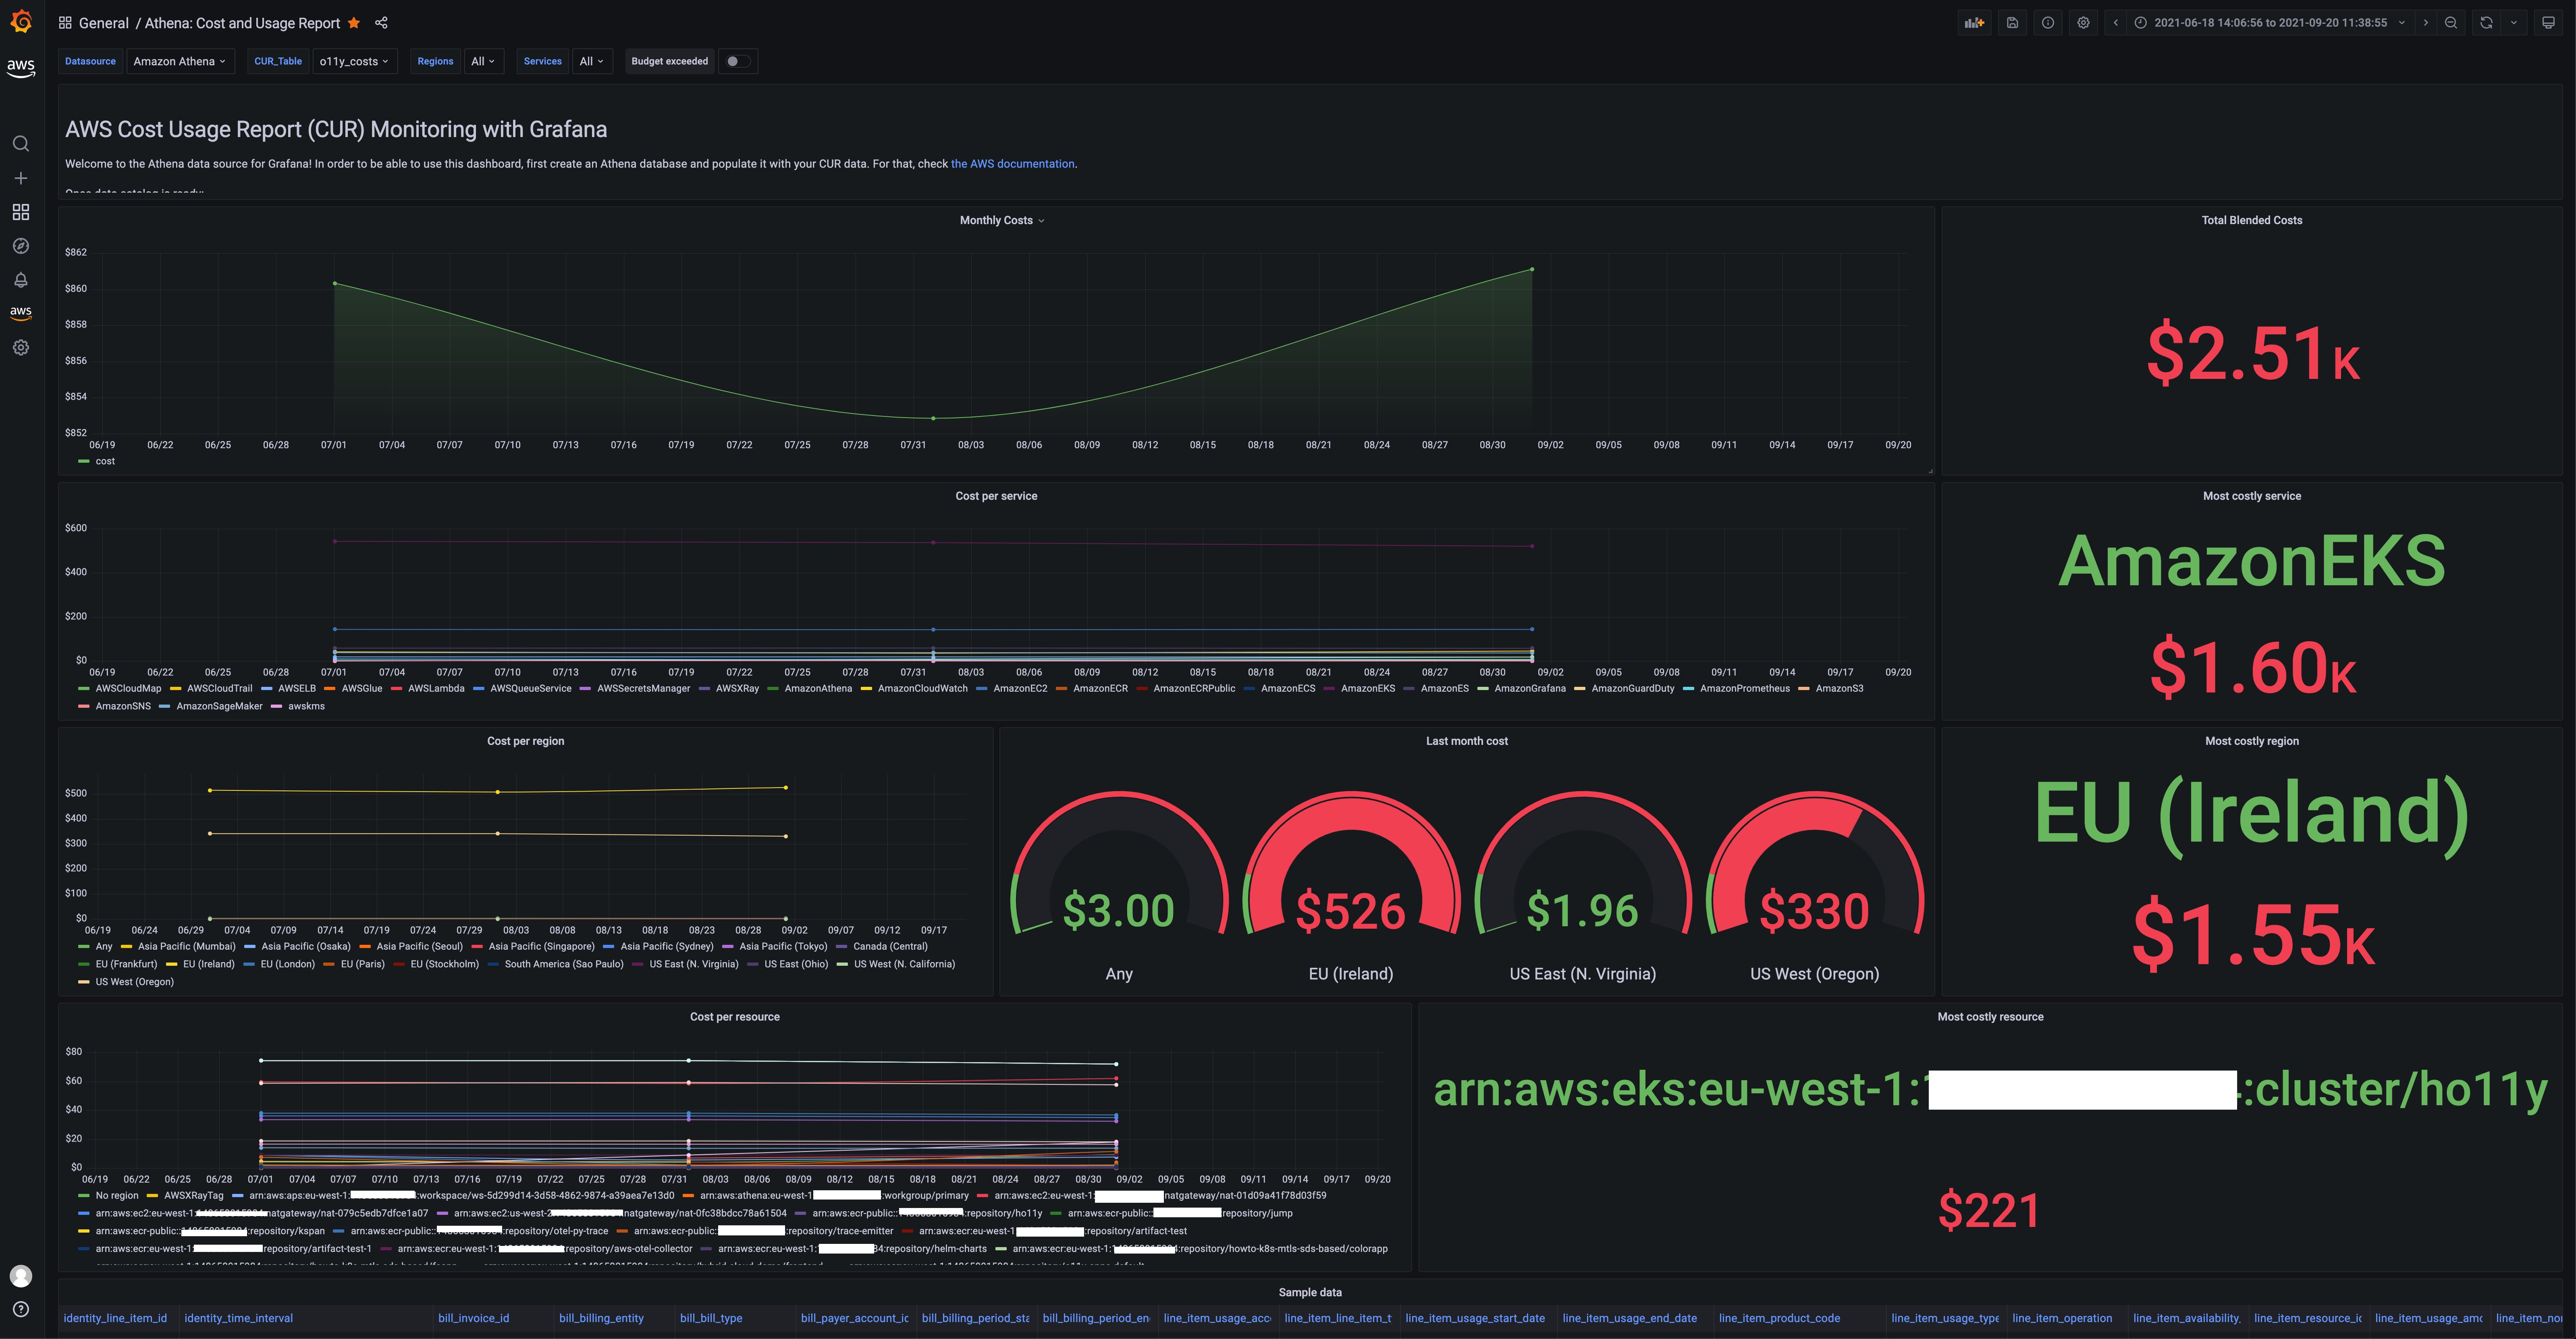
Figure 2: AWS Cost and Usage Report dashboard in Grafana
Another use case for the Athena data source is querying VPC flow logs, as is shown in the following:
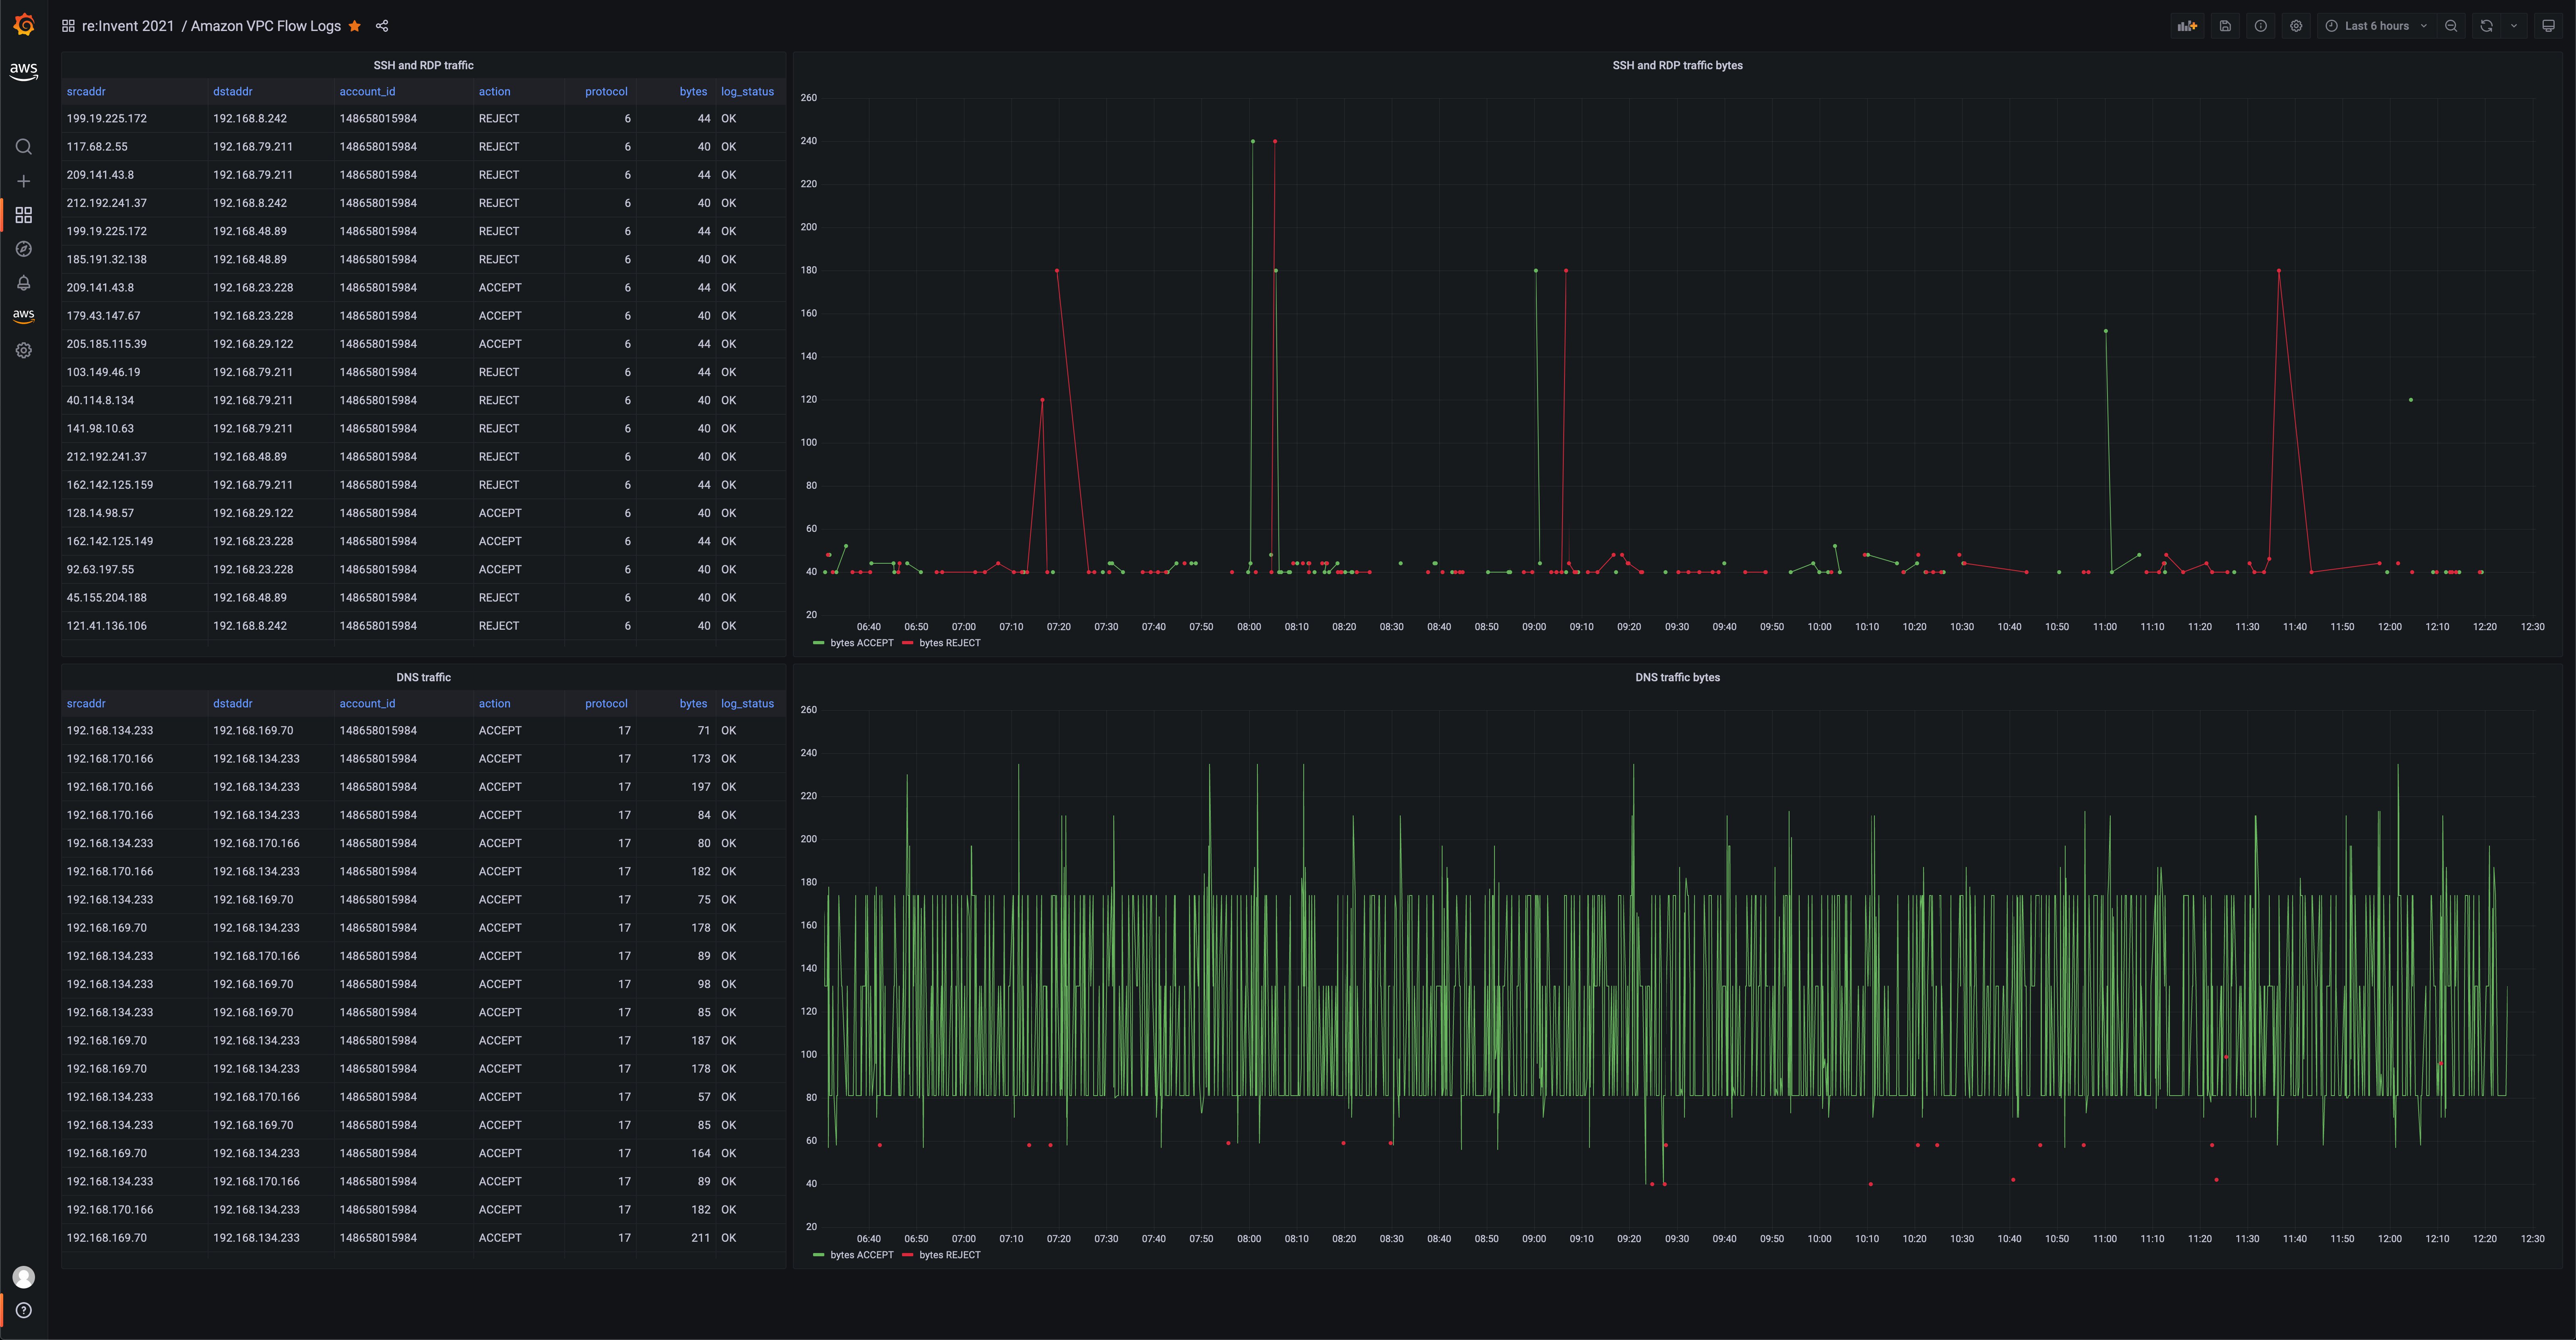
Figure 3: Grafana visualization showing VPC Flow logs query using the Athena data-source plugin
See also:
Athena data source (Amazon Managed Grafana docs)
Using Athena in Amazon Managed Grafana recipe
Amazon Redshift data source
Amazon Redshift is a fully managed, petabyte-scale data warehouse service in the cloud, which now is also serverless. This data source now lets you perform analytical SQL queries against all of your Redshift clusters. By default, we included the performance monitoring dashboard:
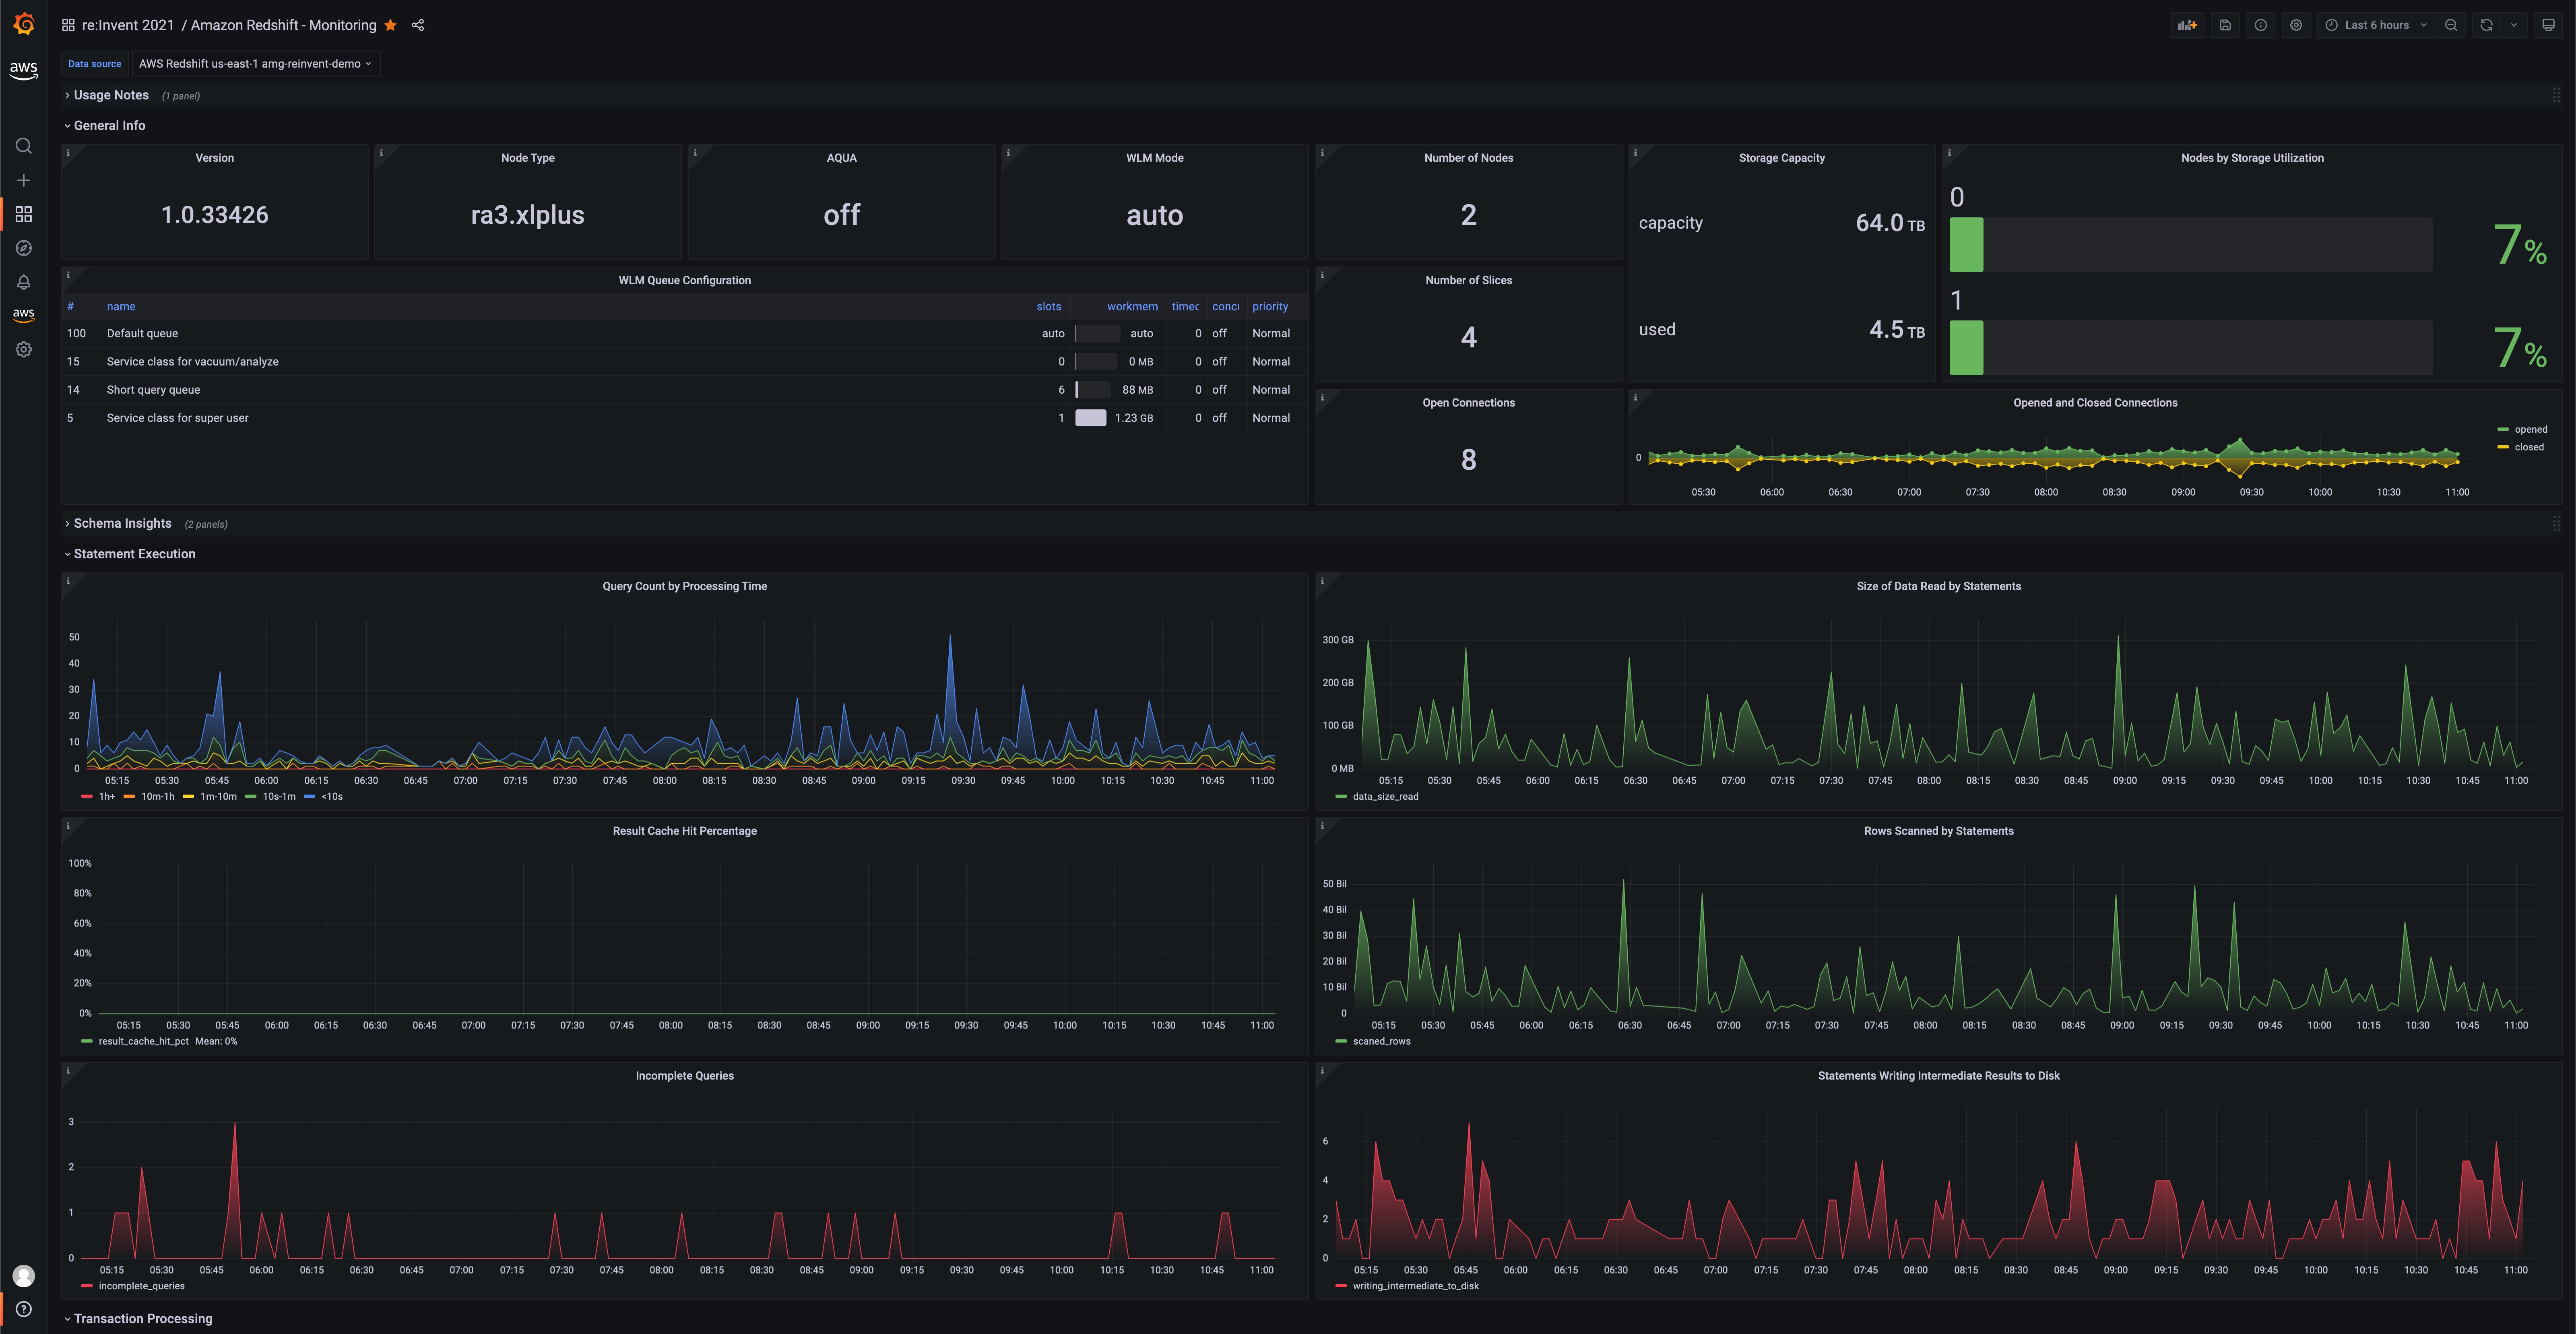
Figure 4: Grafana visualization showing the performance monitoring dashboard of a Redshift cluster
Another example dashboard that you can use to visualize contents of the Redshift sample database looks like the following:
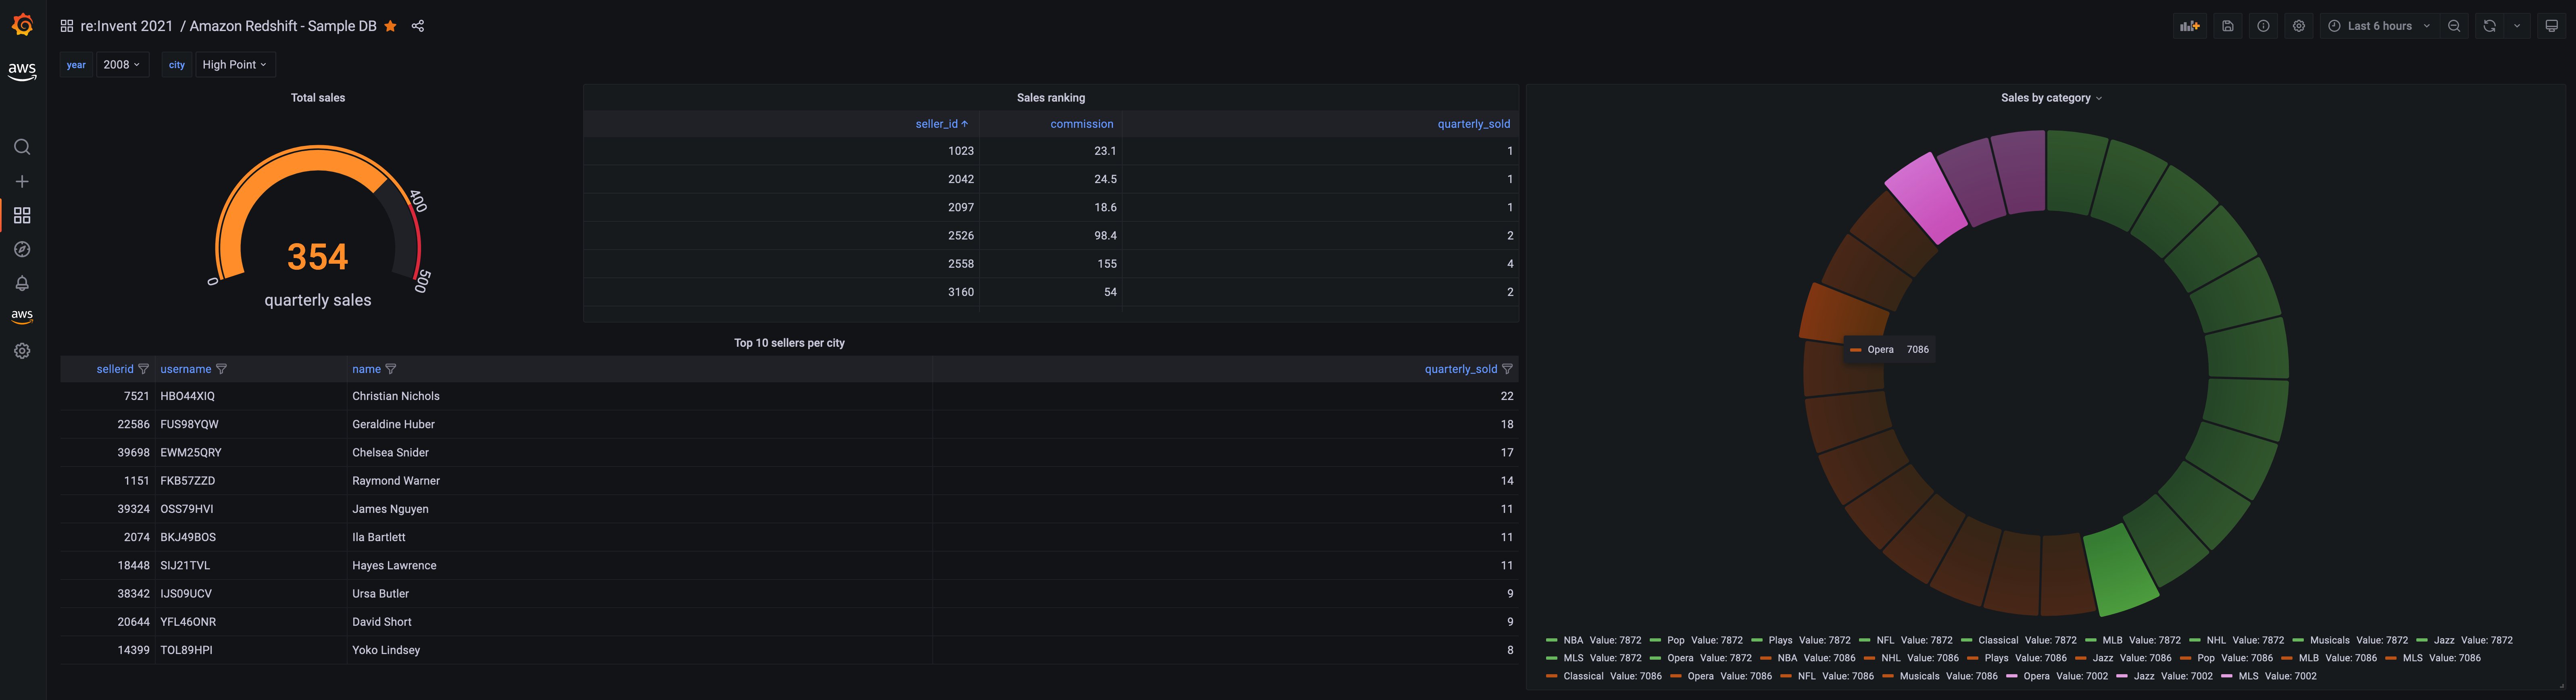
Figure 5: Grafana visualization showing sample data from a Redshift cluster using the Redshift datasource plugin
See also:
Redshift data source (Amazon Managed Grafana docs)
Using Redshift in Amazon Managed Grafana recipe
CloudWatch Metrics Insights
Amazon CloudWatch announced the preview availability CloudWatch Metrics Insights, a powerful high-performance SQL query engine that you can use to query your metrics at scale. Using the updated CloudWatch datasource plugin, you can query CloudWatch Metrics using SQL. As shown in the following image, you now have a free text area to simply type in the Metrics Insights query that you want to use to query the data.
For example, if you use the following CloudWatch Metrics Insights query that lists the top Lambda function invocations ordered by invocation count,
SELECT SUM(Invocations)
FROM SCHEMA("AWS/Lambda", FunctionName)
GROUP BY FunctionName
ORDER BY SUM() DESC
then the resulting data graphed on a time series visualization looks like the following:
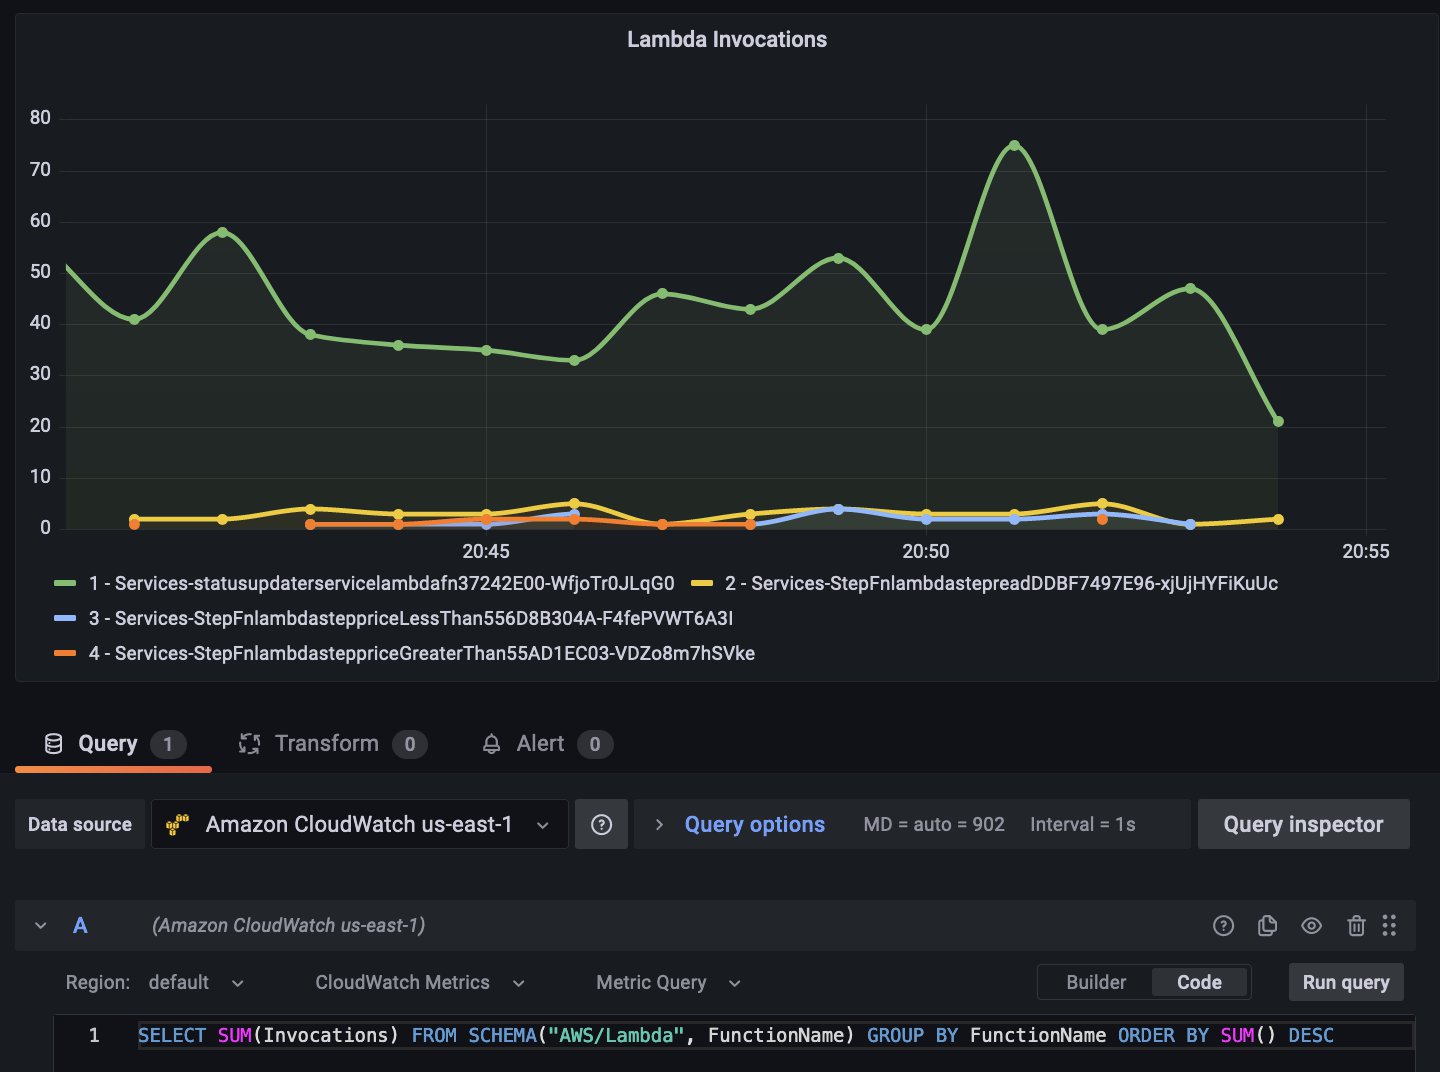
Figure 6: Grafana visualization showing Lambda invocation data using CloudWatch Metrics Insights SQL query option
Furthermore, you can use the Builder mode to construct the query easily. The following screenshot shows how the exact same query as above can be built using the Builder option with a donut visualization:
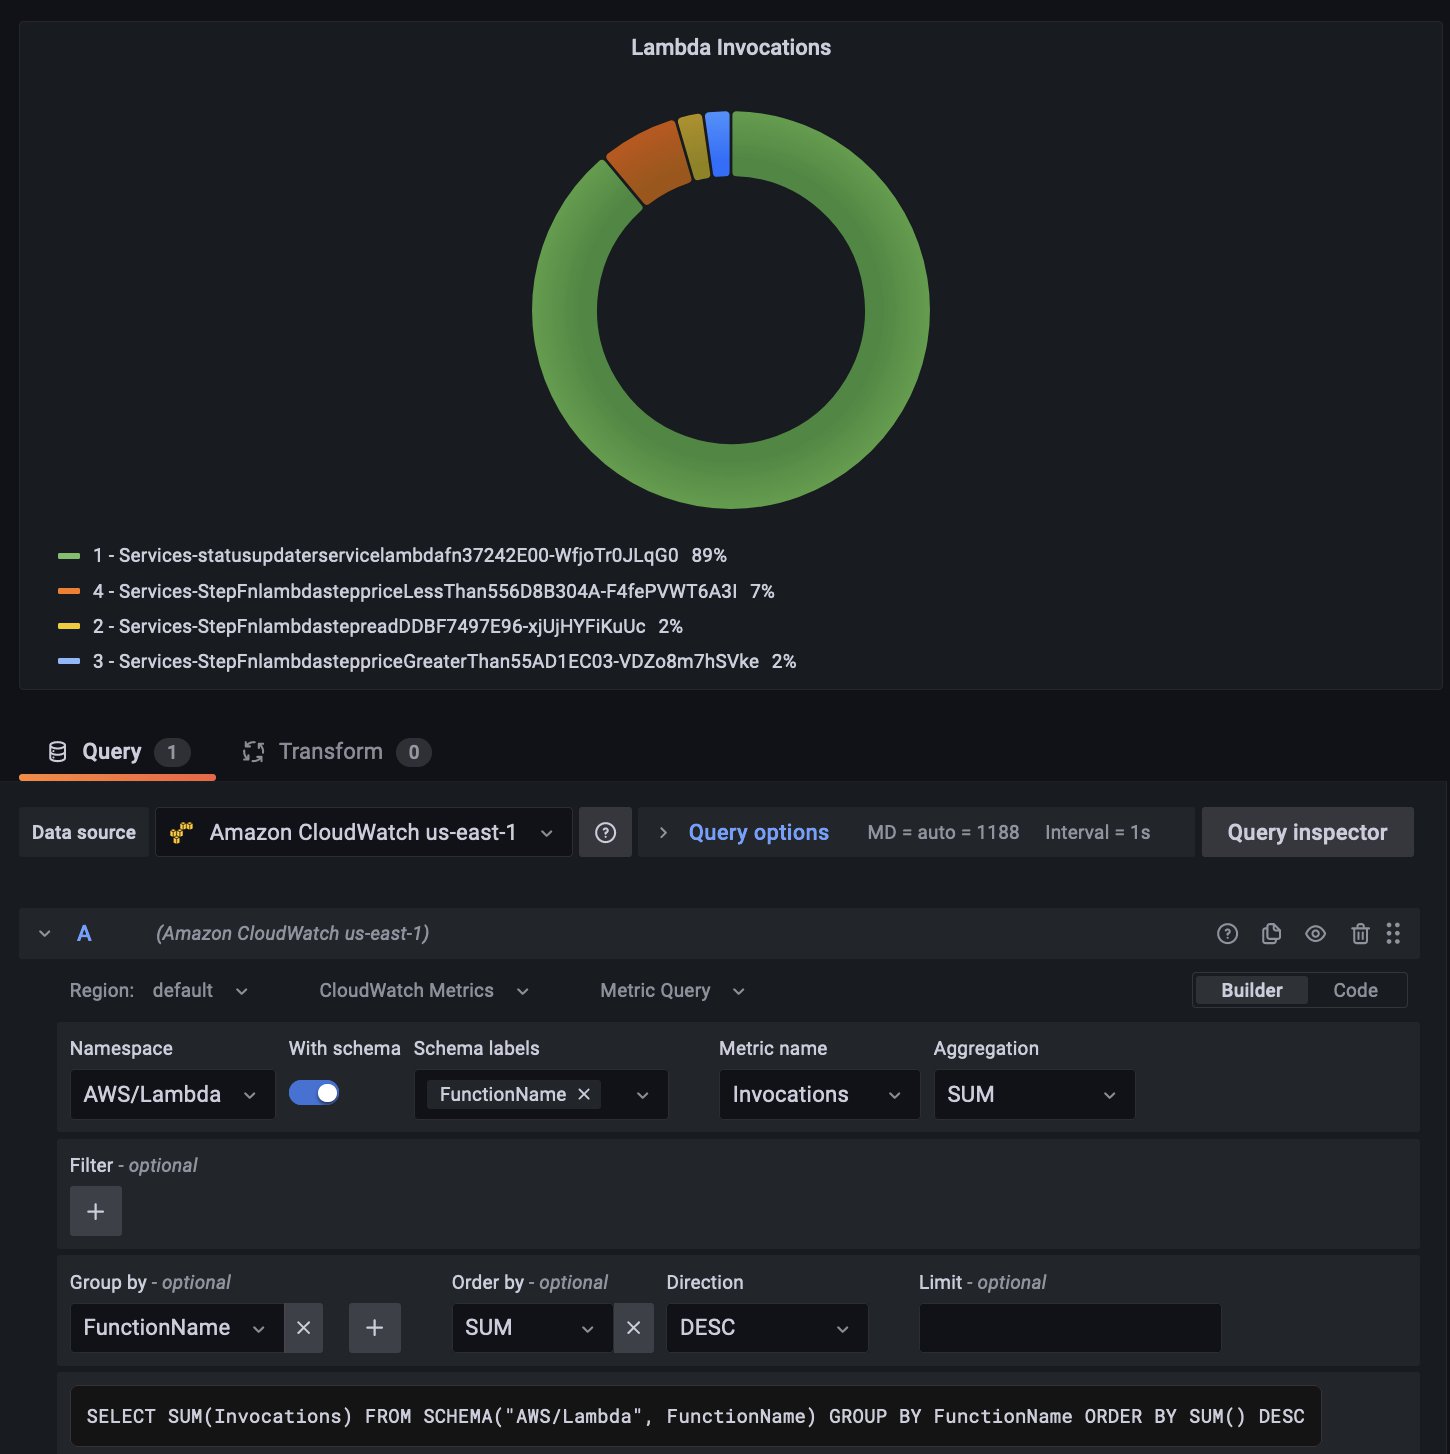
Figure 7: Grafana visualization showing Lambda invocation data using CloudWatch Metrics Insights query builder option
Learn more about CloudWatch Metrics Insights in the Amazon Managed Grafana docs, and take a look at the blog post that goes through this feature in greater detail.
IoT TwinMaker
Currently in preview, AWS IoT TwinMaker lets you build operational digital twins of physical and digital systems. IoT TwinMaker creates digital visualizations using measurements and analysis from a variety of real-world sensors, cameras, and enterprise applications to help you track your physical factory, building, or industrial plant. Also, see our Amazon Managed Grafana docs for how to use it.
What’s next
As you know, a large number of the features we deliver are based on what customers like yourself tell us. So please tell us through your AWS account contacts on what you like to see next, from features to data source and what you think we should focus on in 2022!
Codify your best practices using service control policies: Part 2
=======================
I introduced the fundamental concepts of service control policies (SCPs) in the previous post. We discussed what SCPs are, why you should create SCPs, the two approaches you can use to implement SCPs, and how to iterate and improve SCPs as your workload and business needs change.
In this post, I will discuss how you can think of creating SCPs using constructs from AWS Well-Architected. I will use Organizational Units (OUs) names throughout this blog following the best practices of setting up Organizational Units (OUs) on AWS Organizations.
Creating SCPs based on AWS Well-Architected constructs
Let’s go through some of the key constructs of AWS Well-Architected pillars and see how you can think of creating SCPs. This is by no means an exhaustive list of SCPs covering all of the constructs of AWS Well-Architected.
What operational excellence pillar related SCPs can I apply to my OUs?
The operational excellence pillar focuses on running and monitoring systems to deliver business value, and to continually improve operational processes. Key objectives of the Operational Excellence pillar are:
Improved observability, including monitoring, log management, and workload telemetry
Rapid identification and remediation of issues introduced during deployment activities
Understanding workload health and detect deviation from established patterns of workload usage on production
To adhere to operational excellence principles, protecting resources that monitor your accounts for anomalies or configuration drift is essential.
One such resource is CloudWatch anomaly detection. You may want to prevent member accounts from altering anomaly monitors, alarms, or dashboards, which are issued by administrators (example, where names start with Admin-) at the same time giving flexibility to your developers to create, update, or delete monitors, alarms, or dashboards that they own. You can assign this SCP to your organization’s root , or to your foundational OUs (OU: Infrastructure, OU: Security, and OU: Workloads).
SCP: Deny Changes to CloudWatch monitors
Where to attach: At organization root, or infrastructure, security, and workloads OU
{
"Version": "2012-10-17",
"Statement": [
{
"Sid": "DenyDisableCloudWatchMon",
"Effect": "Deny",
"Action": [
"cloudwatch:DeleteAlarms",
"cloudwatch:DeleteAnomalyDetector",
"cloudwatch:DeleteDashboards",
"cloudwatch:PutAnomalyDetector",
"cloudwatch:PutDashboard",
"cloudwatch:PutMetricAlarm",
"cloudwatch:SetAlarmState"
],
"Resource": [
"arn:aws:cloudwatch:::alarm:Admin-*",
"arn:aws:cloudwatch:::dashboard/Admin-*"
]
}
]
}
In addition, AWS recommends that you create a guardrail to disallow changes to CloudWatch Logs log groups and prevent modifying retention policy. You can do that by attaching the following SCP in your root OU. Extending this SCP to AWS Control Tower created log groups is one of the mandatory guardrails available through AWS Control Tower.
SCP: Deny Changes to CloudWatch Logs
Where to attach: At organization root
{
"Version": "2012-10-17",
"Statement": [
{
"Sid": "DenyCWLogGroupRetentionPolicyUpdate",
"Effect": "Deny",
"Action": [
"logs:PutRetentionPolicy",
"logs:DeleteLogGroup"
],
"Resource": [
"*"
]
}
]
}
AWS Config is a service that assesses, audits, and evaluates configurations of your AWS resources. AWS Config is used by customers as a compliance-as-code framework, and as a detective rules engine. You can attach the following SCP at the root OU to disallow AWS Config changes by member accounts across AWS Config Rules, Conformance Packs, and Multi-Account Multi-Region data aggregation.
SCP: Deny Changes to Config
Where to attach: At organization root
{
"Version": "2012-10-17",
"Statement": [
{
"Sid": "DenyChangesToConfig",
"Effect": "Deny",
"Action": [
"config:DeleteConfigRule",
"config:DeleteConfigSnapshot",
"config:DeleteConfigurationRecorder",
"config:DeleteDeliveryChannel",
"config:DeleteEvaluationResults",
"config:DeleteOrganizationConfigRule",
"config:DeleteResourceConfig",
"config:DeleteRetentionConfiguration",
"config:DeleteConformancePack",
"config:DeleteAggregationAuthorization",
"config:DeleteConfigurationAggregator",
"config:StopConfigurationRecorder",
"config:PutRetentionConfiguration",
"config:PutConfigurationAggregator",
"config:PutConfigurationRecorder"
],
"Resource": [
"*"
]
}
]
}
What security pillar related SCPs can I apply to my OUs?
The security pillar focuses on principles that strengthen your cloud security posture by
implementing least privilege access
separation of duties
defense in depth
data protection in transit and at rest
incident response
AWS recommends that you define security governance as a multi-layered strategy to manage risk at each level (i.e., foundational features that you inherit from AWS, platform features that you build on AWS, and application/business features that run on your platform).
Each of these layers should define security constants or security invariants. Security invariants are statements that will always hold true for your business and applications. An example of a security invariant is: “only authenticated and authorized users will have access to our API endpoints” or “security canaries will be always running on our CI/CD pipelines”. Each such security invariant defines a control that must be put in place to make that invariant achievable. These controls should form the basis of your desired security SCPs.
Note that determining security invariants and subsequent controls are not a one-time activity. You must stay up-to-date with AWS and industry recommendations and threat intelligence to evolve your threat model and control objectives.
For example, you should easily prevent the accidental removal of accounts from your organization. You can attach the following SCP at your organization root:
SCP: Deny accounts from leaving the organization
Where to attach: At organization root
{
"Version": "2012-10-17",
"Statement": [
{
"Sid": "SCPforOULeavingOrgProtection",
"Effect": "Deny",
"Action": [
"organizations:LeaveOrganization"
],
"Resource": [
"*"
]
}
]
}
Make sure that you retire accounts that are unused, such as those from former employees, and then move them to OU: Suspended to protect your business from unwanted changes. Attach an SCP that denies *:* to this OU.
SCP: Deny all actions
Where to attach: Suspended OU (for unused accounts)
{
"Version": "2012-10-17",
"Statement": [
{
"Sid": "NoAWSAccess",
"Effect": "Deny",
"Action": "*",
"Resource": "*"
}
]
}
For accounts with OU: Sandbox, which your employees may use to learn and do proof of concepts on AWS services, turn off permissions such that users stay within your security guardrails. You can scope these SCPs to apply to all IAM users and roles except for administrator roles and to not apply to roles that you as an administrator create.
SCP: Deny access to IAM with role exception
Where to apply: Sandbox OU
{
"Version": "2012-10-17",
"Statement": [
{
"Sid": "DenyAccessWithException",
"Effect": "Deny",
"Action": [
"iam:AttachRolePolicy",
"iam:DeleteRole",
"iam:DeleteRolePermissionsBoundary",
"iam:DeleteRolePolicy",
"iam:DetachRolePolicy",
"iam:PutRolePermissionsBoundary",
"iam:PutRolePolicy",
"iam:UpdateAssumeRolePolicy",
"iam:UpdateRole",
"iam:UpdateRoleDescription"
],
"Resource": [
"arn:aws:iam::*:role/name-of-role-to-deny"
],
"Condition": {
"StringNotLike": {
"aws:PrincipalARN": "arn:aws:iam::*:role/name-of-admin-role-to-allow"
}
}
}
]
}
As this OU is used for experimentation and learning purposes, you may also want to restrict accounts within this OU to operations to only particular regions. The following example SCP denies operations outside of eu-central-1 [Europe (Frankfurt)] and eu-west-1 (Europe (Ireland)] regions. You can replace this with any regions of your choosing. This SCP uses the NotAction statement to exempt global services or services with endpoints in us-east-1 [US East (N. Virginia)] so that these global services can be used, but any other requests to services in us-east-1 are denied. When using this SCP, make sure that you verify the list of services and include other global services in the NotAction statement as needed.
SCP: Deny actions outside approved regions
Where to apply: Sandbox OU, or any accounts/OUs where you have regulations that require region restrictions for your resources.
{
"Version": "2012-10-17",
"Statement": [
{
"Sid": "DenyAllOutsideEU",
"Effect": "Deny",
"NotAction": [
"a4b:*",
"acm:*",
"aws-marketplace-management:*",
"aws-marketplace:*",
"aws-portal:*",
"budgets:*",
"ce:*",
"chime:*",
"cloudfront:*",
"config:*",
"cur:*",
"directconnect:*",
"ec2:DescribeRegions",
"ec2:DescribeTransitGateways",
"ec2:DescribeVpnGateways",
"fms:*",
"globalaccelerator:*",
"health:*",
"iam:*",
"importexport:*",
"kms:*",
"mobileanalytics:*",
"networkmanager:*",
"organizations:*",
"pricing:*",
"route53:*",
"route53domains:*",
"s3:GetAccountPublic*",
"s3:ListAllMyBuckets",
"s3:PutAccountPublic*",
"shield:*",
"sts:*",
"support:*",
"trustedadvisor:*",
"waf-regional:*",
"waf:*",
"wafv2:*",
"wellarchitected:*"
],
"Resource": "*",
"Condition": {
"StringNotEquals": {
"aws:RequestedRegion": [
"eu-central-1",
"eu-west-1"
]
},
"ArnNotLike": {
"aws:PrincipalARN": [
"arn:aws:iam::*:role/Role1AllowedToBypassThisSCP",
"arn:aws:iam::*:role/Role2AllowedToBypassThisSCP"
]
}
}
}
]
}
In addition to Sandbox OU, you will want to safeguard your organization from common exploits, such as unauthorized users using privilege escalations to exploit vulnerabilities in your IAM permissions. You must pass an IAM role to the service to configure many AWS services. This is a commonly used pattern to allow a service perform an action on your behalf. However, you will want to make sure that only these PassRole or GetRole actions are allowed when the request tag key (PassRoleKey) conforms to a special descriptor (PassRoleSpecialDescriptor). Replace PassRoleKey and PassRoleSpecialDescriptor to the key and values of your choice.
SCP: Deny ability to pass IAM roles
Where to attach: the organization root
{
"Version": "2012-10-17",
"Statement": [
{
"Sid": "DenyPassRoleWithoutSpecialDescriptor",
"Effect": "Deny",
"Action": [
"iam:PassRole",
"iam:GetRole"
],
"Resource": [
"*"
],
"Condition": {
"ForAllValues:StringNotEqualsIfExists": {
"aws:RequestTag/PassRoleKey": [
"PassRoleSpecialDescriptor"
]
}
}
}
]
}
You can protect secrets that you use for your database or applications by using AWS Secrets Manager. Secrets Manager helps you protect database credentials, API keys, OAuth tokens, and other secrets throughout their lifecycle. You can deny member accounts access to delete administrator issued secrets. You can attach this to OUs where administrator issued resources will make use of the secrets.
SCP: Deny changes to Secrets Manager
Where to attach: Wherever secrets are used (e.g. Workloads OU)
{
"Version": "2012-10-17",
"Statement": [
{
"Sid": "DenySecretUpdates1",
"Effect": "Deny",
"Action": [
"secretsmanager:UntagResource",
"secretsmanager:GetSecretValue",
"secretsmanager:RestoreSecret",
"secretsmanager:DeleteSecret",
"secretsmanager:UpdateSecret"
],
"Resource": "arn:aws:secretsmanager:*:123456789012:secret:secret-id"
},
{
"Sid": "DenySecretUpdates2",
"Effect": "Deny",
"Action": "secretsmanager:ListSecrets",
"Resource": "*"
}
]
}
Amazon GuardDuty is a threat detection service that continuously monitors for malicious activity and unauthorized behavior to protect your AWS accounts, workloads, and data stored in Amazon Simple Storage Service (S3). As an owner of an administrator or delegated administrator GuardDuty account, you can enable and manage GuardDuty for any account in the organization.
You can use the following SCP to prevent changes to GuardDuty configurations by member accounts. You can use detector ID with wildcard as in the following example SCP “admin-detector-*” to protect administrator issued GuardDuty resources.
SCP: Deny changes to GuardDuty
Where to attach: the organization root
{
"Version": "2012-10-17",
"Statement": [
{
"Sid": "DenyGuardDutySpecificActions1",
"Effect": "Deny",
"Action": [
"guardduty:UpdateDetector",
"guardduty:DeleteDetector"
],
"Resource": "arn:aws:guardduty:*:123456789012:detector/admin-detector-*"
},
{
"Sid": "DenyGuardDutySpecificActions2",
"Effect": "Deny",
"Action": [
"guardduty:DisassociateFromMasterAccount",
"guardduty:StopMonitoringMembers"
],
"Resource": "*"
}
]
}
What Cost Management pillar related SCPs can I apply to my OUs?
The cost management pillar focuses on principles of cost optimization and cost awareness. You can implement a culture of cost optimization by treating the cloud as a differentiator and not as you would your on-premises resource fleet. Among the many advantages of AWS, the most important are the ability to pay only for what you use, match your supply (of resources) exactly with the demand (of your business), and its elasticity that helps you pre-plan or over-provision for peak capacity. Accordingly, when thinking about SCPs related to this pillar, you can build a cost control foundation by implementing cost aware policies.
Using AWS Budgets Actions, you can define the action that you want to take in your account when a budget exceeds its threshold (actual or forecasted amounts). This level of control will let you reduce unintentional overspending in your accounts. You can attach the following SCP to your root OU which prevents member accounts from updating Budget actions.
SCP: Deny changes to AWS Budget Actions
Where to apply: the organization root
{
"Version": "2012-10-17",
"Statement": [
{
"Sid": "DenyCostManagementChanges",
"Effect": "Deny",
"Action": [
"budgets:ModifyBudget",
"budgets:DeleteBudgetAction"
],
"Resource": [
"arn:aws:budgets::*:budget/Admin-*/action/Admin-action-*"
],
"Condition": {
"StringNotLike": {
"aws:PrincipalAccount": [
"arn:aws:iam::123456789012:root",
"arn:aws:iam::123456789012:user/*",
"arn:aws:iam::123456789012:role/*"
]
}
}
}
]
}
In addition to the SCP above, you can review “How to manage cost overruns in your AWS multi-account environment,” a blog series that uses an AWS Budget action to set a restrictive SCP on accounts that surpass a budget threshold. This is another use-case that can be applied to your Sandbox OU to ensure you maintain cost controls for your experimental accounts.
AWS Cost Anomaly Detection leverages advanced machine learning (ML) technologies to identify anomalous spend and root causes, so that you can quickly take action. Cost anomaly detection saves you time by vending automated root cause analysis, pin-pointing potential cost drivers, such as usage type (e.g., data transfer cost), specific AWS service, Region, and member account(s). You can attach the following SCP to your root, which prevents member accounts from updating cost anomaly monitors. Replace the account ID with your management account ID. The admin- prefix denotes only a set of IAM users or IAM roles from the management account will have access to make updates to cost anomaly monitors.
SCP: Limit changes to Cost Anomaly Detection, except when using a specific IAM user or Role
Where to apply: the organization root
{
"Version": "2012-10-17",
"Statement": [
{
"Sid": "VisualEditor0",
"Effect": "Deny",
"Action": [
"ce:UpdateAnomalyMonitor",
"ce:UpdateAnomalySubscription",
"ce:DeleteAnomalySubscription",
"ce:DeleteAnomalyMonitor"
],
"Resource": "*",
"Condition": {
"ForAnyValue:StringNotLikeIfExists": {
"aws:PrincipalAccount": [
"arn:aws:iam::123456789012:root",
"arn:aws:iam::123456789012:user/admin-*",
"arn:aws:iam::123456789012:role/admin-*"
]
}
}
}
]
}
Conclusion
As you have seen above, SCPs provide a centralized mechanism to codify best practices and let your builders innovate while staying within your security guidelines. We have reviewed common constructs from AWS Well-Architected and provided you with some examples that you can further expand for your needs. You should spend time in creating acceptable patterns of permissions based on your business needs, team skills, and security invariants. Iterate often and improve/expand on these patterns as your cloud adoption matures. This will help you build a secure cloud foundation.
To get started with building your own organization, refer to the AWS Organizations Getting Started Guide and create your first SCP.
Codify your best practices using service control policies: Part 1
=======================
Each AWS account enables cellular design – it provides a natural isolation of AWS resources, security, partitions access, and establishes billing boundaries. Separation of concern through multi-account setup is a key design principle that customers use to experiment, innovate, and scale quickly on AWS. The basis of a multi-account AWS environment is AWS Organizations, which lets you centrally manage and govern multiple accounts. This central governance of multiple accounts is best done using service control policies (SCPs).
In this post, I will discuss what SCPs are, why you should create SCPs, and the strategy you can use to implement SCPs. I will also discuss how to continue iterating and improving SCPs as your workloads and business needs change. In Part 2 of this blog, I will discuss how you can create SCPs using constructs from AWS Well-Architected.
What are service control policies?
Simply put, SCPs are preventive guardrails. You can use SCPs to define the maximum allowable permissions for AWS Identity and Access Management (IAM) users or roles within your organization across member/linked accounts. As a guardrail, an SCP doesn’t grant permissions. You must create identity- or resource-based policies and attach those to IAM users or roles to grant permissions. Additionally, there are tasks and entities that cannot be restricted by SCPs. SCPs affect only IAM users or roles in the member accounts in an organization, and they have no effect on the management account or service-linked roles. You can refer to effects of SCPs on permissions and IAM policy evaluation logic for further details.
SCPs can be attached to the organization root, OUs, or individual accounts. However we recommend you attach SCPs at OUs rather than to individual accounts to ease policy management and troubleshooting. If you are familiar with the best practice guidance for OUs, and use an Exceptions OU (for those special case workloads that may warrant an exception from security or auditing conditions), it is recommended to attach SCPs directly to such accounts instead.
Note that every OU and account in an organization must have at least one directly attached SCP, if SCPs are enabled. For more details see how the inheritance of SCPs works. SCPs are available in All features mode of AWS Organizations.
Why should I create service control policies?
Using SCPs lets you set preventive guardrails and stop worrying about new or existing member accounts assigning permissions that you don’t want them to assign. SCPs can also help implicitly codify the rules for what you consider to be the best practices for your workloads. For example, if you do not want to incur database snapshot charges for development stage databases on RDS, then you can create a deny SCP for rds:CreateDBSnapshot and attach it to your SDLC OUs. On the other hand, you may not want anyone to accidentally delete RDS database snapshots in production OUs or accounts. In that case, you can attach a deny SCP for rds:DeleteDBSnapshot. If a development team asks for permissions to remove these SCPs, then you can dive deep on why they want that access to see if an exception can be made. These guardrails will instill best practices for your workloads and help your business adhere to generally accepted design principles.
There are two main strategies that customers can use to create SCPs:
deny list strategy
allow list strategy
Deny list strategy
A deny list strategy works off of the premise that an explicit Deny will always override both explicit and implicit Allow. A deny list strategy starts with a FullAWSAccess SCP (an AWS managed policy), which is by default attached to every OU and account when an organization is created.
If you took no additional action, then the effect of this SCP will let users and roles with appropriate privileges within your accounts grant all IAM permissions. As such, you should create and attach an explicit deny SCP at an appropriate OU or account to deny permissions. Once applied to the OU, accounts within the OU are not able to use the denied API, and permissions cannot be added back lower in the hierarchy.
In the following example, consider DenyAllIAMAccess as an SCP that denies access to IAM APIs. This is a commonly used SCP that improves your security because it limits the ability for users to create IAM roles or permissions. If this SCP is attached at the Workloads OU, then it will deny access to all IAM APIs for accounts and OUs under it while retaining access to other APIs based on the direct attachment of FullAWSAccess SCP to all accounts and OUs from root to leaf.
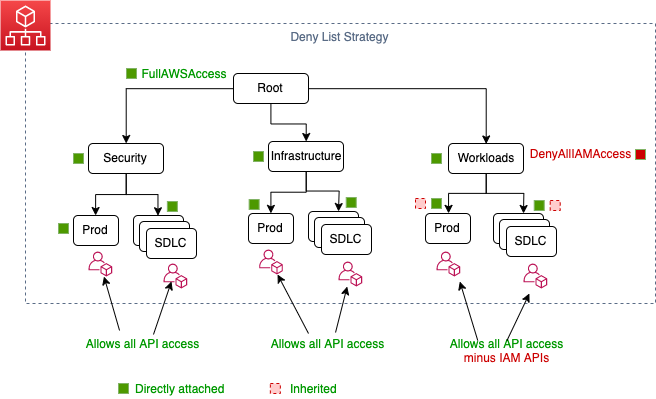
Figure 1: Deny List strategy example with effects of a deny SCP set at an OU level
Allow list strategy
On the other hand, the allow list strategy works off of the premise that an explicit allow overrides an implicit deny. In this strategy, you start by removing the default FullAWSAccess SCP that is attached when an organization is created. Then, you create your own SCPs with an explicit allow, and attach those to accounts and every OU above it, up to and including the root. Every SCP in the hierarchy, starting at the root, must explicitly allow the APIs that you want to be usable in the OUs and accounts below it.
In the following diagram, AllowAllIAMAccess is an SCP that allows access to IAM APIs (iam:*). AllowAllEC2Access is an SCP that allows access to Amazon Elastic Compute Cloud (EC2) APIs (ec2:*). When you attach AllowAllIAMAccess to the organization root, Security OU, Prod-S, and SDLC-S accounts, it allows Prod-S and SDLC-S accounts to grant permission to IAM APIs. Similarly, AllowAllEC2Access allows access to Prod-W and SDLC-W accounts to grant EC2 related permissions. Even though the Infrastructure branch inherits both of the SCPs from Root, unless those SCPs are explicitly added to the Infrastructure branch, then Prod-I and SDLC-I accounts cannot access any AWS APIs.
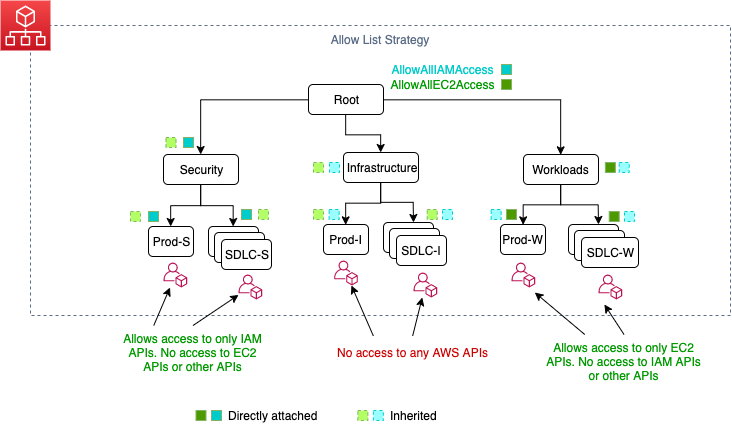
Figure 2: Allow List strategy example with effects of allow SCPs set at OU levels
SCPs are JSON policies and follow almost the same syntax as IAM permissions policies. You can review the syntax here. All of the AWS global condition context keys can be used within the Condition element of an SCP based on their availability context.
Using a deny list strategy, account administrators can delegate all services and actions until you create and attach an SCP that denies a specific service or set of actions. Deny statements require less maintenance, because you don’t need to update them when AWS adds new services. Deny statements usually use less space, thus making it easier to stay within the maximum size for SCPs.
Patterns of functional “allowances” for your OUs
As you will see in the best practices for organizational units post, you create OUs following a functional or a control dimension, rather than mirroring your company’s reporting structure. OUs are your way to enforce a cellular structure large enough not to overwhelm policy management and governance, but small enough to contain issues arising from common failure modes. After you have created OUs, you can invest time in creating patterns or decisions of functional “allowances” that will help define your initial SCPs.
Considering permissions governance is an on-going effort, you should index on starting with the least privilege permissions. However, even with the least privilege approach, you may add extra permissions without first knowing if your constituents will use them. You can iterate periodically to review and remove permissions based on actual permissions usage to reduce guesswork. AWS Identity and Access Management (IAM) access advisor can help you easily do that by showing the service permissions granted to an entity (user, role, group) and when those services were last accessed. You can use this information to revise your policies.
Testing effects of SCPs
AWS strongly recommends that you don’t attach SCPs to the root of your organization without thoroughly testing the impact that the policy has on accounts. It is easy to test policy impacts. Simply create a PolicyStagingOU and add non-production member accounts in this OU. Attach your proposed SCP to this OU and test the impacts on member accounts. This helps an administrator with the ability to build and apply changes that they want to make, and in a non-production-impacting way.
Conclusion
As you have seen above, SCPs provide a centralized mechanism for codifying best practices and letting your builders innovate while staying within your security guidelines. You should spend time creating acceptable patterns of permissions based on your business needs, team skills, and security invariants. Iterate often and improve/expand on these patterns as your cloud adoption matures. This will help you build a secure cloud foundation.
To get started with building your own organization, refer to the AWS Organizations Getting Started Guide and create your first SCP. You can also learn more about AWS Control Tower, a AWS-managed governance solution built on AWS Organizations, which includes a number of built-in managed policies.
Identify operational issues quickly by using Grafana and Amazon CloudWatch Metrics Insights (Preview)
=======================
Amazon CloudWatch has recently launched Metrics Insights (Preview) – a fast, flexible, SQL-based query engine that enables you to identify trends and patterns across millions of operational metrics in real-time. With Metrics Insights, you can easily query and analyze your metrics to gain better visibility into the health and performance of your infrastructure and large scale applications. This capability is now also available in Open Source Grafana and in Amazon Managed Grafana.
For the last two years, Grafana users have been analyzing CloudWatch metrics using SEARCH expressions. Now with the Metric Insights integration in Grafana release 8.3, which was completed in partnership with the AWS and Grafana Labs, Grafana extends the metric analytics capabilities with flexible querying and on-the-fly metric aggregations in order to respond promptly to operational problems. Metrics Insights also works with Grafana Alerting (introduced in Grafana 8.0), allowing users to create alerts powered by CloudWatch Metrics Insights that quickly target problems in infrastructures as they happen.
With Metrics Insights, you can slice and dice your operational metrics with your dimensions to dive deep and identify issues to the finest granular detail. For example, you can analyze thousands of Amazon EC2 instances by CPU utilization to troubleshoot an underperforming application. You can group your metrics by InstanceId to narrow down your analysis and identify failing instances rapidly. Once the instance is isolated, you can now recover the application by rebooting problematic instances. Moreover, you can use your queries to create powerful visualizations that will stay up to date as resources are deployed or shut down, helping you proactively monitor and identify issues quickly.
Metrics Insights comes with standard SQL query language, giving you the flexibility to group your metrics in real-time based on your use cases. You can use WHERE clause in order to narrow down your analysis or use ORDER BY to sort your results. For example, DESC displays in (descending) order, to list your time series such that the highest data point will be returned first. Likewise, LIMIT clause enables you to limit the number of results that can be returned, helping you to run “TOP N” type queries.
Amazon CloudWatch plugin to query CloudWatch Metrics Insights
CloudWatch Metrics Insights is available through the GetMetricData API, which means that if you already have a CloudWatch data source plugin setup in Grafana, there’s no need for additional configuration. To use Metrics Insights in the Amazon CloudWatch plugin in Grafana, you must select the Metric Query type.
The Metric Query type has two different modes — a Builder mode and a Code editor mode.
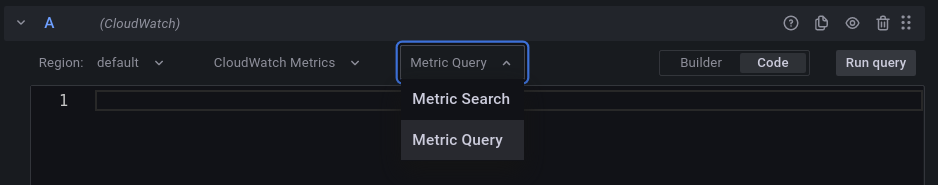
Metric Query mode in the CloudWatch plugin
CloudWatch Metrics Insights uses a dialect of SQL. The syntax is as follows:
SELECT FUNCTION(MetricName)
FROM Namespace | SCHEMA(...)
[ WHERE labelKey OPERATOR labelValue [AND|...]]
[ GROUP BY labelKey [, ...]]
[ ORDER BY FUNCTION() [DESC | ASC] ]
[ LIMIT number]
Metrics Insights makes it easy to get started. Even if you don’t know SQL, you can use the visual query builder to browse through your existing metrics and dimensions, by selecting the metrics of interest, resource names, and filters to narrow down your analysis. Then the console automatically constructs your SQL queries for you based on your selections.
Builder mode in the CloudWatch plugin
You can use the code editor in the Code mode of the CloudWatch plugin to type in your raw SQL queries anytime to dive deep and identify issues to the finest granular detail. The code editor comes with built-in autocompletion support that provides suggestions for keywords, functions, namespaces, metrics, dimension keys, and dimension values.
The following example demonstrates how to view the top five instances with the highest average CPU utilization, ordered by maximum, and in descending order. The autocompleter provides smart suggestions throughout the composition of the query.
Code mode in the CloudWatch plugin
Grafana template variables allow you to create more interactive and dynamic dashboards. Instead of hardcoding values like namespace, metric, and aggregation functions in your queries, you can use variables in their place. Variables are displayed as dropdown lists at the top of the dashboard. These dropdowns make it easy to change the data displayed in your dashboard. When using Metric Query type in the CloudWatch plugin, you can use template variables in both the Builder and the Code mode.
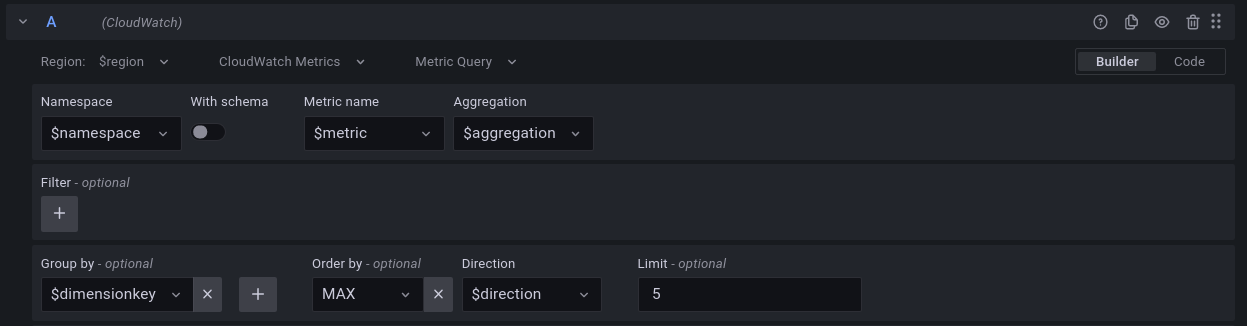
Template variables in the Grafana plugin
In this post, we went through the integration between OpenSource Grafana and CloudWatch Metrics Insights, how you can use Metrics Insights’ SQL based query engine on OpenSource Grafana to flexibly analyze and group your metrics at scale in real time, and quickly identify the operational issues to reduce mean-time to resolution.
To learn more about CloudWatch Metrics Insights or to get started, check out the CloudWatch Metrics Insights documentation and from Grafana.
Introducing AWS AppConfig Feature Flags In Preview
=======================
Modern DevOps practices require development teams to continuously iterate their applications based on customer feedback. These iterations are mostly comprised of the introduction of new features within the application, or tuning the applications to cope with operational events such as limit increases or improving fault tolerance.
Feature flags, also known known as feature toggles, are widely used by developers and Devops professionals to quickly enable or disable features within their application code. One common use case is to simplify the launch of new features to an application. Developers can deploy the application code in advance and hide it behind a feature flag that prevents end users from accessing the feature. When it is time to make the feature public, developers enable the feature flag and the functionality becomes available to their users. Another use case is for DevOps professionals to enable an operational flag that turns on verbose logging when their application experiences an operational event and turn it back off when the operational event ends.
In 2019, we announced the launch of AWS AppConfig to enable our customers to deploy application configuration changes to their application using the same best practices that are used by thousands of teams across Amazon. AWS customers use AWS AppConfig to centrally manage and deploy their application configuration data and feature flags at application runtime.
While our customers have been using AWS AppConfig for use cases such as feature flags, allow-listing, and centrally managing their configuration data, we recently announced the launch of AWS AppConfig Feature Flags. This managed experience provides customers with the ability to quickly create feature flag configurations, define flags and flag attributes, define constraints to validate the flag attribute values and deploy new features to their application at runtime. Thousands of teams across Amazon use this software best practice to continuously release features to our customers and continuously iterate products based on customer feedback.
AWS AppConfig Feature Flags provide customers with the control to roll out new features at the rate that they want to introduce the change to their application. Customers can validate these changes to make sure that they are free of errors and match the expected input of their application. While deploying new values gradually, in case there is an error, AWS AppConfig can roll back the changes automatically to prevent any application outages.
To introduce you to AWS AppConfig Feature Flags, we’ll build a sample application that takes advantage of feature flags and show how the new managed experience works.
Sample Application Overview
Our sample application Feature Flag Store is an e-commerce website that displays multiple items on the homepage. The website lets customers explore more about the products by selecting them. Once done browsing, the website lets customers add items to the cart and complete checkout using one of the listed payment options. We will use AppConfig feature flags to deploy new features to this website without a full code deployment. We will walk through the creation and deployment of the following new features:
1) the ability to show the inventory of an item and
2) a secondary payment option within the checkout experience
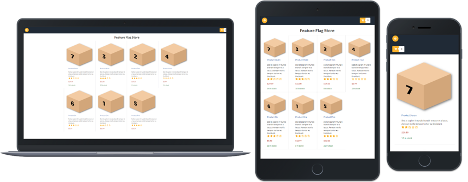
The application consists of a static website for the frontend and an API based serverless backend using Amazon API Gateway, AWS Lambda, and Amazon DynamoDB. The feature flags will be created and fetched from AWS AppConfig. The application frontend is built using React and aimed at delivery through AWS Amplify Hosting . It can run locally without deployment to Amplify Hosting for development and demo purposes.
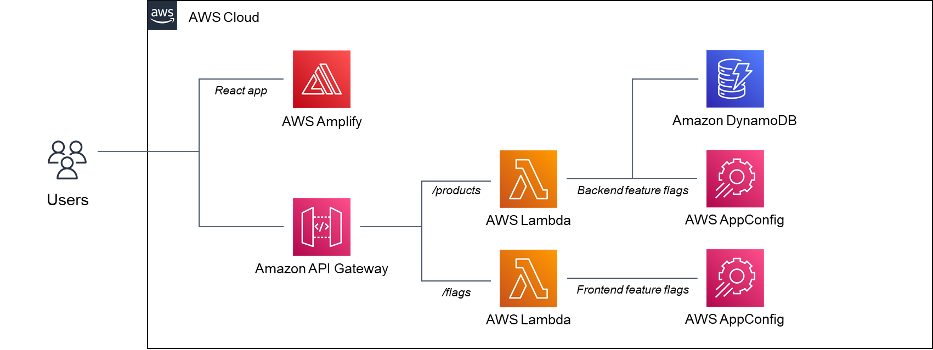
Our application uses two Lambda functions. One of the Lambda functions retrieves the list of products from an Amazon DynamoDB table and fetches feature flags from AWS AppConfig. The second Lambda function fetches feature flags from AWS AppConfig to turn on the front-end feature. Both Lambda functions use the AWS AppConfig Lambda extension as a layer to fetch config data from AWS AppConfig. Integrating the AWS AppConfig Lambda extension with your Lambda functions simplifies the process of fetching configurations from AppConfig. You can also use AWS AppConfig to deploy configuration and feature flags to applications hosted on Amazon Elastic Compute Cloud (EC2) , containers, on-premises servers, IoT devices, and mobile applications.
We will first create the feature flags using AWS AppConfig and then introduce the new features to our application.
Create AWS AppConfig Application, Environment, and Feature Flags
- Go to AWS AppConfig in the AWS Management console and select “Get Started”.
- Select Create Application and enter your application name. Take a note of the application ID in the URL. We will use the application ID as we deploy the application.
 Take a note of the application ID in the URL. We will use the application ID as we deploy the application.
- Once the application is created, select the Configuration profiles and feature flags tab. This tab now lets you store the free form configurations and feature flags. We will now create a feature flag configuration profile by selecting Create.
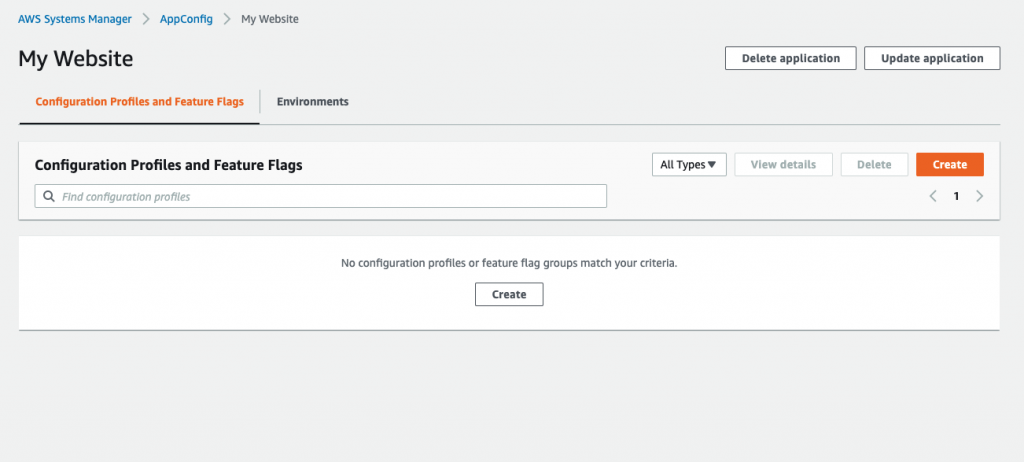
- Select Feature flag and create your feature flag configuration profile.
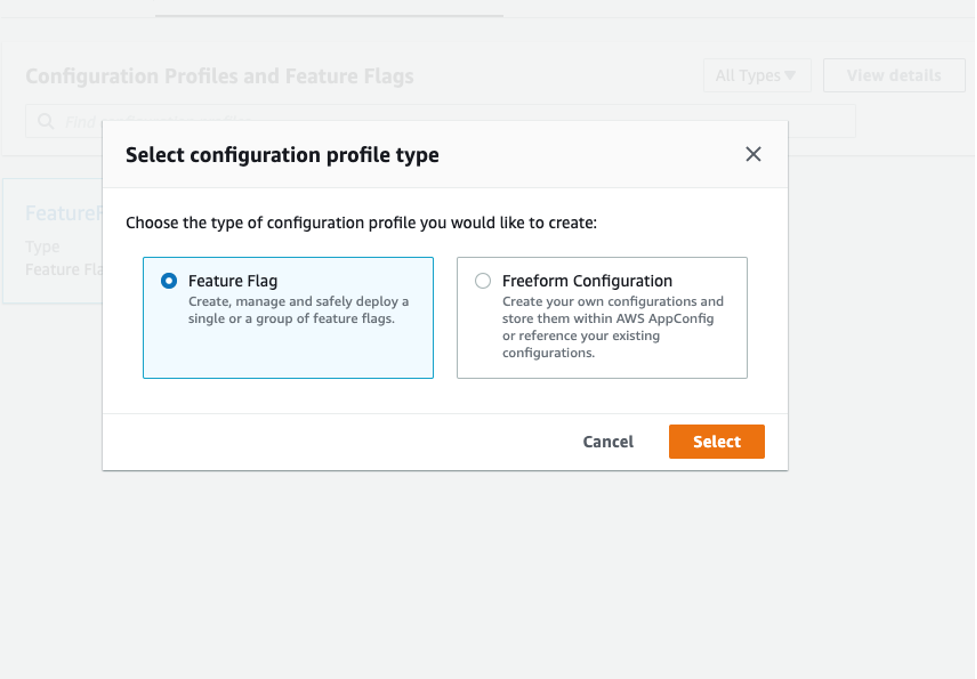
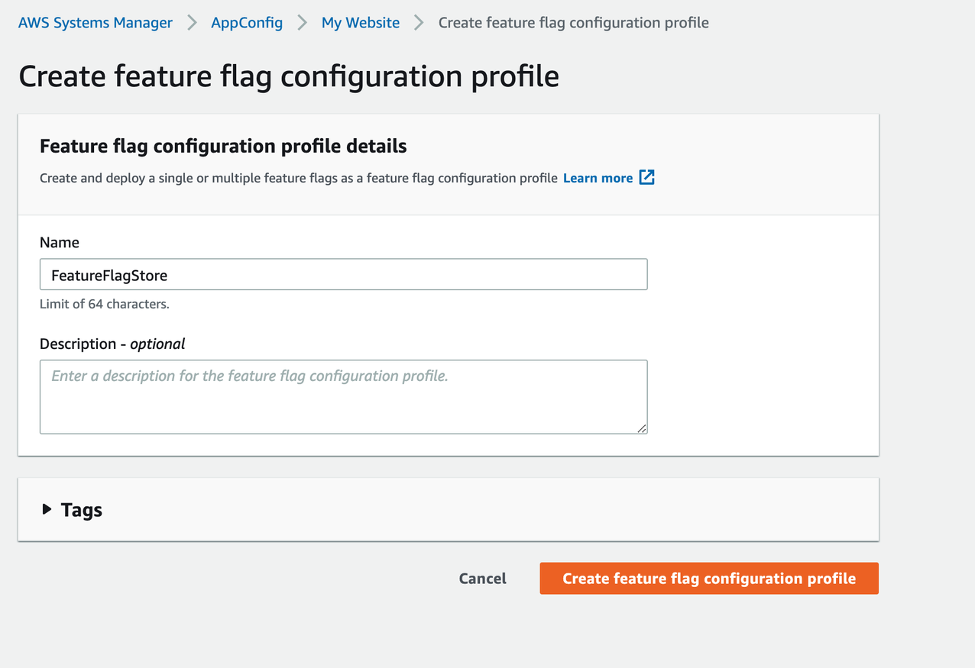
- We have successfully created a feature flag configuration profile. This configuration profile lets you create and centrally manage feature flags for your application. We will now create the two feature flags – one that lets customers view the inventory of an item, and the other that enables mobile payments as a checkout option.
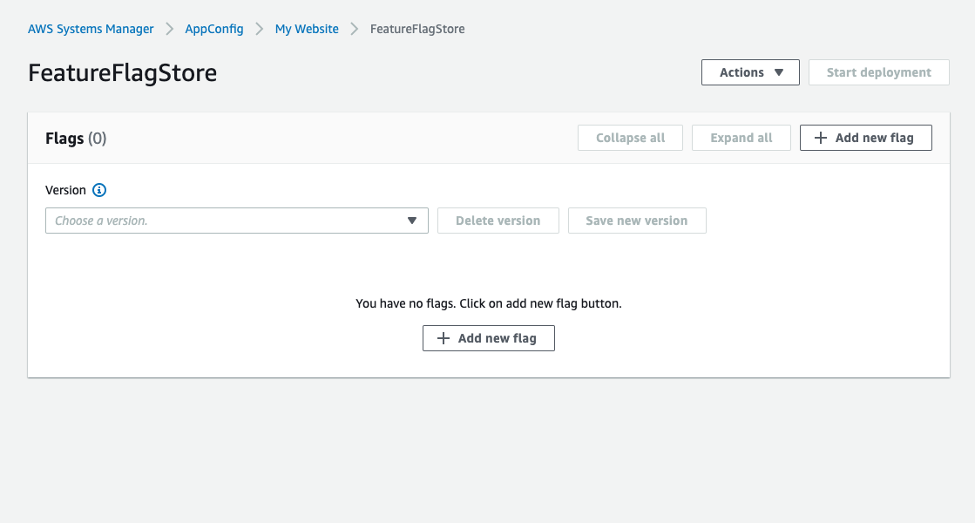
- Select Add New Flag to start creating flags. We will enter the flag name as “show-stock”. AppConfig automatically populates the unique flag key. You can also enable or disable the flag here before creating it.
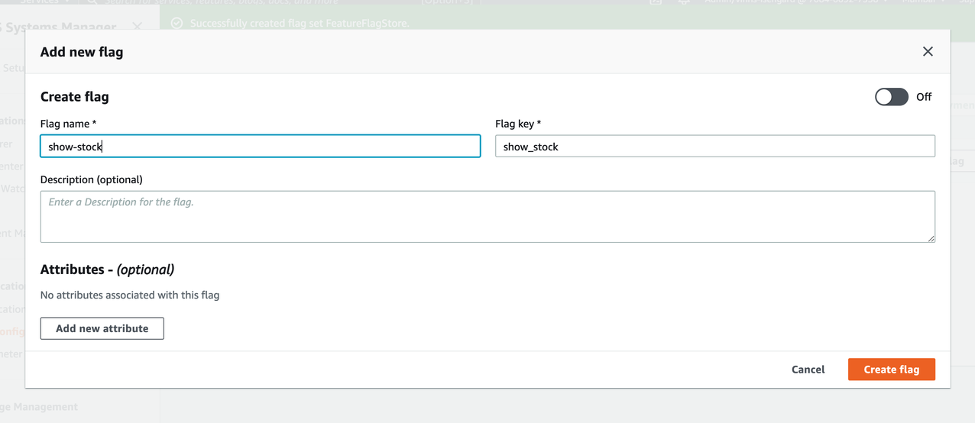
- AppConfig lets you not only create a Boolean flag that will let the code path be executed, but also store granular values within the flag as attributes. For example, if a developer wanted to enable the “show stock” feature to the customers, but also wanted to limit the value of maximum items to be displayed to 10, then they can add an attribute that controls the property of the flag. AppConfig also lets you add constraints that enable you to validate the attribute values. You can add multiple attributes that can be enabled or disabled as the flag data becomes available to the application. AppConfig supports the following attribute types:
- String
- Number
- Boolean
- String Arrays
- Number Arrays
- Create another flag with the key as “mobile-payment” within the same configuration profile as shown in the following. We will now add an attribute in this flag which will change how the text corresponding to this option is displayed on the UI. Select Add an attribute and set the attribute key as “title”, attribute type as “string” and type in any string value. Select Create flag.
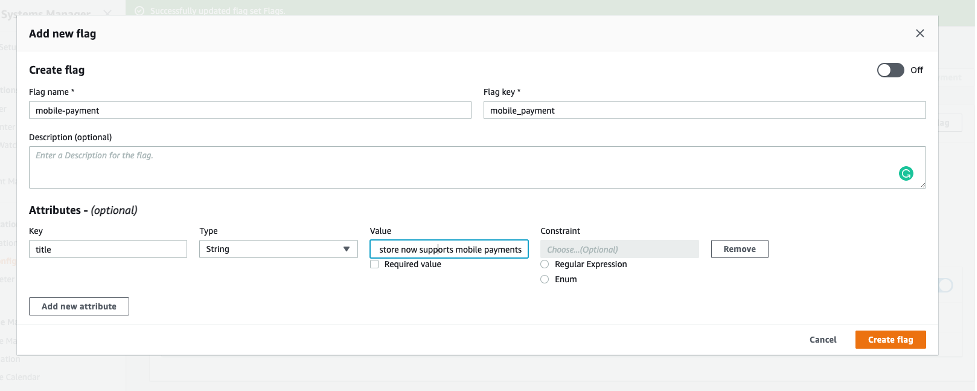
- Select Save new version to save the unwritten changes. Note that the two feature flags are not enabled yet.
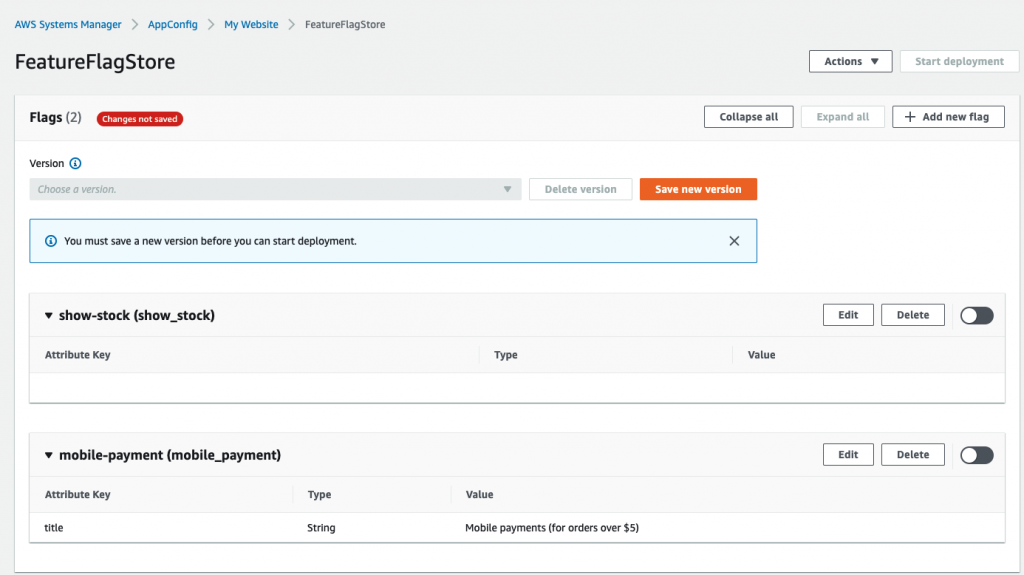
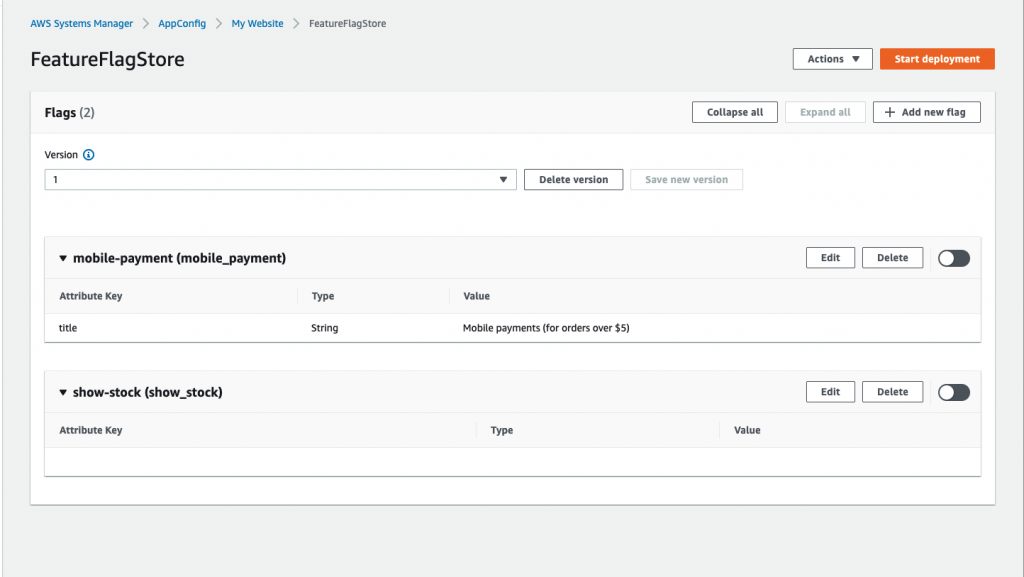
- Select Start Deployment. Select Create Environment to create the environment to which this configuration will be deployed to. Take a note of the environment ID. While creating the environment, you can optionally add Amazon CloudWatch alarms in the monitors section. Adding a monitor lets AWS AppConfig roll back the configuration deployment to the previous version in case an error occurs while deploying the configuration.
- Start deployment to deploy the flags. At this step, select deployment strategy of your choice. Select Start deployment to deploy the feature flags.
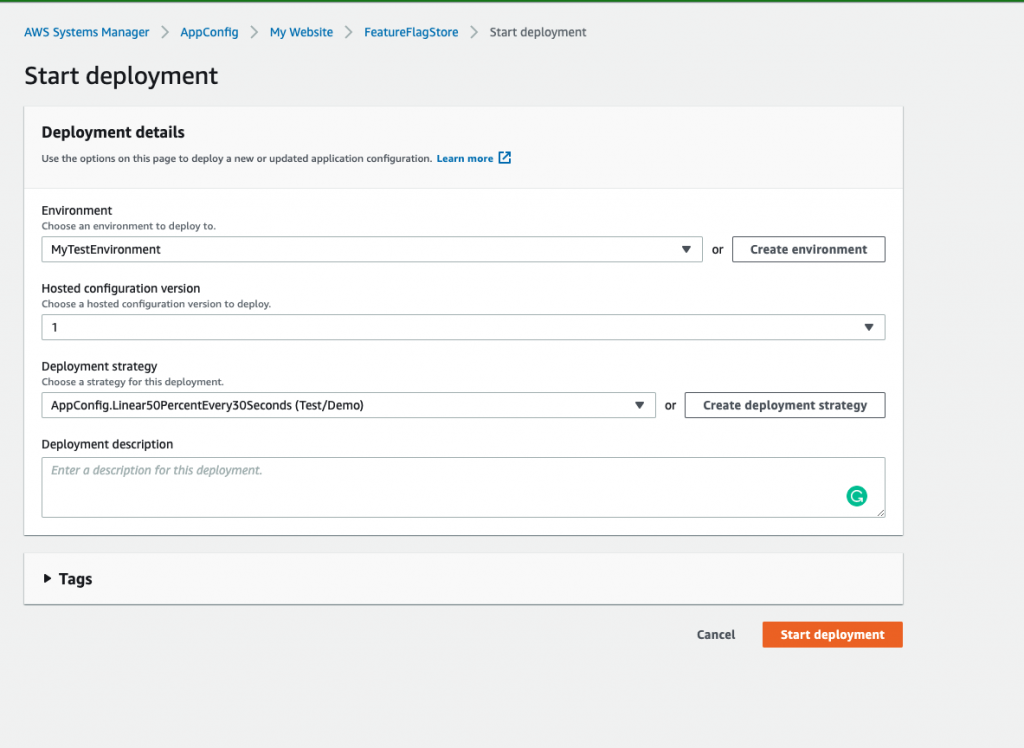
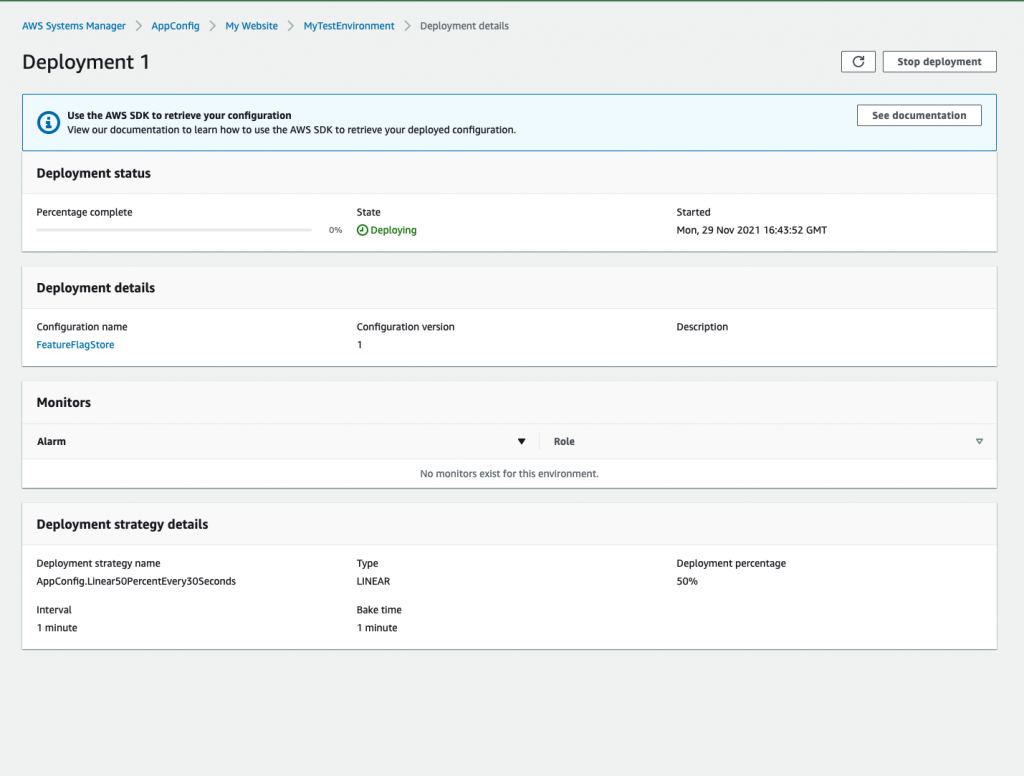
Note that when you create a feature flag configuration profile, AWS AppConfig saves the data along with some metadata as a hosted configuration. You can use the following CLI command to view the JSON file that is created by AppConfig.
aws appconfig get-hosted-configuration-version --application-id <value> --configuration-profile-id <value> --version-number <value> <filename>
You will get the following JSON as the output.
{
"flags": {
"mobile_payment": {
"_createdAt": "2021-10-01T20:58:48.884Z",
"_updatedAt": "2021-10-01T20:58:48.884Z",
"attributes": {
"title": {
"constraints": {
"type": "string"
}
}
},
"name": "mobile-payment"
},
"show_stock": {
"_createdAt": "2021-10-01T18:46:02.458Z",
"_updatedAt": "2021-10-01T18:46:02.458Z",
"name": "Show-stock"
}
},
"values": {
"mobile_payment": {
"_createdAt": "2021-10-01T20:58:48.884Z",
"_updatedAt": "2021-10-01T20:58:48.884Z",
"enabled": false,
"title": "Mobile payments (for orders over $5)"
},
"show_stock": {
"_createdAt": "2021-10-01T18:46:02.458Z",
"_updatedAt": "2021-10-01T18:46:02.458Z",
"enabled": false
}
},
"version": "1"
}
To retrive the deployed configuration, you can call GetLatestConfiguration API as described in our documentation. As a response to the GetLatestConfiguration API call, the information that defines your feature flags and attributes will be stripped out. The simplified JSON contains a map of keys that match each of the flag keys you specified and values that are a map with the “enabled” attribute either true or false. In this case, since we have not yet enabled the features, this attribute will be set to false. You will recieve the following output as a result of the GetLatestConfiguration call.
{
"mobile_payment": {
"enabled": false
},
"show_stock": {
"enabled": false
}
}
We will now install the application and release the new features. The backend is built using the AWS Serverless Application Model (SAM) and requires the AWS SAM CLI for installation. See instructions for installing AWS SAM CLI here.
Install the backend application
- Clone the sample application repo onto your local development machine using
gh repo clone aws-samples/aws-appconfig-feature-flags
- Run the following commands to change to the backend directory and install dependencies.
cd appconfig-feature-flags
cd backend
npm install
- Process and build your application using the AWS SAM template file using
sam build
- Deploy the backend application using the following command and follow the prompts.
sam deploy --guided
- Add the IDs of the AppConfig Application, Environment, and Configuration Profile when prompted, and confirm all of the deployment prompts.
- In the output of the deployment, note the DynamoDBTableName key and the HTTPApiUrl key.
- You will get the output similar to the following:
Key DynamoDBTableName Description The name of your DynamoDB table Value sam-app-DynamoDBTable-XXXXXXXXXXX
Key HttpApiUrl Description URL of your API endpoint Value https://XXXXXXXX.execute-api.XX-XXXXXXXX-1.amazonaws.com
Populate DynamoDB table with sample data
- Open the template file dynamodb.json.template and replace YOUR_DYNAMODB_TABLE_NAME with the DynamoDBTableName key from sam deploy output. Save the file as dynamodb.json.
- Run the following command to populate the DynamoDB table with sample data:
aws dynamodb batch-write-item --request-items file://dynamodb.json
- You will get the following output:
{
"UnprocessedItems": {}
}
Install the front-end application
- Change to the frontend directory and install the dependencies using
cd frontend
npm install
- Open the template file config.json.template in the folder src and replace YOUR_API_ENDPOINT with the HTTPApiUrl key from sam deploy output. Save the file as config.json.
- Start the local development server using the following
npm start
- Open http://localhost:3000/ in your browser to view the web application. You will see the following website displayed. The website contains multiple items listed but does not show the inventory for each item. Select any item and add the item to the cart. Go to your cart and you will see that you can only use “Debit card” as the only payment option. We will now use AWS AppConfig to deploy the feature flags, that we created earlier, to the application.
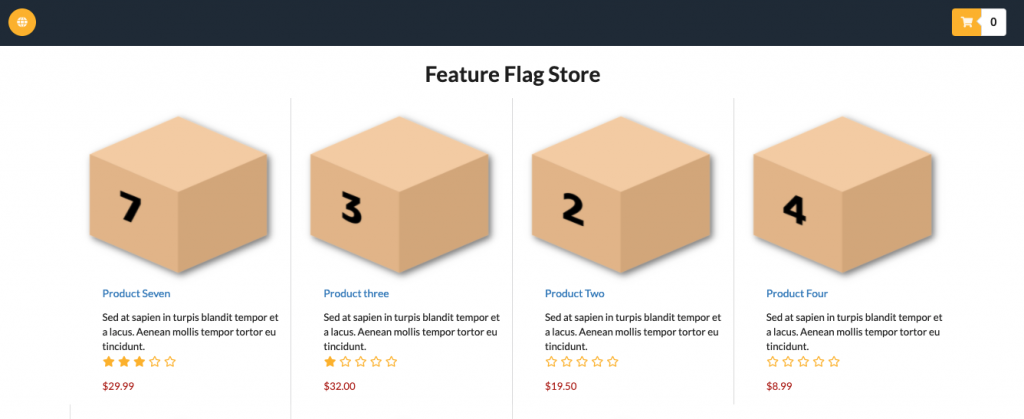
 Deploying AppConfig Feature Flags
- Go back to the feature flag configuration profile and enable both the flags by selecting the toggles. Save it as a new version.
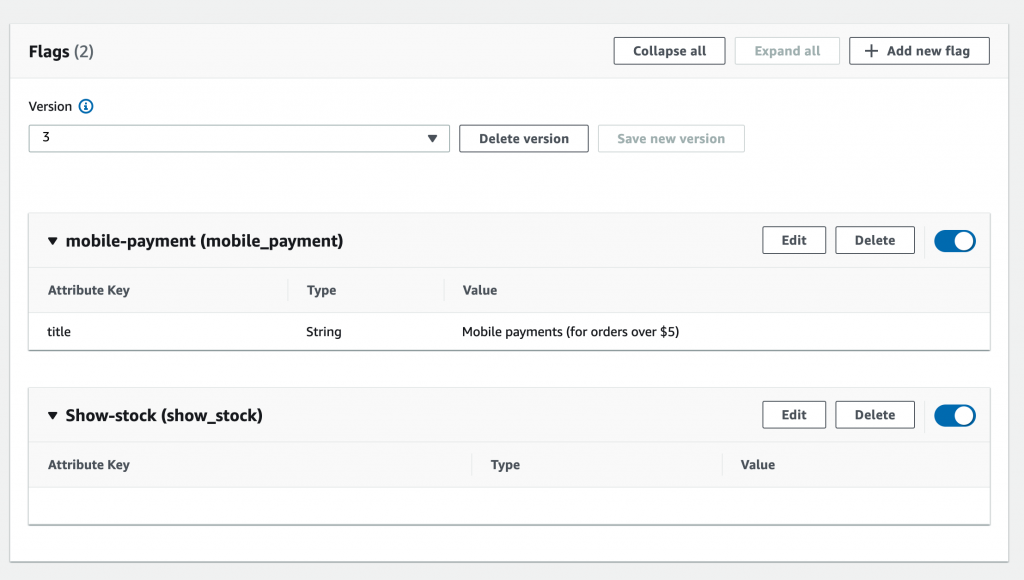
- Select Start Deployment to deploy the feature flags to the web application. Choose the environment and deployment strategy to deploy your flags, and then select Start Deployment again.
- You will be able to view the progress of the deployment on the deployment details page as follows. While this example uses the AWS AppConfig Lambda extension to retrieve the feature flags, you can refer to documentation on how to retrieve feature flags for your applications.
- Once the deployment is complete, reload your browser to see the features on the website at application runtime.
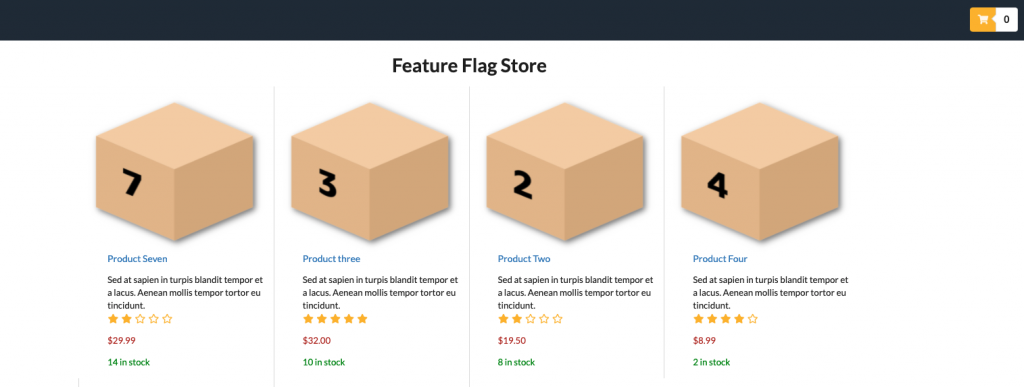
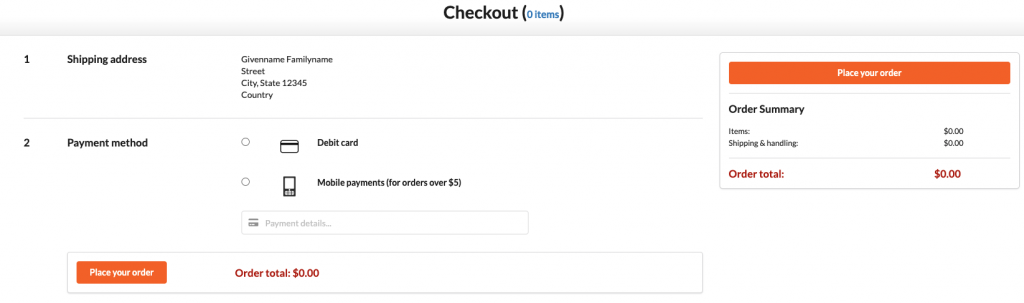
You can also call the GetLatestConfiguration API to see the JSON data that is retrieved by the application.
{
"mobile_payment": {
"enabled": true,
"title": "Mobile payments (for orders over $5)"
},
"show_stock": {
"enabled": true
}
}
Conclusion
AWS AppConfig feature flags let you safely release new features to your production environments independent of code deployments. This lets Developers and DevOps teams validate feature flag configuration data and deploy single or multiple feature flags to their application in a monitored and controlled way. Separating application configuration from code has been a best practice within Amazon for years, and AWS AppConfig feature flags have made it easier for our customers to use create, manage, and deploy their feature flags using AWS AppConfig.
Page 1|Page 2|Page 3|Page 4