Contents of this page is copied directly from AWS blog sites to make it Kindle friendly. Some styles & sections from these pages are removed to render this properly in 'Article Mode' of Kindle e-Reader browser. All the contents of this page is property of AWS.
Page 1|Page 2|Page 3|Page 4
Monitor AWS resources created by Terraform in Amazon DevOps Guru using tfdevops
=======================
This post was written in collaboration with Kapil Thangavelu, CTO at Stacklet
Amazon DevOps Guru is a machine learning (ML) powered service that helps developers and operators automatically detect anomalies and improve application availability. DevOps Guru utilizes machine learning models, informed by years of Amazon.com and AWS operational excellence to identify anomalous application behavior (e.g., increased latency, error rates, resource constraints) and surface critical issues that could cause potential outages or service disruptions. DevOps Guru’s anomaly detectors can also proactively detect anomalous behavior even before it occurs, helping you address issues before they happen; insights provide recommendations to mitigate anomalous behavior.
When you enable DevOps Guru, you can configure its coverage to determine which AWS resources you want to analyze. As an option, you can define the coverage boundary by selecting specific AWS CloudFormation stacks. For each stack you choose, DevOps Guru analyzes operational data from the supported resources to detect anomalous behavior. See Working with AWS CloudFormation stacks in DevOps Guru for more details.
For Terraform users, Stacklet developed an open-source tool called tfdevops, which converts Terraform state to an importable CloudFormation stack, which allows DevOps Guru to start monitoring the encapsulated AWS resources. Note that tfdevops is not a tool to convert Terraform into CloudFormation. Instead, it creates the CloudFormation stack containing the imported resources that are specified in the Terraform module and enables DevOps Guru to monitor the resources in that CloudFormation stack.
In this blog post, we will explain how you can configure and use tfdevops, to easily enable DevOps Guru for your existing AWS resources created by Terraform.
Solution overview
tfdevops performs the following steps to import resources into Amazon DevOps Guru:
It translates terraform state into an AWS CloudFormation template with a retain deletion policy
It creates an AWS CloudFormation stack with imported resources
It enrolls the stack into Amazon DevOps Guru
For illustration purposes, we will use a sample serverless application that includes some of the components DevOps Guru and tfdevops supports. This application consists of an Amazon Simple Queue Service (SQS) queue, and an AWS Lambda function that processes messages in the SQS queue. It also includes an Amazon DynamoDB table that the Lambda function uses to persist or to read data, and an Amazon Simple Notification Service (SNS) topic to where the Lambda function publishes the results of its processing. The following diagram depicts our sample application:

Prerequisites
Before getting started, make sure you have these prerequisites:
Install and authenticate the AWS CLI. You can authenticate with an AWS Identity and Access Management (IAM) user or an AWS Security Token Service (AWS STS) token.
Install Terraform.
Install pip.
Walkthrough
Follow these steps to monitor your AWS resources created with Terraform templates by using tfdevops:
- Install tfdevops following the instructions on GitHub
- Create a Terraform module with the resources supported by tfdevops
- Deploy the Terraform to your AWS account to create the resources in your account
Below is a sample Terraform module to create a sample AWS Lambda function, an Amazon DynamoDB table, an Amazon SNS topic and an Amazon SQS queue.
# IAM role for the lambda function
resource "aws_iam_role" "lambda_role" {
name   = "iam_role_lambda_function"
assume_role_policy = <<EOF
{
"Version": "2012-10-17",
"Statement": [
{
"Action": "sts:AssumeRole",
"Principal": {
"Service": "lambda.amazonaws.com"
},
"Effect": "Allow",
"Sid": ""
}
]
}
EOF
}
# IAM policy for logging from the lambda function
resource "aws_iam_policy" "lambda_logging" {
name         = "iam_policy_lambda_logging_function"
path         = "/"
description  = "IAM policy for logging from a lambda"
policy = <<EOF
{
"Version": "2012-10-17",
"Statement": [
{
"Action": [
"logs:CreateLogGroup",
"logs:CreateLogStream",
"logs:PutLogEvents"
],
"Resource": "arn:aws:logs:*:*:*",
"Effect": "Allow"
}
]
}
EOF
}
# Policy attachment for the role
resource "aws_iam_role_policy_attachment" "policy_attach" {
role        = aws_iam_role.lambda_role.name
policy_arn  = aws_iam_policy.lambda_logging.arn
}
# Generates an archive from the source
data "archive_file" "default" {
type        = "zip"
source_dir  = "${path.module}/src/"
output_path = "${path.module}/myzip/python.zip"
}
# Create a lambda function
resource "aws_lambda_function" "basic_lambda_function" {
filename                       = "${path.module}/myzip/python.zip"
function_name                  = "basic_lambda_function"
role                           = aws_iam_role.lambda_role.arn
handler                        = "index.lambda_handler"
runtime                        = "python3.8"
depends_on                     = [aws_iam_role_policy_attachment.policy_attach]
}
# Create a DynamoDB table
resource "aws_dynamodb_table" "sample_dynamodb_table" {
name           = "sample_dynamodb_table"
hash_key       = "sampleHashKey"
billing_mode   = "PAY_PER_REQUEST"
attribute {
name = "sampleHashKey"
type = "S"
}
}
# Create an SQS queue
resource "aws_sqs_queue" "sample_sqs_queue" {
name          = "sample_sqs_queue"
}
# Create an SNS topic
resource "aws_sns_topic" "sample_sns_topic" {
name = "sample_sns_topic"
}
- Run tfdevops to convert to CloudFormation template, deploy the stack and enable DevOps Guru
The following command generates a CloudFormation template locally from a Terraform state file:
tfdevops cfn -d ~/path/to/terraform/module --template mycfn.json --resources importable-ids.json
The following command deploys the CloudFormation template, creates a CloudFormation stack, imports resources, and activates DevOps Guru on the stack:
tfdevops deploy --template mycfn.json --resources importable-ids.json
- After tfdevopsfinishes the deployment, you can already see the stack in the CloudFormation dashboard.
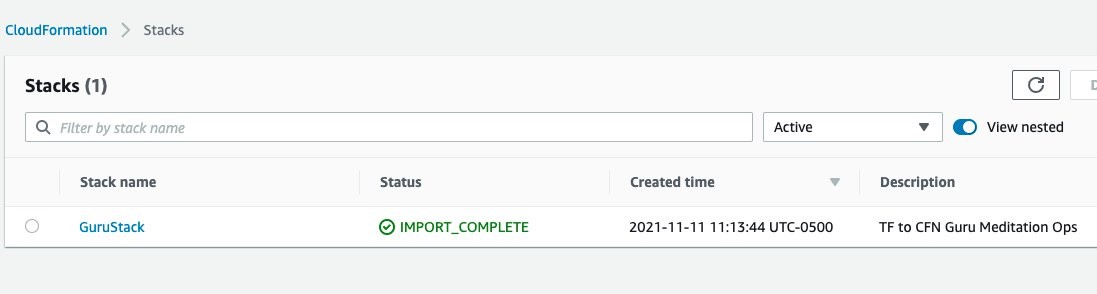
tfdevops imports the existing resources in the Terraform module into AWS CloudFormation. Note, that these are not new resources and would have no additional cost implications for the resources itself. See Bringing existing resources into CloudFormation management to learn more about importing resources into CloudFormation.

- Your stack also appears at the DevOps Guru dashboard, indicating that DevOps Guru is monitoring your resources, and will alarm in case it detects anomalous behavior. Insights are co-related sequence of events and trails, grouped together to provide you with prescriptive guidance and recommendations to root-cause and resolve issues more quickly. See Working with insights in DevOps Guru to learn more about DevOps Guru insights.

Note that when you use the tfdevops tool, it automatically enables DevOps Guru on the imported stack.

- Clean up – delete the stack

Conclusion
This blog post demonstrated how to enable DevOps Guru to monitor your AWS resources created by Terraform. Using the Stacklet’s tfdevops tool, you can create a CloudFormation stack from your Terraform state, and use that to define the coverage boundary for DevOps Guru. With that, if your resources have unexpected or unusual behavior, DevOps Guru will notify you and provide prescriptive recommendations to help you quickly fix the issue.
If you want to experiment DevOps Guru, AWS offers a free tier for the first three months that includes 7,200 AWS resource hours per month for free on each resource group A and B. Also, you can Estimate Amazon DevOps Guru resource analysis costs from the AWS Management Console. This feature scans selected resources to automatically generate a monthly cost estimate. Furthermore, refer to Gaining operational insights with AIOps using Amazon DevOps Guru to learn more about how DevOps Guru helps you increase your applications’ availability, and check out this workshop for a hands-on walkthrough of DevOps Guru’s main features and capabilities. To learn more about proactive insights, see Generating DevOps Guru Proactive Insights for Amazon ECS. To learn more about anomaly detection, see Anomaly Detection in AWS Lambda using Amazon DevOps Guru’s ML-powered insights.
Define application boundary using AWS resources tags in Amazon DevOps Guru
=======================
Amazon DevOps Guru is an ML powered service that makes it easy to improve an application’s operational performance and availability. By analyzing application metrics, logs, events and traces, DevOps Guru identifies behaviors that deviate from normal operating patterns and creates insights that you can use to improve your application.
At re:Invent 2021, we announced a new tagging feature in DevOps Guru. This feature allows you to organize resources into logical applications, using AWS resources tags so that you can have more control over how applications are defined. Well-defined applications enable DevOps Guru to group related anomalies together to better identify problems and to provide more meaningful recommendations. A tag is a label consisting of a user-defined key and a value. Previously, the coverage boundary consisted of an entire AWS account or specific resources defined by AWS CloudFormation stacks.
Getting Started
Define Resources to analyze using AWS resources tags
An AWS resource tag is a label that consists of a key and a value. A key-value pair can create useful grouping of resources into different applications. For DevOps Guru, you specify one tag key across all your applications. Resources with the same tag value are grouped together into a logical application. The tag key needs to be prefixed with the string “devops-guru-”. Note that the prefix string is not case sensitive. The tag value can be any value you define. The next section describes how you can use tag values to define coverage boundary for your applications.
You can add tags to your resources using the AWS service to which each resource belongs, or use the Tag Editor. To manage tags using your resource’s service, you can use the console, AWS CLI or SDK of the service.
Define Application boundary using AWS resources tag values
For DevOps Guru, we define an application as a group of instantiated AWS resources (Amazon EC2, AWS Lambda, Amazon RDS, etc.) that your workload is running on. You assign the same tag value to all resources that make up your application. DevOps Guru will analyze each resource separately, and will also look at metrics and events across all resources in your application to detect anomalies and generate insights. For example, see the diagram below.
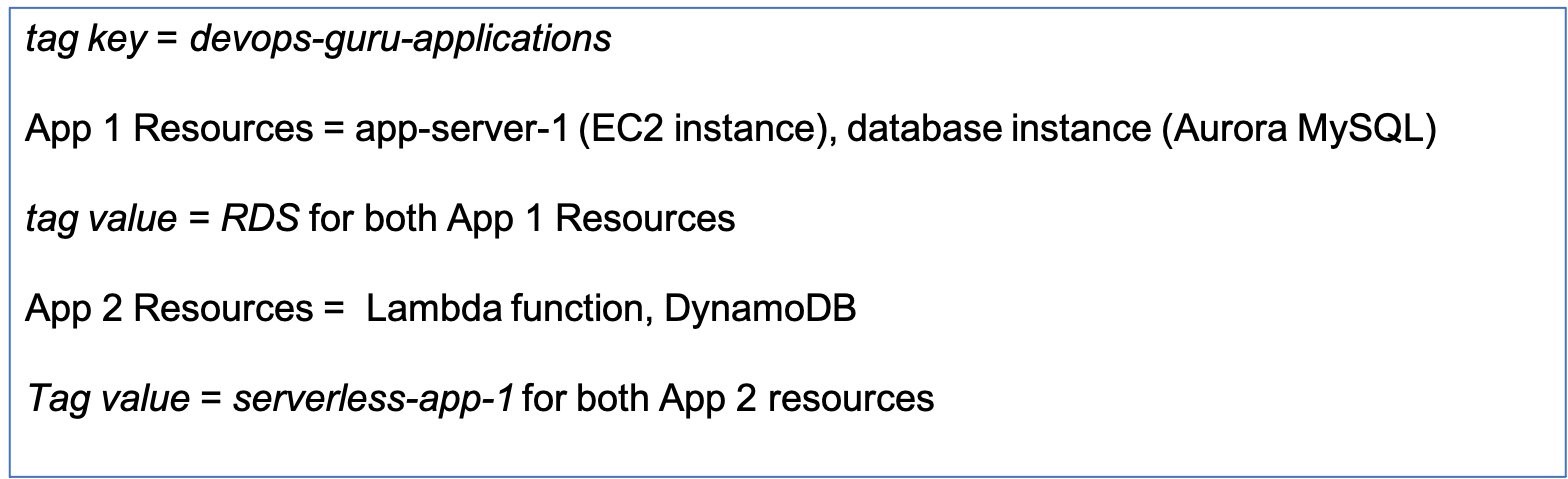
App 1 consists of 2 different resources for a database application – an EC2 instance and a database instance. Assigning the same tag value of RDS to both of the resources. I have another serverless application in App 2, which has a Lambda function and a DynamoDB instance. I assign a different tag value of serverless-app-1 to both of the App 2 resources.
Example Test Scenario
I am going to create a test scenario with an application server running in an EC2 instance. The application server is connected to an Aurora MySQL-Compatible database instance. I will instrument my application to introduce a misbehaving SQL query to create a performance anomaly.
In my example below, I tagged my EC2 instance and database instance with the tag value of RDS. I am interested in detecting performance issues in my Database instance and I want DevOps Guru to provide recommendations to fix those issues.
Manage DevOpsGuru Analysis Coverage
Next, I define the coverage boundary in DevOps Guru Console. In the Settings options in navigation pane, I select Analyzed resources and choose Edit.
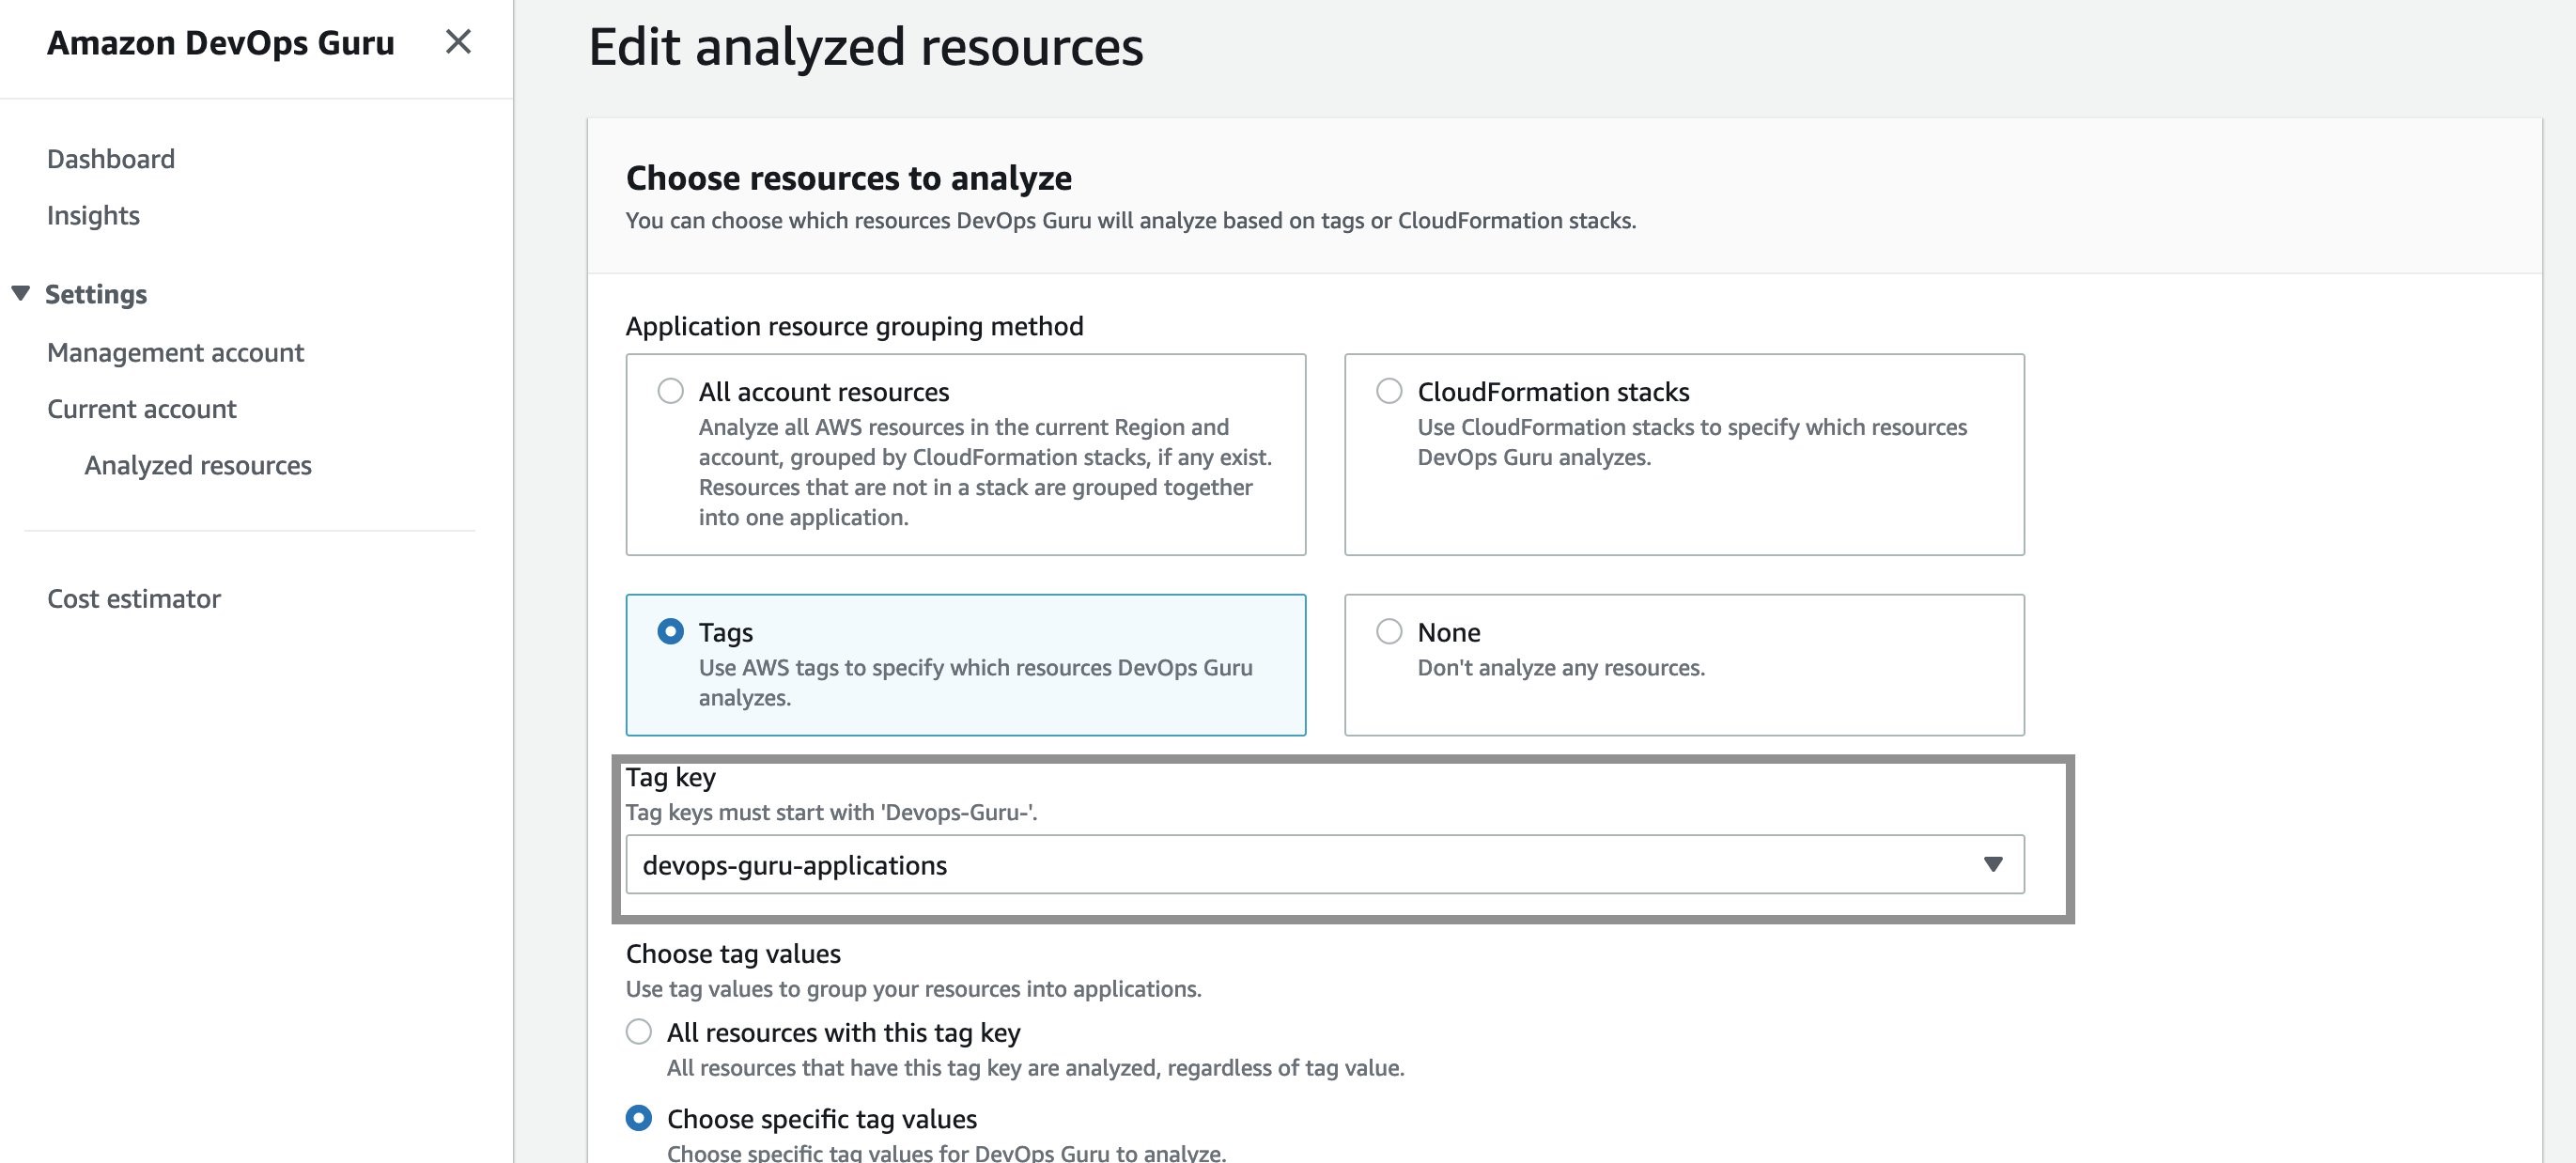
Next, I select the “devops-guru-applications” as tag key from the dropdown menu. I am going to select RDS as the tag value, since I am interested in looking at performance issues in my Amazon Aurora database instance.

Filter insights by tags
Next, I created my test scenario. Once DevOps Guru generated an insight, I am able to filter the insights by tag key or tag values. To display insights for my database instance, I select “Affected applications” from the search menu bar on insights page as shown below:
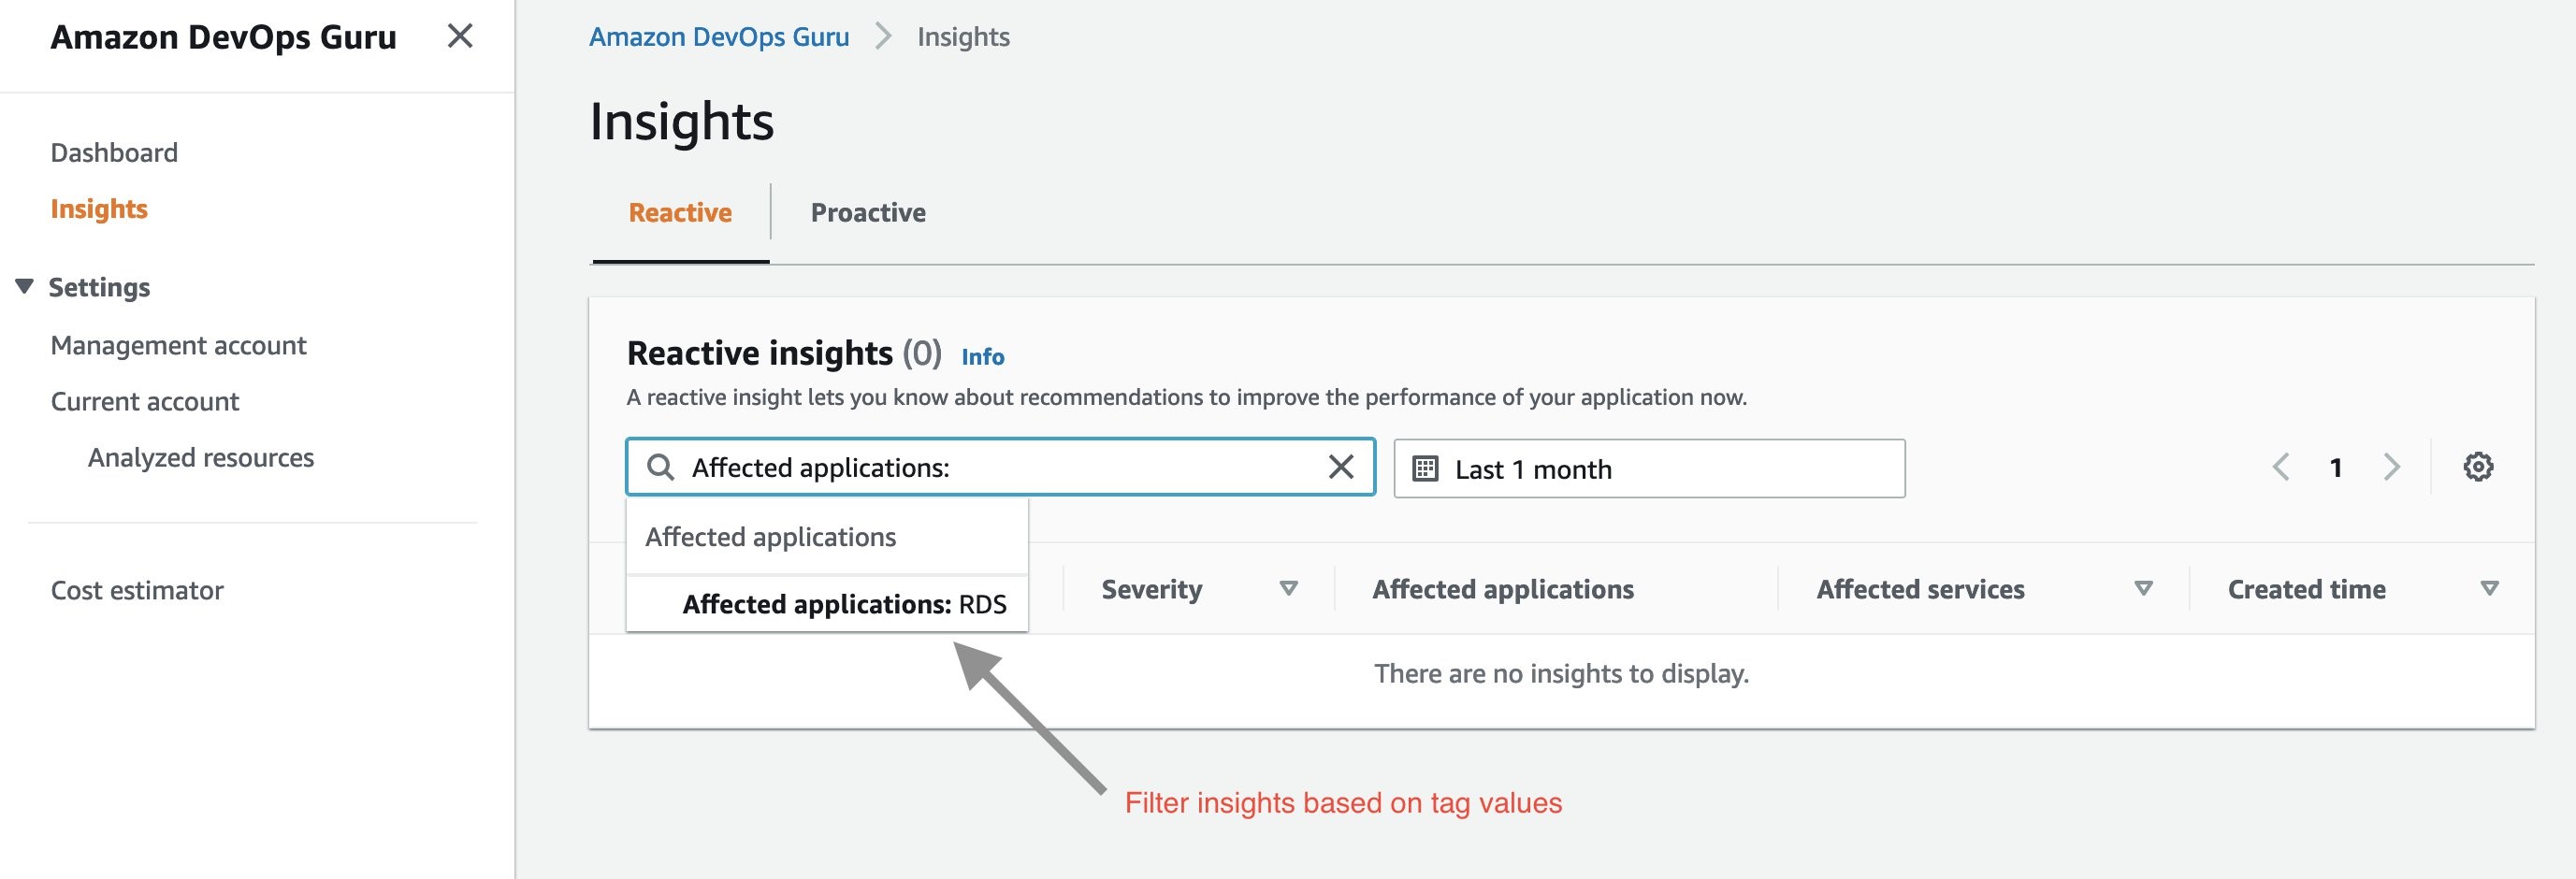
Next, I select “Affected applications” as RDS in the above dropdown menu. Below is the Insight overview screen that gets displayed.

The insights generated by DevOps Guru for my Amazon Aurora instances are enabled by Amazon DevOps Guru for RDS, a new feature we announced at re:Invent 2021. It allows developers to easily detect, diagnose, and resolve performance and operational issues in Amazon Aurora. For more information on Amazon DevOps Guru for RDS, see a related news blog written by my colleague, Marcia Villalba.
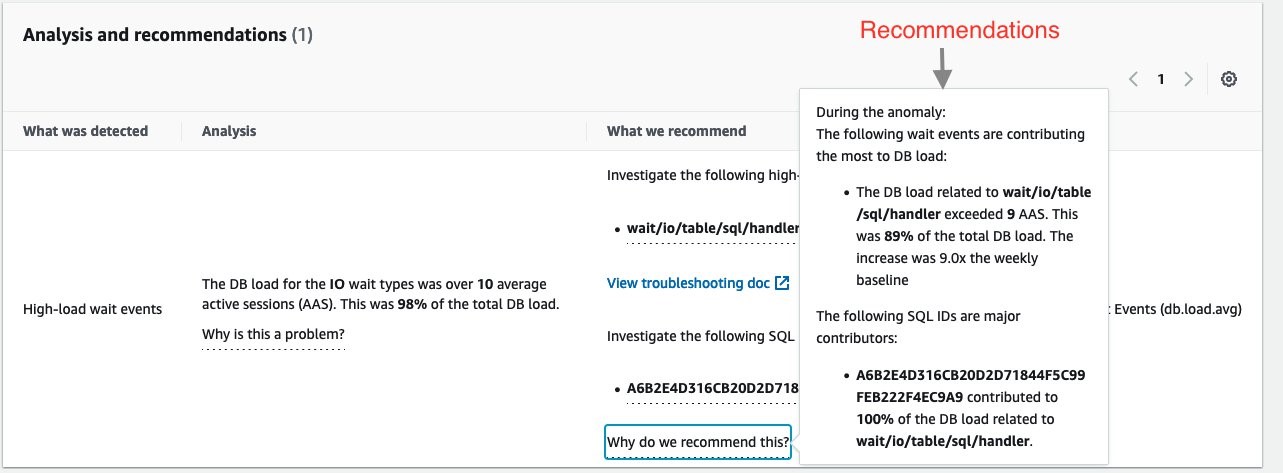
The insight summary indicates that there is high DB load, ten times above baseline. DevOps Guru for RDS uses anomaly detection on the database load (DB load) performance metric to detect issues. DB load is measured in units of Average Active Sessions (AAS). DB load measures the level of activity in your database, making it a great metric to understand the health of your database.
If you continue scrolling on the DevOps Guru for RDS analysis page, you can discover the cause for the problem and some recommendations to fix it. DevOps Guru for RDS detected there was a high load of wait events, and one SQL query was found to require further investigation. You can even see the exact SQL query if you click on the SQL digest IDs. The insight’s analysis and recommendation section is full of information on how to investigate further and fix the issue.
The easy-to-understand recommendations made by DevOps Guru for RDS means that as a DevOps engineer, you do not need to rely on a database administrator (DBA) or use any third party tools.
Conclusion
AWS resources tags give you one more way to specify the resource analysis coverage boundary, in addition to existing methods of an entire AWS account or specific AWS CloudFormation stacks. AWS tags allows you to better isolate the applications you want DevOps Guru to analyze. In this post, we used AWS tags to define the coverage boundary for a database application. We reduced unrelated and unnecessary resource coverage from our analysis, thereby controlling our resource analysis costs. Visit the DevOps Guru documentation to learn more about how to use tags to identify resources in your DevOps Guru applications.
Automate Container Anomaly Monitoring of Amazon Elastic Kubernetes Service Clusters with Amazon DevOps Guru
=======================
Observability in a container-centric environment presents new challenges for operators due to the increasing number of abstractions and supporting infrastructure. In many cases, organizations can have hundreds of clusters and thousands of services/tasks/pods running concurrently. This post will demonstrate new features in Amazon DevOps Guru to help simplify and expand the capabilities of the operator. The features include grouping anomalies by metric and container cluster to improve context and simplify access and support for additional Amazon CloudWatch Container Insight metrics. An example of these capabilities in action would be that Amazon DevOps Guru can now identify anomalies in CPU, memory, or networking within Amazon Elastic Kubernetes Service (EKS), notifying the operators and letting them more easily navigate to the affected cluster to examine the collected data.
Amazon DevOps Guru offers a fully managed AIOps platform service that lets developers and operators improve application availability and resolve operational issues faster. It minimizes manual effort by leveraging machine learning (ML) powered recommendations. Its ML models take advantage of the expertise of AWS in operating highly available applications for the world’s largest ecommerce business for over 20 years. DevOps Guru automatically detects operational issues, predicts impending resource exhaustion, details likely causes, and recommends remediation actions.
Solution Overview
In this post, we will demonstrate the new Amazon DevOps Guru features around cluster grouping and additionally supported Amazon EKS metrics. To demonstrate these features, we will show you how to create a Kubernetes cluster, instrument the cluster using AWS Distro for OpenTelemetry, and then configure Amazon DevOps Guru to automate anomaly detection of EKS metrics. A previous blog provides detail on the AWS Distro for OpenTelemetry collector that is employed here.
Prerequisites
Install eksctl for creating Amazon Elastic Kubernetes Service Cluster
Install kubectl for managing Amazon Elastic Kubernetes Cluster
Amazon Elastic Kubernetes Service(EKS)
AWS Distro for OpenTelemetry
Amazon DevOps Guru
Amazon Simple Notification Service(SNS)
EKS Cluster Creation
We employ the eksctl CLI tool to create an Amazon EKS. Using eksctl, you can provide details on the command line or specify a manifest file. The following manifest is used to create a single managed node using Amazon Elastic Compute Cloud (EC2), and this will be created and constrained to the specified Region via entry metadata/region and Availability Zones via the managedNodeGroups/availabilityZones entry. By default, this will create a new VPC with eight subnets.
# An example of ClusterConfig object using Managed Nodes
---
apiVersion: eksctl.io/v1alpha5
kind: ClusterConfig
metadata:
name: devopsguru-eks-cluster
region: <SPECIFY_REGION_HERE>
version: "1.21"
availabilityZones: ["<FIRST_AZ>","<SECOND_AZ>"]
managedNodeGroups:
- name: managed-ng-private
privateNetworking: true
instanceType: t3.medium
minSize: 1
desiredCapacity: 1
maxSize: 6
availabilityZones: ["<SPECIFY_AVAILABILITY_ZONE(S)_HERE"]
volumeSize: 20
labels: {role: worker}
tags:
nodegroup-role: worker
cloudWatch:
clusterLogging:
enableTypes:
- "api"
To create an Amazon EKS cluster using eksctl and a manifest file, we use eksctl create as shown below. Note that this step will take 10 – 15 minutes to establish the cluster.
$ eksctl create cluster -f devopsguru-managed-node.yaml
2021-10-13 10:44:53 [i] eksctl version 0.69.0
…
2021-10-13 11:04:42 [✔] all EKS cluster resources for "devopsguru-eks-cluster" have been created
2021-10-13 11:04:44 [i] nodegroup "managed-ng-private" has 1 node(s)
2021-10-13 11:04:44 [i] node "<ip>.<region>.compute.internal" is ready
2021-10-13 11:04:44 [i] waiting for at least 1 node(s) to become ready in "managed-ng-private"
2021-10-13 11:04:44 [i] nodegroup "managed-ng-private" has 1 node(s)
2021-10-13 11:04:44 [i] node "<ip>.<region>.compute.internal" is ready
2021-10-13 11:04:47 [i] kubectl command should work with "/Users/<user>/.kube/config"
Once this is complete, you can use kubectl, the Kubernetes CLI, to access the managed nodes that are running.
$ kubectl get nodes
NAME STATUS ROLES AGE VERSION
<ip>.<region>.compute.internal Ready <none> 76m v1.21.4-eks-033ce7e
AWS Distro for OpenTelemetry Collector Installation
We will use AWS Distro for OpenTelemetry Collector to extract metrics from a pod running in Amazon EKS. This will collect metrics within the Kubernetes cluster and surface them to Amazon CloudWatch. We start by defining a policy to allow access. The following information comes from the post here.
Attach the CloudWatchAgentServerPolicy IAM Policy to worker node
Open the Amazon EC2 console.
Select one of the worker node instances, and choose the IAM role in the description.
On the IAM role page, choose Attach policies.
In the list of policies, select the check box next to CloudWatchAgentServerPolicy. You can use the search box to find this policy.
Choose Attach policies.
Deploy AWS OpenTelemetry Collector on Amazon EKS
Next, you will deploy the AWS Distro for OpenTelemetry using a GitHub hosted manifest.
Deploy the artifact to the Amazon EKS cluster using the following command:
$ curl https://raw.githubusercontent.com/aws-observability/aws-otel-collector/main/deployment-template/eks/otel-container-insights-infra.yaml | kubectl apply -f -
View the resources in the aws-otel-eks namespace.
$ kubectl get pods -l name=aws-otel-eks-ci -n aws-otel-eks
NAME READY STATUS RESTARTS AGE
aws-otel-eks-ci-jdf2w 1/1 Running 0 107m
View Container Insight Metrics in Amazon CloudWatch
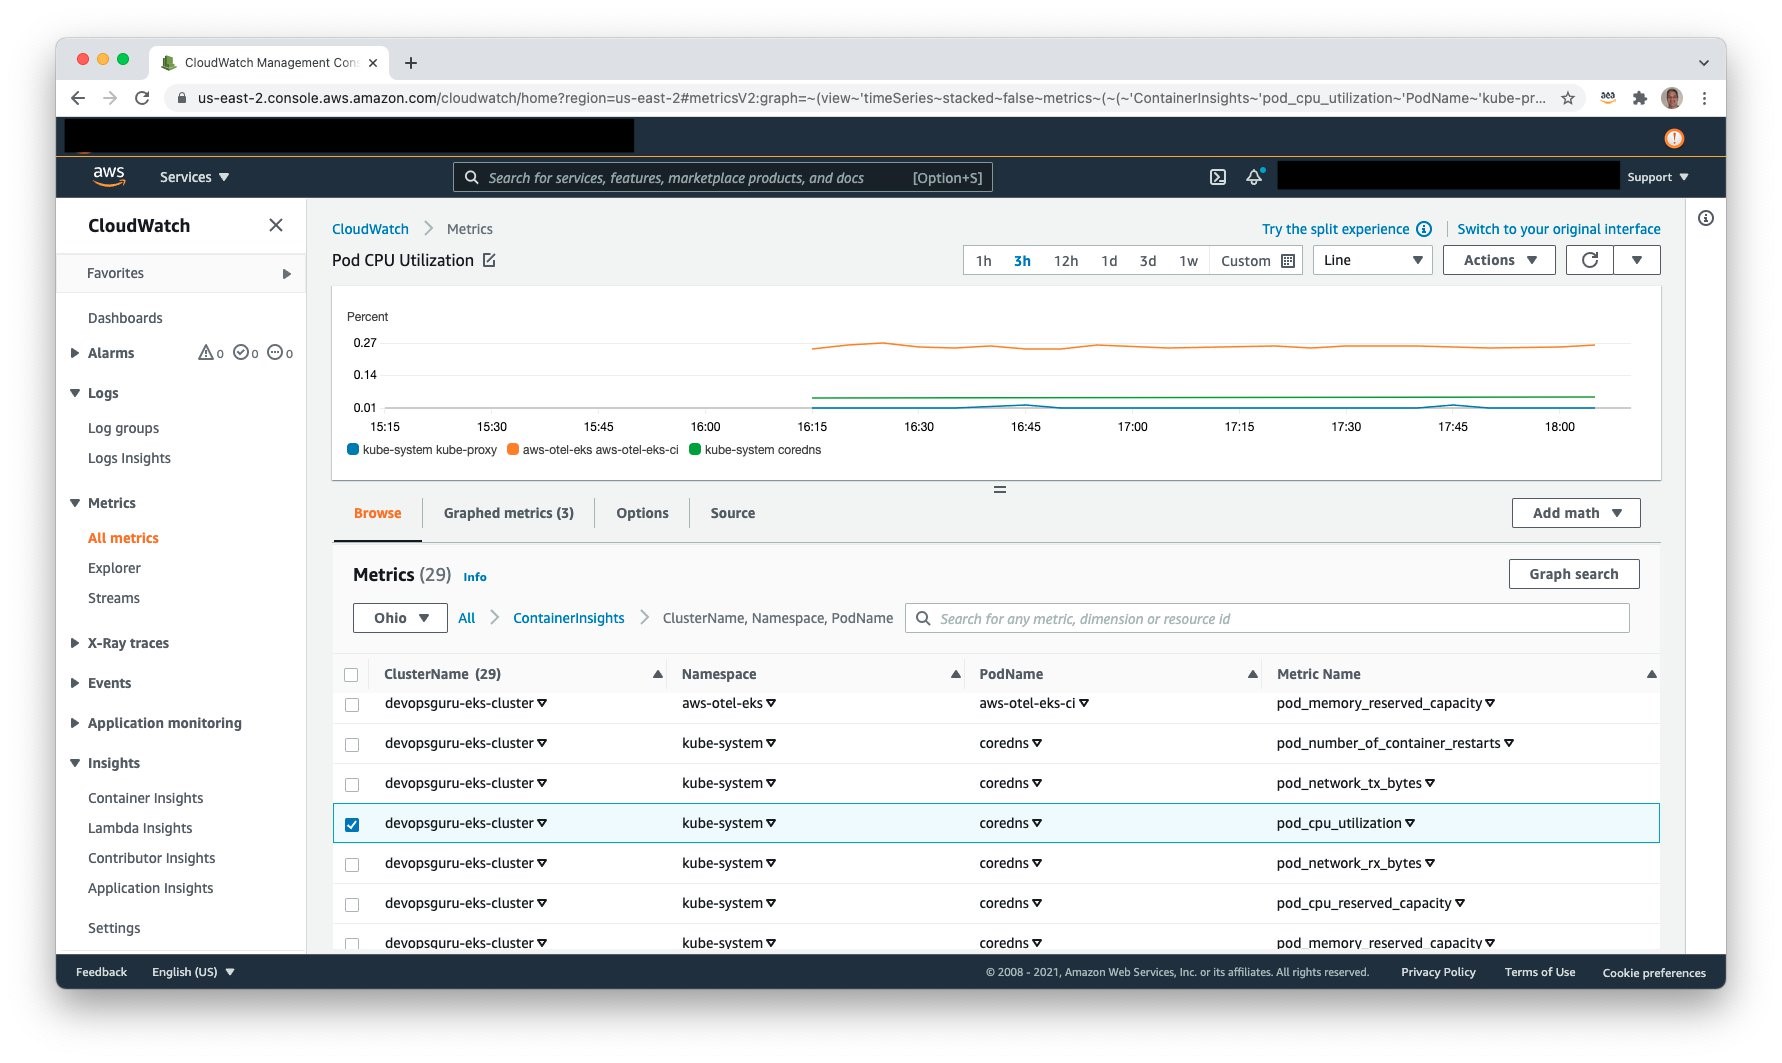
Access Amazon CloudWatch and select Metrics, All metrics to view the published metrics. Under Custom Namespaces, ContainerInsights is selectable. Under this, one can view metrics at the cluster, node, pod, namespace, and service granularity. The following example shows pod level metrics of CPU:
Amazon Simple Notification Service
It is necessary to allow Amazon DevOps Guru access to Amazon SNS in order for Amazon SNS to publish events. During the setup process, an Amazon SNS Topic is created, and the following resource policy is applied:
{
"Sid": "DevOpsGuru-added-SNS-topic-permissions",
"Effect": "Allow",
"Principal": {
"Service": "region-id.devops-guru.amazonaws.com"
},
"Action": "sns:Publish",
"Resource": "arn:aws:sns:region-id:topic-owner-account-id:my-topic-name",
"Condition" : {
"StringEquals" : {
"AWS:SourceArn": "arn:aws:devops-guru:region-id:topic-owner-account-id:channel/devops-guru-channel-id",
"AWS:SourceAccount": "topic-owner-account-id"
}
}
}
Amazon DevOps Guru
Amazon DevOps Guru can now be leveraged to monitor the Amazon EKS cluster and Managed Node Group. Select Amazon DevOps Guru, and select Get started as shown in the following figure to do this.
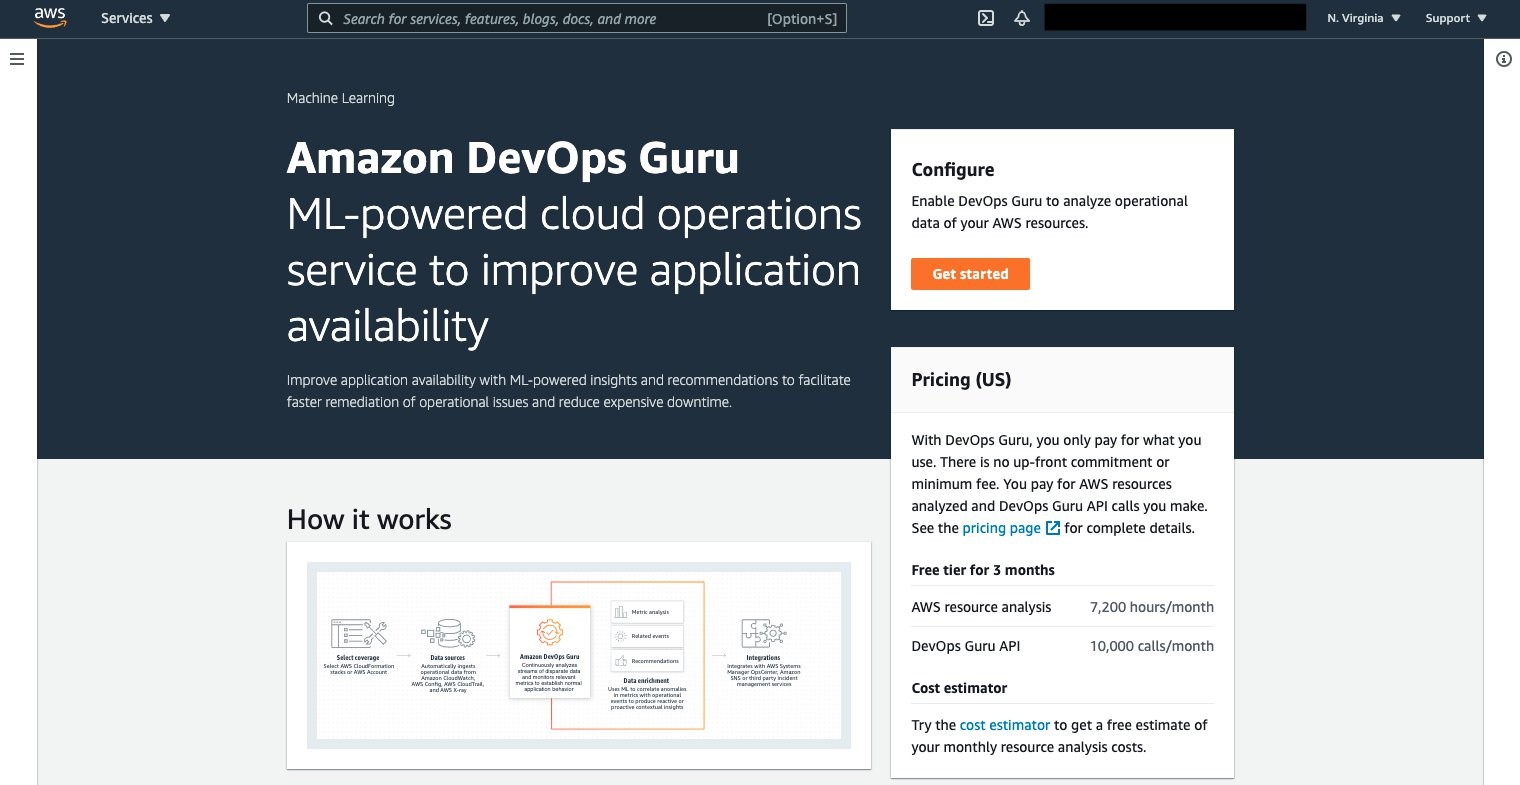
Once selected, the Get started console displays, letting you specify the IAM role for DevOps guru to access the appropriate resources.

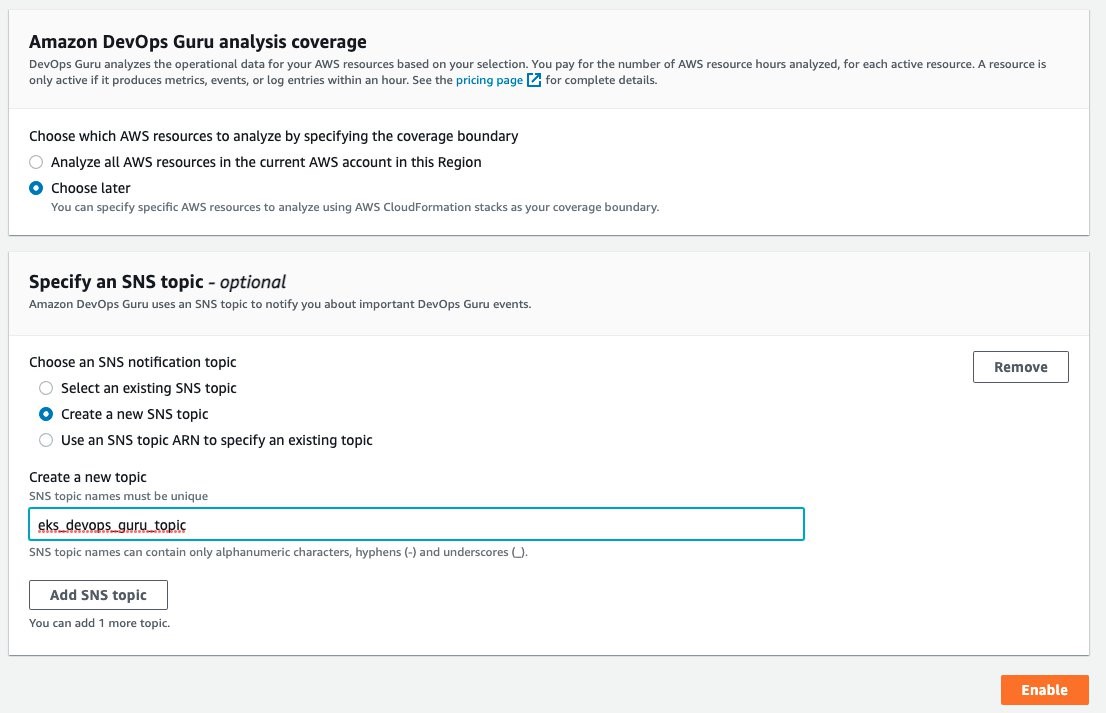
Under the Amazon DevOps Guru analysis coverage, Choose later is selected. This will let us specify the CloudFormation stacks to monitor. Select Create a new SNS topic, and provide a name. This will be used to collect notifications and allow for subscribers to then be notified. Select Enable when complete.
On the Manage DevOps Guru analysis coverage, select Analyze all AWS resources in the specified CloudFormation stacks in this Region. Then, select the cluster and managed node group AWS CloudFormation stacks so that DevOps Guru can monitor Amazon EKS.
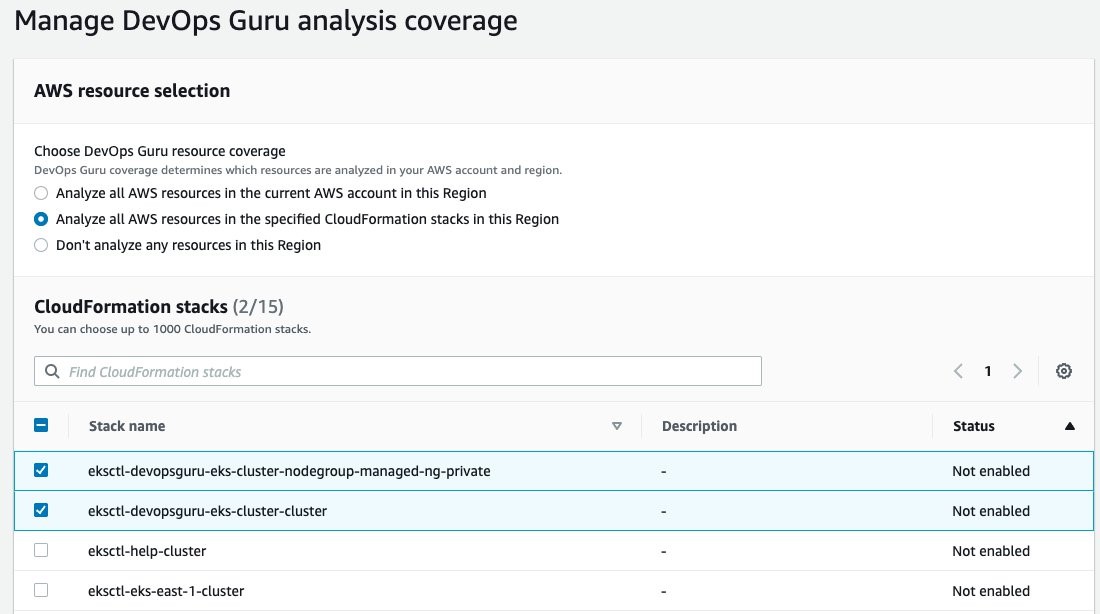
Once this is selected, the display will update indicating that two CloudFormation stacks were added.

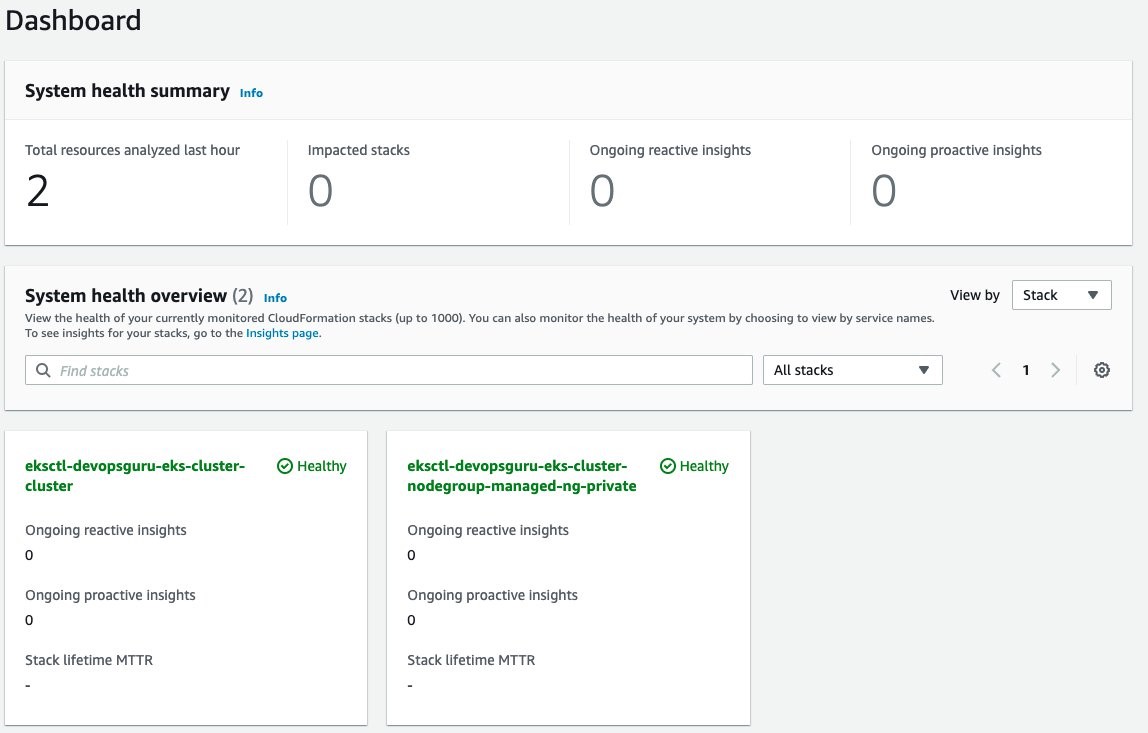
Amazon DevOps Guru will finally start analysis for those two stacks. This will take several hours to collect data and to identify normal operating conditions. Once this process is complete, the Dashboard will display that those resources have been analyzed, as shown in the following figure.
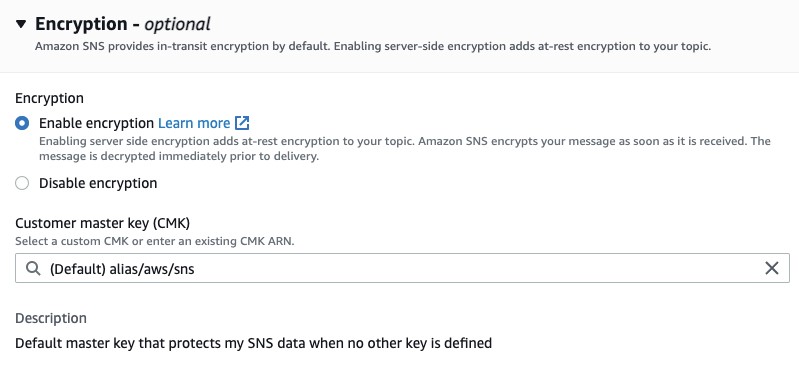
Enable Encryption on Amazon SNS Topic
The Amazon SNS Topic created by Amazon DevOps Guru will not enable encryption by default. It is important to enable this feature to encrypt notifications at rest. Go to Amazon SNS, select the topic that is created and then Edit topic. Open the Encryption dialog box and enable encryption as shown in the following figure, specifying an alias, or accepting the default.
Deploy Sample Application on Amazon EKS To Trigger Insights
You will employ a sample application that is part of the AWS Distro for OpenTelemetry Collector to simulate failure. Using the following manifest, you will deploy a sample application that has pod resource limits for memory and CPU shares. These limits are artificially low and insufficient for the pod to run. The pod will exceed memory and will be identified for eviction by Amazon EKS. When it is evicted, it will attempt to be redeployed per the manifest requirement for a replica of one. In turn, this will repeat the process and generate memory and pod restart errors in Amazon CloudWatch. For this example, the deployment was left for over an hour, thereby causing the pod failure to repeat numerous times. The following is the manifest that you will create on the filesystem.
kind: Deployment
apiVersion: apps/v1
metadata:
name: java-sample-app
namespace: aws-otel-eks
labels:
name: java-sample-app
spec:
replicas: 1
selector:
matchLabels:
name: java-sample-app
template:
metadata:
labels:
name: java-sample-app
spec:
containers:
- name: aws-otel-emitter
image: aottestbed/aws-otel-collector-java-sample-app:0.9.0
resources:
limits:
memory: "128Mi"
cpu: "200m"
ports:
- containerPort: 4567
env:
- name: OTEL_OTLP_ENDPOINT
value: "localhost:4317"
- name: OTEL_RESOURCE_ATTRIBUTES
value: "service.namespace=AWSObservability,service.name=CloudWatchEKSService"
- name: S3_REGION
value: "us-east-1"
imagePullPolicy: Always
To deploy the application, use the following command:
$ kubectl apply -f <manifest file name>
deployment.apps/java-sample-app created
Scenario: Improved context from DevOps Guru Container Cluster Grouping and Increased Metrics
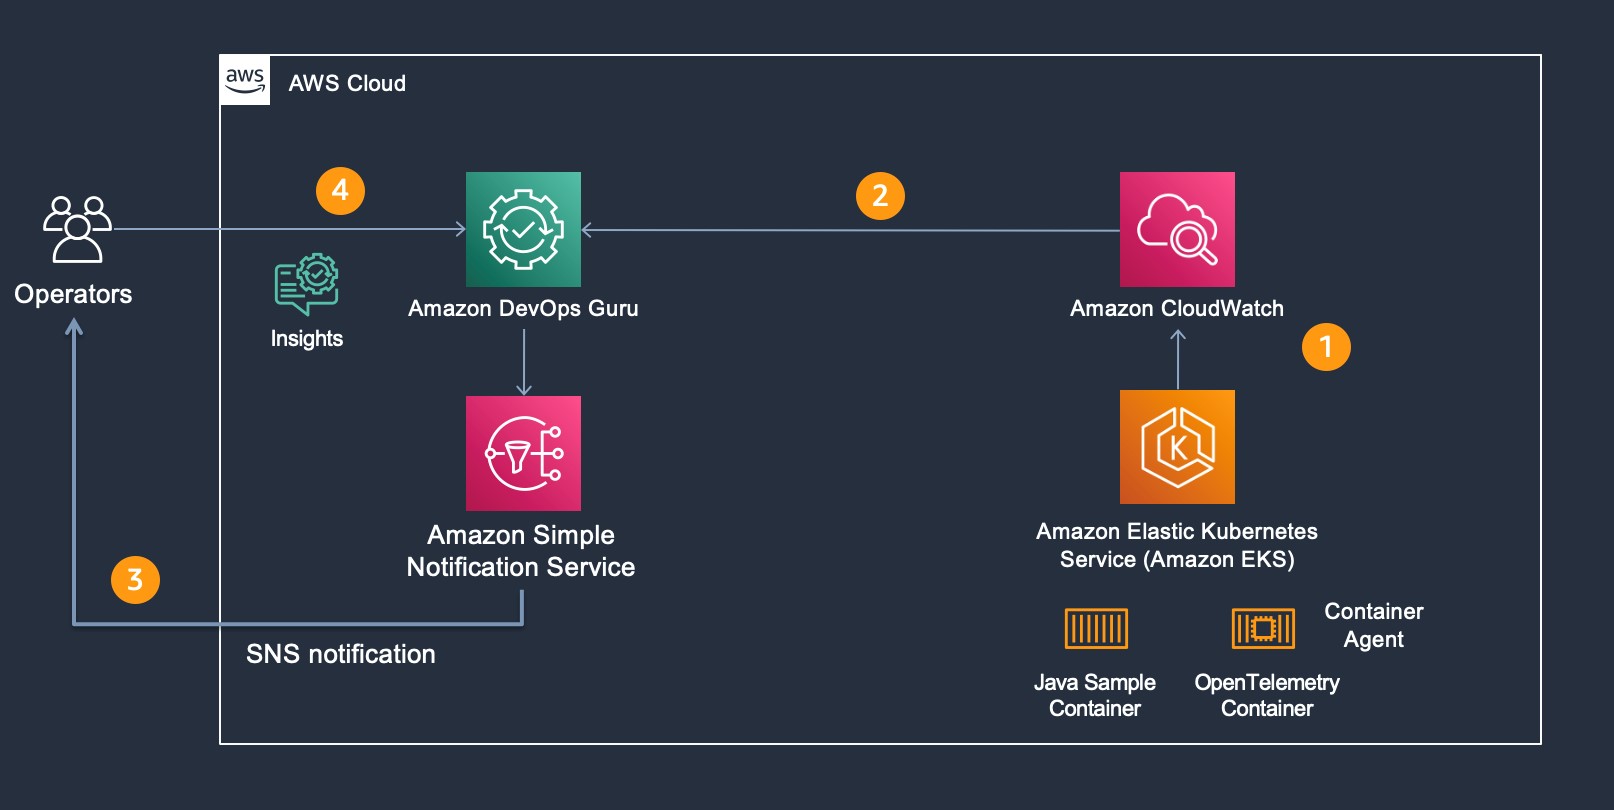
For our scenario, Amazon DevOps Guru is monitoring additional Amazon CloudWatch Container Insight Metrics for EKS. The following figure shows the flow of information and eventual notification of the operator, so that they can examine the Amazon DevOps Guru Insight. Starting at step 1, the container agent (AWS Distro for OpenTelemetry) forwards container metrics to Amazon CloudWatch. In step 2, Amazon DevOps Guru is continually consuming those metrics and performing anomaly detection. If an anomaly is detected, then this generates an Insight, thereby triggering Amazon SNS notification as shown in step 3. In step 4, the operators access Amazon DevOps Guru console to examine the insight. Then, the operators can leverage the new user interface capability displaying which cluster, namespace, and pod/service is impacted along with correlated Amazon EKS metric(s).
As part of the release, the following pod and node metrics are now tracked by DevOps Guru:
pod_number_of_container_restarts – number of times that a pod is restarted (e.g., image pull issues, container failure).
pod_memory_utilization_over_pod_limit – memory that exceeds the pod limit called out in resource memory limits.
pod_cpu_utilization_over_pod_limit – CPU shares that exceed the pod limit called out in resource CPU limits.
pod_cpu_utilization – percent CPU Utilization within an active pod.
pod_memory_utilization – percent memory utilization within an active pod.
node_network_total_bytes – total bytes over the network interface for the managed node (e.g., EC2 instance)
node_filesystem_utilization – percent file system utilization for the managed node (e.g., EC2 instance).
node_cpu_utilization – percent CPU Utilization within a managed node (e.g., EC2 instance).
node_memory_utilization – percent memory utilization within a managed node (e.g., EC2 instance).
Operator Scenario
The Kubernetes Operator is informed of an insight via Amazon SNS. The Amazon SNS message content appears in the following code, showing the originator and information identifying the InsightDescription, InsightSeverity, name of the container metric, and the Pod / EKS Cluster:
{
"AccountId": "XXXXXXX",
"Region": "<REGION>",
"MessageType": "NEW_INSIGHT",
"InsightId": "ADFl69Pwq1Aa6M373DhU0zkAAAAAAAAABuZzSBHxeiNexxnLYD7Lhb0vuwY9hLtz",
"InsightUrl": "https://<REGION>.console.aws.amazon.com/devops-guru/#/insight/reactive/ADFl69Pwq1Aa6M373DhU0zkAAAAAAAAABuZzSBHxeiNexxnLYD7Lhb0vuwY9hLtz",
"InsightType": "REACTIVE",
"InsightDescription": "ContainerInsights pod_number_of_container_restarts Anomalous In Stack eksctl-devopsguru-eks-cluster-cluster",
"InsightSeverity": "high",
"StartTime": 1636147920000,
"Anomalies": [
{
"Id": "ALAGy5sIITl9e6i66eo6rKQAAAF88gInwEVT2WRSTV5wSTP8KWDzeCYALulFupOQ",
"StartTime": 1636147800000,
"SourceDetails": [
{
"DataSource": "CW_METRICS",
"DataIdentifiers": {
"name": "pod_number_of_container_restarts",
"namespace": "ContainerInsights",
"period": "60",
"stat": "Average",
"unit": "None",
"dimensions": "{\"PodName\":\"java-sample-app\",\"ClusterName\":\"devopsguru-eks-cluster\",\"Namespace\":\"aws-otel-eks\"}"
}
....
"awsInsightSource": "aws.devopsguru"
}
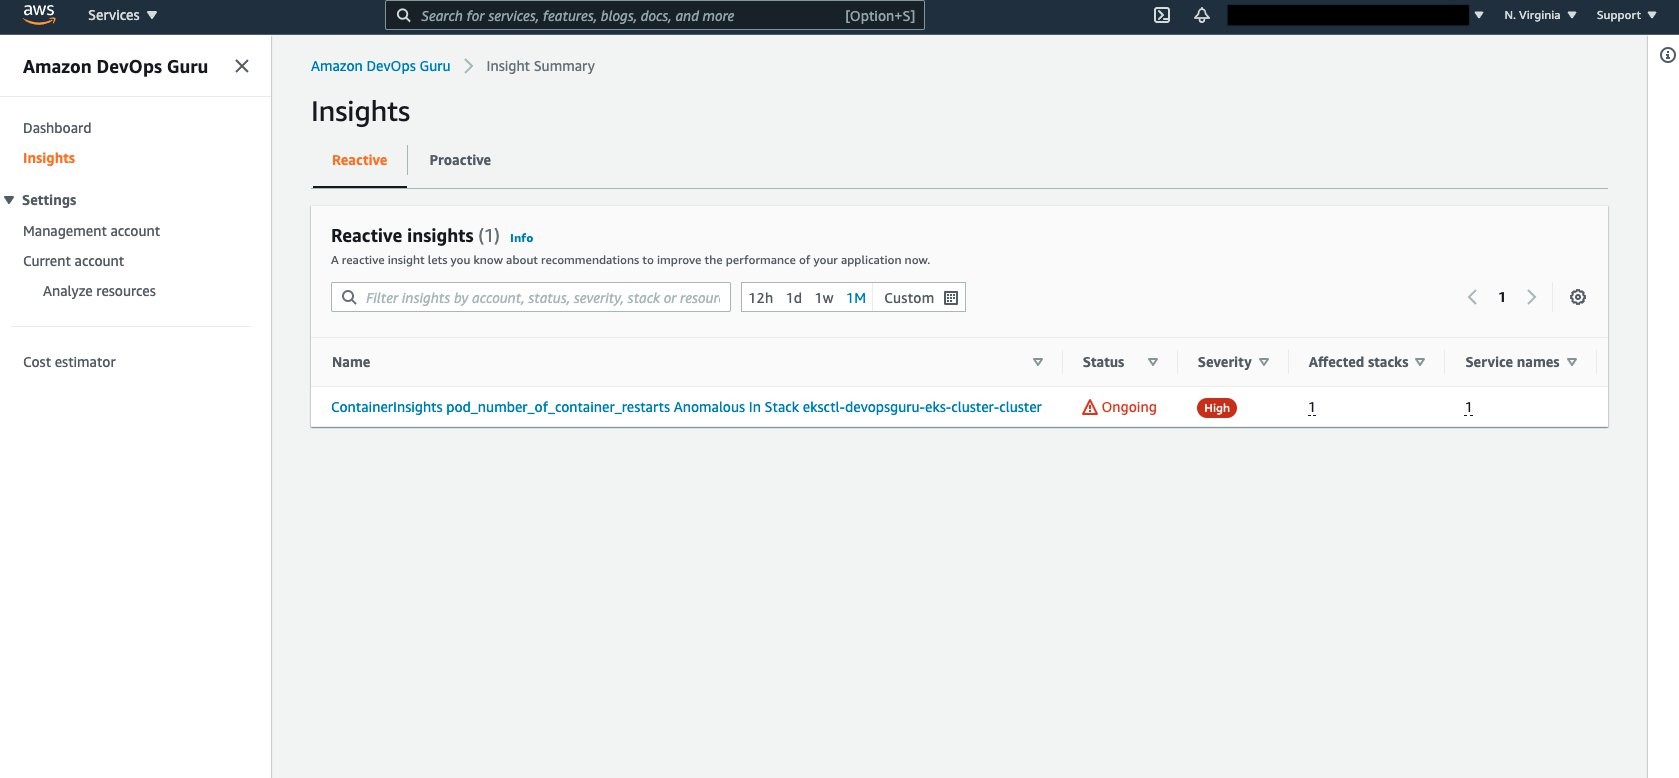
Amazon DevOps Guru Console collects the insights under the Insights selection as shown in the following figure. Select Insights to view the details.
Aggregated Metrics provides the identification of the EKS Container Metrics that have errored. In this case, pod_memory_utilization_over_pod_limit and pod_number_of_container_restarts.
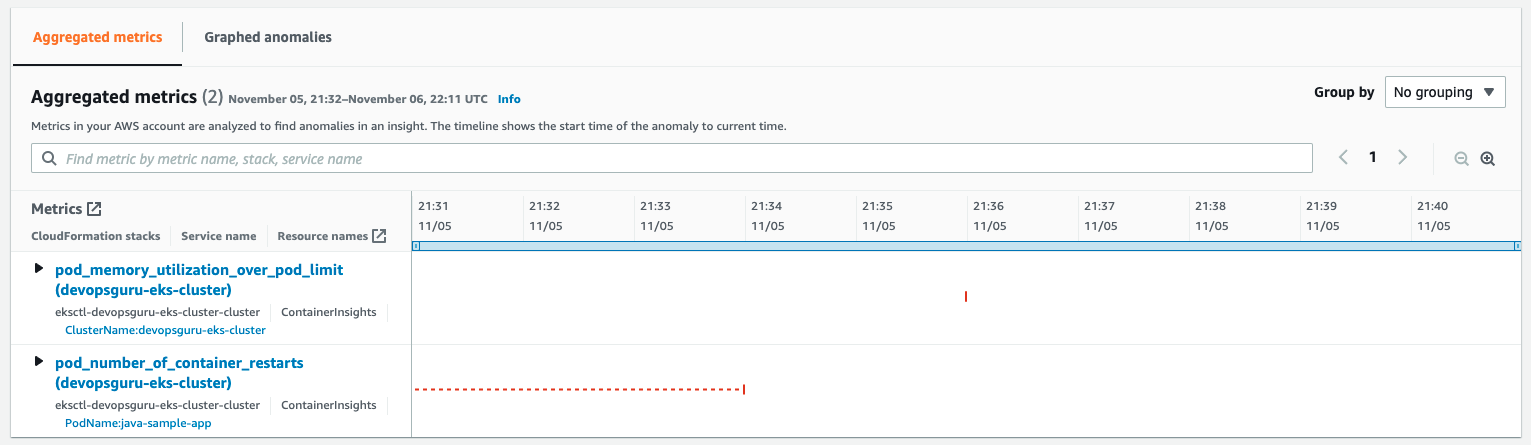
Further details can be identified by selecting and expanding each insight as shown in the following figure.

Note that the display provides information around the Cluster, PodName, and Namespace. This helps operators maintaining large numbers of EKS Clusters to quickly isolate the offending Pod, its operating Namespace, and EKS Cluster to which it belongs. A search bar provides further filtering to isolate the name, stack, or service name displayed.
Cleaning Up
Follow the steps to delete the resources to prevent additional charges being posted to your account.
Amazon EKS Cluster Cleanup
Follow these steps to detach the customer managed policy and delete the cluster.
Detach customer managed policy, AWSDistroOpenTelemetryPolicy, via IAM Console.
Delete cluster using eksctl.
$ eksctl delete cluster devopsguru-eks-cluster --region <region>
2021-10-13 14:08:28 [i] eksctl version 0.69.0
2021-10-13 14:08:28 [i] using region <region>
2021-10-13 14:08:28 [i] deleting EKS cluster "devopsguru-eks-cluster"
2021-10-13 14:08:30 [i] will drain 0 unmanaged nodegroup(s) in cluster "devopsguru-eks-cluster"
2021-10-13 14:08:32 [i] deleted 0 Fargate profile(s)
2021-10-13 14:08:33 [✔] kubeconfig has been updated
2021-10-13 14:08:33 [i] cleaning up AWS load balancers created by Kubernetes objects of Kind Service or Ingress
2021-10-13 14:09:02 [i] 2 sequential tasks: { delete nodegroup "managed-ng-private", delete cluster control plane "devopsguru-eks-cluster" [async] }
2021-10-13 14:09:02 [i] will delete stack "eksctl-devopsguru-eks-cluster-nodegroup-managed-ng-private"
2021-10-13 14:09:02 [i] waiting for stack "eksctl-devopsguru-eks-cluster-nodegroup-managed-ng-private" to get deleted
2021-10-13 14:12:30 [i] will delete stack "eksctl-devopsguru-eks-cluster-cluster"
2021-10-13 14:12:30 [✔] all cluster resources were deleted
Conclusion
In the previous scenarios, demonstration of the new cluster organization and additional container metrics was performed. Both of these features further simplify and expand the ability for an operator to more easily identify issues within a container cluster when Amazon DevOps Guru detects anomalies. You can start building your own solutions that employ Amazon CloudWatch Agent / AWS Distro for OpenTelemetry Agent and Amazon DevOps Guru by reading the documentation. This provides a conceptual overview and practical examples to help you understand the features provided by Amazon DevOps Guru and how to use them.
AWS attendee guide for DevOps and Developer Productivity track at re:Invent2021
=======================
AWS re:Invent is a learning conference hosted by Amazon Web Services for the global cloud computing community. We are super excited to join you at the 10th annual re:Invent to share the latest from AWS leaders and discover more ways to learn and build. Let’s celebrate this milestone, which will be offered in person in Las Vegas (November 29-December 3) and in virtual (November 29–December 10) formats. The health and safety of our customers, and partners remains our top priority and you can learn more about it in health measures page. For details about the virtual format, check out the virtual section. If you haven’t already registered, don’t forget to register and save your spot at your favorite sessions.
The AWS DevOps and Developer Productivity track at re:Invent offers you with sessions that are combination of cultural philosophies, practices, and tools that increase an organization’s ability to deliver applications and services at high velocity. The sessions vary from intermediate (200) through expert (400) levels, and help you accelerate the pace of innovation in your business. This blog post highlights the sessions from the Cloud Operations track that you shouldn’t miss.
Breakout Sessions
AWS re:Invent breakout sessions are lecture-style and one hour long. These sessions are delivered by AWS experts, customers, and partners, and they typically include 10–15 minutes of Q&A at the end. For our virtual attendees, breakout sessions will be made available on demand in the week after re:Invent.
Level 200 – Intermediate
DOP208-R1 and DOP208-R2 DevOps revolution
While DevOps has not changed much, the industry has fundamentally transformed over the last decade. Monolithic architectures have evolved into microservices. Containers and serverless have become the default. Applications are distributed on cloud infrastructure across the globe. The technical environment and tooling ecosystem has changed radically from the original conditions in which DevOps was created. So, what’s next? In this session, learn about the next phase of DevOps: a distributed model that emphasizes swift development, observable systems, accountable engineers, and resilient applications.
Level 300 – Advanced
DOP301 How to reuse patterns when developing infrastructure as code
This session explores the AWS Cloud Development Kit (AWS CDK) constructs and AWS CloudFormation modules and how they can be used to make building applications easier on AWS. Learn how you can extend CloudFormation to include support for third-party resources and how those resource types can be used by AWS Config.
DOP309 Amazon builders’ library: Operational excellence at Amazon
Operational excellence at Amazon is achieved through a DevOps model, where software development teams operate the systems they build. In this session, Senior Principal Engineer David Yanacek describes Amazon’s operational practices that he has observed during his 15 years of building and operating services at Amazon. Hear David describe the habits that teams have adopted, such as how teams handle retrospectives, share knowledge, and regularly review operational metrics as a team. David discusses how these behaviors have led teams to innovate to build better tools and make architectural shifts.
DOP310 Enabling decentralized development teams with a shared services platform
Speed in software development requires being able to equip development teams with tools and guardrails for DevOps, security, and infrastructure configuration. Too often, central teams find they need to piece together their own custom solutions or compromise the speed of their development organization in order to maintain standards. In this session, dive deep into the crawl, walk, and run options and best practices for building a shared services platform on AWS using tools and services such as AWS Copilot, AWS Proton, and pre-built solutions using AWS CloudFormation.
DOP311 Incorporating continuous resilience in your development ecosystem
Today, resilience encompasses a broad range of considerations from infrastructure, application patterns, and data management to application building and monitoring. Additionally, after incorporating resilience, it is essential to maintain it in a continuous manner. In this session, explore various considerations for implementing processes designed to provide continuous improvement through a DevOps methodology. Review various services that can incorporate resilience in the development process in a nearly continuous manner.
DOP312 Observing your applications from development through production
Implementing observability differs at various stages of the software development lifecycle. In development, detailed logging and tracing are necessary to understand application behavior. In testing, logging and tracing are needed but in varying levels of detail and must be augmented by new metrics. In integration and production, it’s necessary to correlate and contextualize large volumes of data with dashboards that encompass metrics, alarms, and notifications connected to internal and external events. In this session, explore the mechanisms, mental models, and tools (including Amazon CloudWatch, AWS CloudTrail, AWS X-Ray and Amazon DevOps Guru) that top-performing teams use to observe applications throughout various stages of the software development lifecycle.
DOP313 Best practices for securing your software delivery lifecycle
In this session, learn about ways you can secure your AWS CI/CD pipeline. Review topics like security of the pipeline versus security in the pipeline, and learn about practices to incorporate security checkpoints across various pipeline stages, security event management, and aggregation of vulnerability findings into a unified display. This session also introduces foundational methodologies that combine best practices, processes, and tools to increase an organization’s ability to deliver applications and services securely.
DOP314 Write, deploy, and provision cloud resources with AWS Developer Tools
In this session, learn how you can use various AWS Developer Tools to improve your ergonomics across the entire development lifecycle. This session dives deep into IDE extensions, SDKs, and toolkits that provide first-class integrations with AWS services. It also explores how to manage and fine-tune your resources with the AWS Command Line Interface (AWS CLI); how to define your infrastructure in common programming languages with AWS CDK; and how to automate testing, building, debugging, and deployment.
DOP315 What’s new with AWS CloudFormation and AWS CDK
Join this session to learn about new features to up-level your infrastructure as code (IaC) experiences on AWS. It covers working with AWS CloudFormation modules and AWS CDK constructs to make working with AWS easier; CloudFormation registry to streamline creating, publishing, discovering, and using AWS and third-party plugins; CloudFormation StackSets and CDK Pipelines to automate the deployment of resources and applications across multiple AWS Regions and accounts; CloudFormation Guard 2.0 to attain security and best practice compliance before deployments reach production; and more. Explore how AWS is improving our IaC coverage of AWS services and features in a scalable, decentralized way and how you can contribute.
DOP325 Building with the new AWS SDKs for Rust, Kotlin, and Swift
Writing code in the AWS SDKs for Rust, Kotlin, and Swift has never been as easy as it is now. This session explores how AWS built these SDKs in parallel, the commonalities they share, and how to build an application with each one. Then, it details best practices for using the SDKs and how to use the features to test your code efficiently. Lastly, this session takes a close look at how the SDKs work and reviews the road map for the future.
DOP328-S Slack is the digital HQ for AWS developers and DevOps teams (sponsored by Slack)
With increased pressure on software teams to release high-quality products faster, it’s more important than ever to work effectively in an interdependent and cross-functional manner. Yet, communication and collaboration have not changed to reflect the way Agile and DevOps teams actually get work done. Join this session to find out why Slack is the digital HQ for engineering and operations teams. This presentation is brought to you by Slack, an AWS Partner. Speakers: Logan Franey (Slack) and Clint Burns (Slack).
Level 400 – Expert
DOP402-R1 and DOP402-R2 Automating cross-account CI/CD pipelines
When building a deployment strategy for your applications, using a multi-account approach is a recommended best practice. This limits the area of impact for changes made and results in better modularity, security, and governance. In this session, dive deep into an example multi-account deployment using infrastructure as code (IaC) services such as the AWS CDK, AWS CodePipeline, and AWS CloudFormation. Also explore a real-world customer use case that is deploying at scale across hundreds of AWS accounts.
Builders’ Sessions
Builders Sessions are small-group sessions led by an AWS expert who guides you as you build the service or product. Each builders’ session begins with a short explanation or demonstration of what you are going to build. Once the demonstration is complete, use your laptop to experiment and build with the AWS expert.
Level 300 – Advanced
DOP303 Assessing your application resiliency using chaos engineering
This builders’ session guides you through the principles of chaos engineering and building observability to assess the resiliency of your application and infrastructure. Walk through a hands-on exercise using AWS Fault Injection Simulator to inject faults and observe the impacts using various managed services such as an Amazon CloudWatch dashboard. Learn to use Amazon DevOps Guru, which uses machine learning for observability, to improve the minimum time to recovery (MTTR) by decreasing downtime.
DOP304 Creating and publishing AWS CloudFormation public resources
This builders’ session guides you through the process for creating AWS CloudFormation extensions for a CloudFormation public or private registry. Also, learn how to consume resource types from the registries created by other teams or organizations.
DOP305-R1 and DOP305-R2 Continuous deployment with AWS CDK Pipelines
CDK Pipelines is a new AWS CDK construct that simplifies defining and building CI/CD pipelines for safely deploying software changes. This builders’ session shows you how to effectively use CDK Pipelines to manage software releases.
Chalk Talks
Chalk Talks are highly interactive sessions with a small audience. Experts lead you through problems and solutions on a digital whiteboard as the discussion unfolds. Each begins with a short lecture (10–15 minutes) delivered by an AWS expert, followed by a 45- or 50-minute Q&A session with the audience.
Level 200 – Intermediate
DOP201 Provisioning, automating, and orchestrating IaC on AWS
This chalk talk answers your questions about infrastructure as code (IaC), including relevant AWS services and partner products. It covers topics like IaC patterns, the AWS Cloud Development Kit (AWS CDK) and AWS CloudFormation, augmentation of your CI/CD workflows with services like AWS Systems Manager, and how to select the right tools for the job. Join this talk and bring your questions.
DOP202 Increasing availability with AWS observability solutions
In this chalk talk, learn how you can use Amazon CloudWatch to gain insights about the trends and patterns of your infrastructure performance in real time. Learn how to slice and dice your CloudWatch Container Insights metrics to help you gain actionable insights. Also, learn how to monitor blue/green deployments to stay away from downtimes. Lastly, discuss how to use metric querying to analyze and compare how your business is doing across different areas.
DOP203-R1 and DOP203-R2 Getting started developing backend applications in the cloud
This chalk talk dives deep into the most common strategies for organizing the development of complex cloud applications using various AWS services and solutions. Learn about how to get started with your local development environment, about how to select the right infrastructure, and about achieving the fastest time to market. Join this talk and bring your questions.
DOP204 Testing on AWS
Testing software is a crucial part of the software delivery lifecycle, with testing methodologies prescribed for every stage of the process from local unit testing on a developer laptop to load testing production environments. This chalk talk briefly covers several test methodologies, then transitions to a Q&A session where you can ask AWS experts your testing-related questions.
DOP209-R1 and DOP209-R2 Amazon’s DevOps culture
In this chalk talk, learn about how Amazon enables its developers to rapidly release and iterate software while maintaining industry-leading standards on security, reliability, and performance. Consider the tradition of two-pizza teams and how to maintain a culture of DevOps in a large enterprise. Also, hear how you can help AWS customers build such a culture for themselves.
DOP210 Using on-premises Git with AWS Developer Tools for security and compliance
In this chalk talk, learn about using AWS Development Tools in conjunction with third-party Git solutions, such as GitHub Enterprise, Bitbucket Server, and more.
DOP211-R1 and DOP211-R2 Building scalable machine-learning pipelines
In this chalk talk, explore how to build, automate, manage, and scale machine learning (ML) workflows using the AWS-native DevOps tools and services. Learn how to provision the underlying resources needed to enable CI/CD capabilities for your ML development lifecycle. Also, learn how to use the built-in templates or create your own custom templates using AWS CloudFormation.
Level 300 – Advanced
DOP302 Continuous compliance for your development workflow
This chalk talk dives deep into the importance of and mechanisms for meeting security and compliance requirements for your organization. Learn ways that you can enforce pre- and post-deployment standards, shift-left testing, and use of services like Amazon CodeGuru Reviewer, AWS CloudFormation Guard, and AWS Config for security static analysis and runtime compliance checks. Join this talk and bring your questions.
DOP316-R1 and DOP316-R2 continuous integration strategies and best practices
In this chalk talk, learn about using continuous integration across your branches and pull-request workflows. Explore various considerations for monolith versus containerized applications, incorporating best practices like security checkpoints, generating test reports, integrating open-source packages, and more. Learn some build-optimization techniques with available tools and services. Lastly, evaluate integration into the GitOps model.
DOP317 Application deployment strategies for AWS applications
This chalk talk covers deployment strategies, including blue/green, in-place, feature-flag, and canary deployments. It also explores strategies for working with data structure changes.
DOP318 Deploying AWS Config conformance packs with RDK using AWS CodePipeline
In this chalk talk, learn how to use a simple pipeline to create custom AWS Config rules and deploy them across an AWS Organizations organization-using AWS Config, the AWS Developer Tools, the AWS Config Rule Development Kit (RDK), and RDKLib. During the talk, explore how to build, test, and deploy these rules at scale across multiple AWS accounts in a repeatable, secure, and automated way.
DOP319-R1 and DOP319-R2 Choose your own adventure: AWS Java developer tooling
Are you a Java developer deploying applications to AWS? Do you wonder how you can improve your development cycle, be more productive, and deliver better-performing applications? During this highly interactive chalk talk, AWS experts adapt topics in real time to cover those that interest you the most. Choose from a range of options, from Java-specific integrations with popular services like Amazon S3, AWS Lambda, and Amazon DynamoDB, to Java-focused IDE tooling to help you be more productive when you’re authoring code that runs on AWS. Also, review Amazon Corretto (open JDK) and Amazon CodeGuru as part of Java application development.
Level 400 – Expert
DOP403-R1 and DOP403-R2 Maximize value with AWS CloudFormation advanced features
In this chalk talk, gain insights into AWS CloudFormation advanced features to transform the way you provision and manage your AWS and third-party resources. Discover how to use best practice plugins from the CloudFormation registry to create a CloudFormation template, use CloudFormation Guard to check the template for security and compliance errors, disable the rollback to accelerate provisioning, and use CloudFormation StackSets to provision resources in multiple AWS accounts and Regions.
Workshops
Workshops are two-hour interactive learning sessions where you work in small group teams to solve problems using AWS services. Each workshop starts with a short lecture (10–15 minutes) by the main speaker, and the rest of the time is spent working as a group. Come prepared with your laptop and a willingness to learn!
Level 200 – Intermediate
DOP205-R1 and DOP205-R2 Build your infrastructure with AWS CloudFormation and the AWS CDK
In this workshop, learn how to build using infrastructure as code with AWS CloudFormation and the AWS CDK. Create resources using CloudFormation and learn about maintenance and operations tips. Also delve into using the AWS CDK to enable developers to utilize their choice of programming language to create infrastructure. The workshop walks you through the steps of coding and building your own constructs (or integrating solution constructs) and publishing them as shared libraries. Let’s build!
DOP206 Improve availability and resilience with fault injection experiments
This workshop introduces you to chaos engineering. Learn how to improve the resiliency of applications and infrastructure using hypothesis-based experiments, disruption, and observation, including recurrent scenarios and CI/CD. Get hands-on with AWS Fault Injection Simulator and AWS Systems Manager to simulate outage scenarios, and learn how to combine this with observability tools like Amazon CloudWatch and Amazon DevOps Guru to uncover hidden issues, expose unseen areas, and validate remediation steps.
DOP207 Improving development ergonomics for developers
In this workshop, get hands-on with developer tools on AWS including AWS IDE toolkits, SDKs, and CLIs to build a modern application. Learn how to easily and efficiently build, test, and debug a serverless application and explore modern tooling, including Amazon CodeGuru, AWS Serverless Application Model (AWS SAM) tooling, and managed environments, to rapidly prototype and debug secure applications in the cloud.
Level 300 – Advanced
DOP306 Implementing release management strategies for CI/CD
This workshop guides you through building CI/CD pipelines with release-management best practices, including artifact management as well as zero-downtime release promotion and rollback mechanisms. Evaluate various rollback/roll forward strategies across compute types and assess the need for manual processes.
DOP307-R1 and DOP307-R2 AWS CLI tips and tricks
In this workshop, learn AWS Command Line Interface (AWS CLI) tips and tricks. Discover how to efficiently interact with your AWS services, manage your AWS resources, automate your regular repetitive operations, and utilize various use cases presented in this workshop. Join this workshop to hear about new feature functionalities integrated for developer operations.
DOP320 Observability: Best practices for improving developer productivity
In this hands-on workshop, dive deep into how you can improve developer productivity by correlating metrics and traces to identify user impact from any source and to find broken or expensive code paths as quickly as possible. Learn how to do this with AWS services, without having to re-instrument code, when adding new observability tools to development workflows.
Level 400 – Expert
DOP401-R1 and DOP401R2 Continuous security and compliance for your CI/CD pipeline
This workshop dives deep into the importance of and mechanisms for meeting security and compliance requirements for your organization. Learn ways that you can enforce pre- and post-deployment standards, shift-left testing, and use of services like Amazon CodeGuru Reviewer, AWS CloudFormation Guard, and AWS Config for security static analysis and runtime compliance checks. Join this talk and bring your questions.
In addition to these sessions, we offer leadership sessions through which you can hear directly from AWS leaders as they share the latest advances in AWS technologies, set the future product direction, and motivate you through compelling success stories. Also, expect to hear about the launch of new and exciting AWS services and features throughout the event.
Still looking for more?
We have an extensive list of curated content on DevOps on AWS, including case studies, white papers, previous re:Invent presentations, reference architectures, and how-to instructional videos. Subscribe to our AWS Developer Tools and Services channel to get updates when new videos are added.
Get started with AWS DevOps Guru Multi-Account Insight Aggregation with AWS Organizations
=======================
Amazon DevOps Guru is a fully managed service that uses machine learning (ML) to continuously analyze and consolidate operational data streams from multiple sources, such as Amazon CloudWatch metrics, AWS Config, AWS CloudFormation, AWS X-Ray, and provide you with a single console dashboard. This dashboard helps customers improve operational performance and avoid expensive downtime by generating actionable insights that flag operational anomalies, identify the likely root cause, and recommend corrective actions.
As customers scale their AWS resources across multiple accounts and deploy DevOps Guru across applications and use cases on these accounts, they get a siloed view of the operational health of their applications. Now you can enable multi-account support with AWS Organizations and designate a member account to manage operational insights across your entire organization. This delegated administrator can get a holistic view of the operational health of their applications across the organization—without the need for any additional customization.
In this post, we will walk through the process of setting up a delegated administrator. We will also explore how to monitor insights across your entire organization from this account.
Overview of the multi-account environment
The multi-account environment operates based on the organizational hierarchy that your organization has defined in AWS Organizations. This AWS service helps you centrally manage and govern your cloud environment. For this reason, you must have an organization set up in AWS Organizations before you can implement multi-account insights visibility. AWS Organizations is available to all AWS customers at no additional charge, and the service user guide has instructions for creating and configuring an organization in your AWS environment.
Understanding the management account, a delegated administrator, and other member accounts is fundamental to the multi-account visibility functionality in DevOps Guru. Before proceeding further, let’s recap these terms.
A management account is the AWS account you use to create your organization. You can create other accounts in your organization, invite and manage invitations for other existing accounts to join your organization, and remove accounts from your organization. The management account has wide permissions and access to accounts within the organization. It should only be used for absolutely essential administrative tasks, such as managing accounts, OUs, and organization-level policies. You can refer to the AWS Organizations FAQ for more information on management accounts.
When the management account gives a member account service-level administrative permissions, it becomes a delegated administrator. Because the permissions are assigned at the service level, delegated administrator’s privileges are confined to the AWS service in question (DevOps Guru, in this case). The delegated administrator manages the service on behalf of the management account, leaving the management account to focus on administrative tasks, such as account and policy management. Currently, DevOps Guru supports a single delegated administrator, which operates at the root level (i.e., at the organization level). When elevating a member account to a delegated administrator, it must be in the organization. For more information about adding a member account to an organization, see inviting an AWS account to join your organization.
Member accounts are accounts without any administrative privilege. An account can be a member of only one organization at a time.
Prerequisites
You must have the following to enable multi-account visibility:
An organization already set up in AWS Organizations. AWS Organizations is available to all AWS customers at no additional charge, and the service user guide has instructions for creating and configuring an organization in your AWS environment.
A member account that is in your organization and already onboarded in DevOps Guru. This account will be registered as a delegated administrator. For more information about adding a member account to an organization, see inviting an AWS account to join your organization.
Setting up multi-account insights visibility in your organization
In line with AWS Organizations’ best practices, we recommend first assigning a delegated administrator. Although a management account can view DevOps Guru insights across the organization, management accounts should be reserved for organization-level management, while the delegated administrator manages at the service level.
Registering a Delegated Administrator
A delegated administrator must be registered by the management account. The steps below assume that you have a member account to register as a delegated administrator. If your preferred account is not yet in your organization, then invite the account to join your organization.
To register a delegated administrator
- Log in to the DevOps Guru Console with the management account.
- On the welcome page, under Set up type, select Monitor applications across your organizations. If you select Monitor applications in the current AWS account, then your dashboard will display insights for the management account.
- Under Delegated administrator, select Register a delegated administrator (Recommended).
- Select Register delegated administrator to complete the process.

To de-register a delegated administrator
- Log in to the DevOps Guru Console and navigate to the Management account
- On the Management account page, select De-register administrator.

Viewing insights as a Delegated Administrator
As the delegated administrator, you can choose to view insights from
specific accounts
specific OUs
the entire organization
To view insights from specific accounts
- Log in to the DevOps Guru console, and select Accounts from the dropdown menu on the dashboard.
- Select the search bar to display a list of member accounts.
- Select up to five accounts, and select anywhere outside the dropdown menu to apply your selection. Simply select the delegated administrator account from the dropdown menu to view insights from the delegated administrator account.

The system health summary now will display information for the selected accounts.
To view insights from specific organizational units
- Log in to the DevOps Guru console, and select Organizational Units from the dropdown menu on the dashboard.
- Select the search bar to display the list of OUs.
- Select up to five OUs, and select anywhere outside of the dropdown menu to apply your selection.

Now the system health summary will display information for the selected OUs. Nested OUs are currently not supported, so only the accounts directly under the OU are included when an OU is selected. Select the sub-OU in addition to the parent OU to include accounts in a sub-OU,.
To view insights across the entire organization
- Log in to the DevOps Guru console and navigate to the Insights
- On the Reactive tab, you can see a list of all the reactive insights in the organization. On the Proactive tab, you can also see a list of all the proactive insights in the organization. You will notice that the table displaying the insights now has an Account ID column (highlighted in the snapshot below). This table aggregates insights from different accounts in the organization.

- Use one or more of the following filters to find the insights that you are looking for
- Choose the Reactive or Proactive
- In the search bar, you can add an account ID, status, severity, stack, or resource name to specify a filter.

-
- To search by account ID, select the search bar, select Account, then select an account ID in the submenu.
- Choose or specify a time range to filter by insight creation time. For example, 12h shows insights created in the past 12 hours, and 1d shows the insights of the previous day. 1w will show the past week’s insights, and 1m will show the last month’s insights. Custom lets you specify another time range. The maximum time range you can use to filter insights is 180 days.

Viewing insights from the Management Account
Viewing insights from the management account is similar to viewing insights from the delegated administrator, so the process listed for the delegated administrator also applies to the management account. Although the management account can view insights across the organization, it should be reserved for running administrative tasks across various AWS services at an organization level.
Important notes
Multi-account insight visibility works at a region level, meaning that you can only view insights across the organization within a single AWS region. You must change the AWS region from the region dropdown menu at the top-right corner of the console to view insights from a different AWS region.
For data security reasons, the delegated administrator can only access insights generated across the organization after the selected member account became the delegated administrator. Insights generated across the organization before the delegated administrator registration will remain inaccessible to the delegated administrator.
Conclusion
The steps detailed above show how you can quickly enable multi-account visibility to monitor application health across your entire organization.
AWS Customers are now using AWS DevOps Guru to monitor and improve application performance, and you too can start monitoring your applications by following the instructions in the product documentation. Head over to the AWS DevOps Guru console to get started today.
Deep learning image vector embeddings at scale using AWS Batch and CDK
=======================
Applying various transformations to images at scale is an easily parallelized and scaled task. As a Computer Vision research team at Amazon, we occasionally find that the amount of image data we are dealing with can’t be effectively computed on a single machine, but also isn’t large enough to justify running a large and potentially costly AWS Elastic Map Reduce (EMR) job. This is when we can utilize AWS Batch as our main computing environment, as well as Cloud Development Kit (CDK) to provision the necessary infrastructure in order to solve our task.
In Computer Vision, we often need to represent images in a more concise and uniform way. Working with standard image files would be challenging, as they can vary in resolution or are otherwise too large in terms of dimensionality to be provided directly to our models. For that reason, the common practice for deep learning approaches is to translate high-dimensional information representations, such as images, into vectors that encode most (if not all) information present in them — in other words, to create vector embeddings.
This post will demonstrate how we utilize the AWS Batch platform to solve a common task in many Computer Vision projects — calculating vector embeddings from a set of images so as to allow for scaling.
Architecture Overview

Figure 1: High-level architectural diagram explaining the major solution components.
As seen in Figure 1, AWS Batch will pull the docker image containing our code onto provisioned hosts and start the docker containers. Our sample code, referenced in this post, will then read the resources from S3, conduct the vectorization, and write the results as entries in the DynamoDB Table.
In order to run our image vectorization task, we will utilize the following AWS cloud components:
Amazon ECR — Elastic Container Registry is a Docker image repository from which our batch instances will pull the job images;
S3 — Amazon Simple Storage Service will act as our image source from which our batch jobs will read the image;
Amazon DynamoDB — NoSQL database in which we will write the resulting vectors and other metadata;
AWS Lambda — Serverless compute environment which will conduct some pre-processing and, ultimately, trigger the batch job execution; and
AWS Batch — Scalable computing environment powering our models as embarrassingly parallel tasks running as AWS Batch jobs.
To translate an image to a vector, we can utilize a pre-trained model architecture, such as AlexNet, ResNet, VGG, or more recent ones, like ResNeXt and Vision Transformers. These model architectures are available in most of the popular deep learning frameworks, and they can be further modified and extended depending on our project requirements. For this post, we will utilize a pre-trained ResNet18 model from MxNet. We will output an intermediate layer of the model, which will result in a 512 dimensional representation, or, in other words, a 512 dimensional vector embedding.
Deployment using Cloud Development Kit (CDK)
In recent years, the idea of provisioning cloud infrastructure components using popular programming languages was popularized under the term of infrastructure as code (IaC). Instead of writing a file in the YAML/JSON/XML format, which would define every cloud component we want to provision, we might want to define those components trough a popular programming language.
As part of this post, we will demonstrate how easy it is to provision infrastructure on AWS cloud by using Cloud Development Kit (CDK). The CDK code included in the exercise is written in Python and defines all of the relevant exercise components.
Hands-on exercise
1. Deploying the infrastructure with AWS CDK
For this exercise, we have provided a sample batch job project that is available on Github (link). By using that code, you should have every component required to do this exercise, so make sure that you have the source on your machine. The root of your sample project local copy should contain the following files:
batch_job_cdk - CDK stack code of this batch job project
src_batch_job - source code for performing the image vectorization
src_lambda - source code for the lambda function which will trigger the batch job execution
app.py - entry point for the CDK tool
cdk.json - config file specifying the entry point for CDK
requirements.txt - list of python dependencies for CDK
README.md
- Make sure you have installed and correctly configured the AWS CLI and AWS CDK in your environment. Refer to the CDK documentation for more information, as well as the CDK getting started guide.
- Set the
CDK_DEPLOY_ACCOUNT and CDK_DEPLOY_REGION environmental variables, as described in the project README.md.
- Go to the sample project root and install the CDK python dependencies by running
pip install -r requirements.txt.
- Install and configure Docker in your environment.
- If you have multiple AWS CLI profiles, utilize the
--profile option to specify which profile to use for deployment. Otherwise, simply run cdk deploy and deploy the infrastructure to your AWS account set in step 1.
NOTE: Before deploying, make sure that you are familiar with the restrictions and limitations of the AWS services we are using in this post. For example, if you choose to set an S3 bucket name in the CDK Bucket construct, you must avoid naming conflicts that might cause deployment errors.
The CDK tool will now trigger our docker image build, provision the necessary AWS infrastructure (i.e., S3 Bucket, DynamoDB table, roles and permissions), and, upon completion, upload the docker image to a newly created repository on Amazon Elastic Container Registry (ECR).
2. Upload data to S3
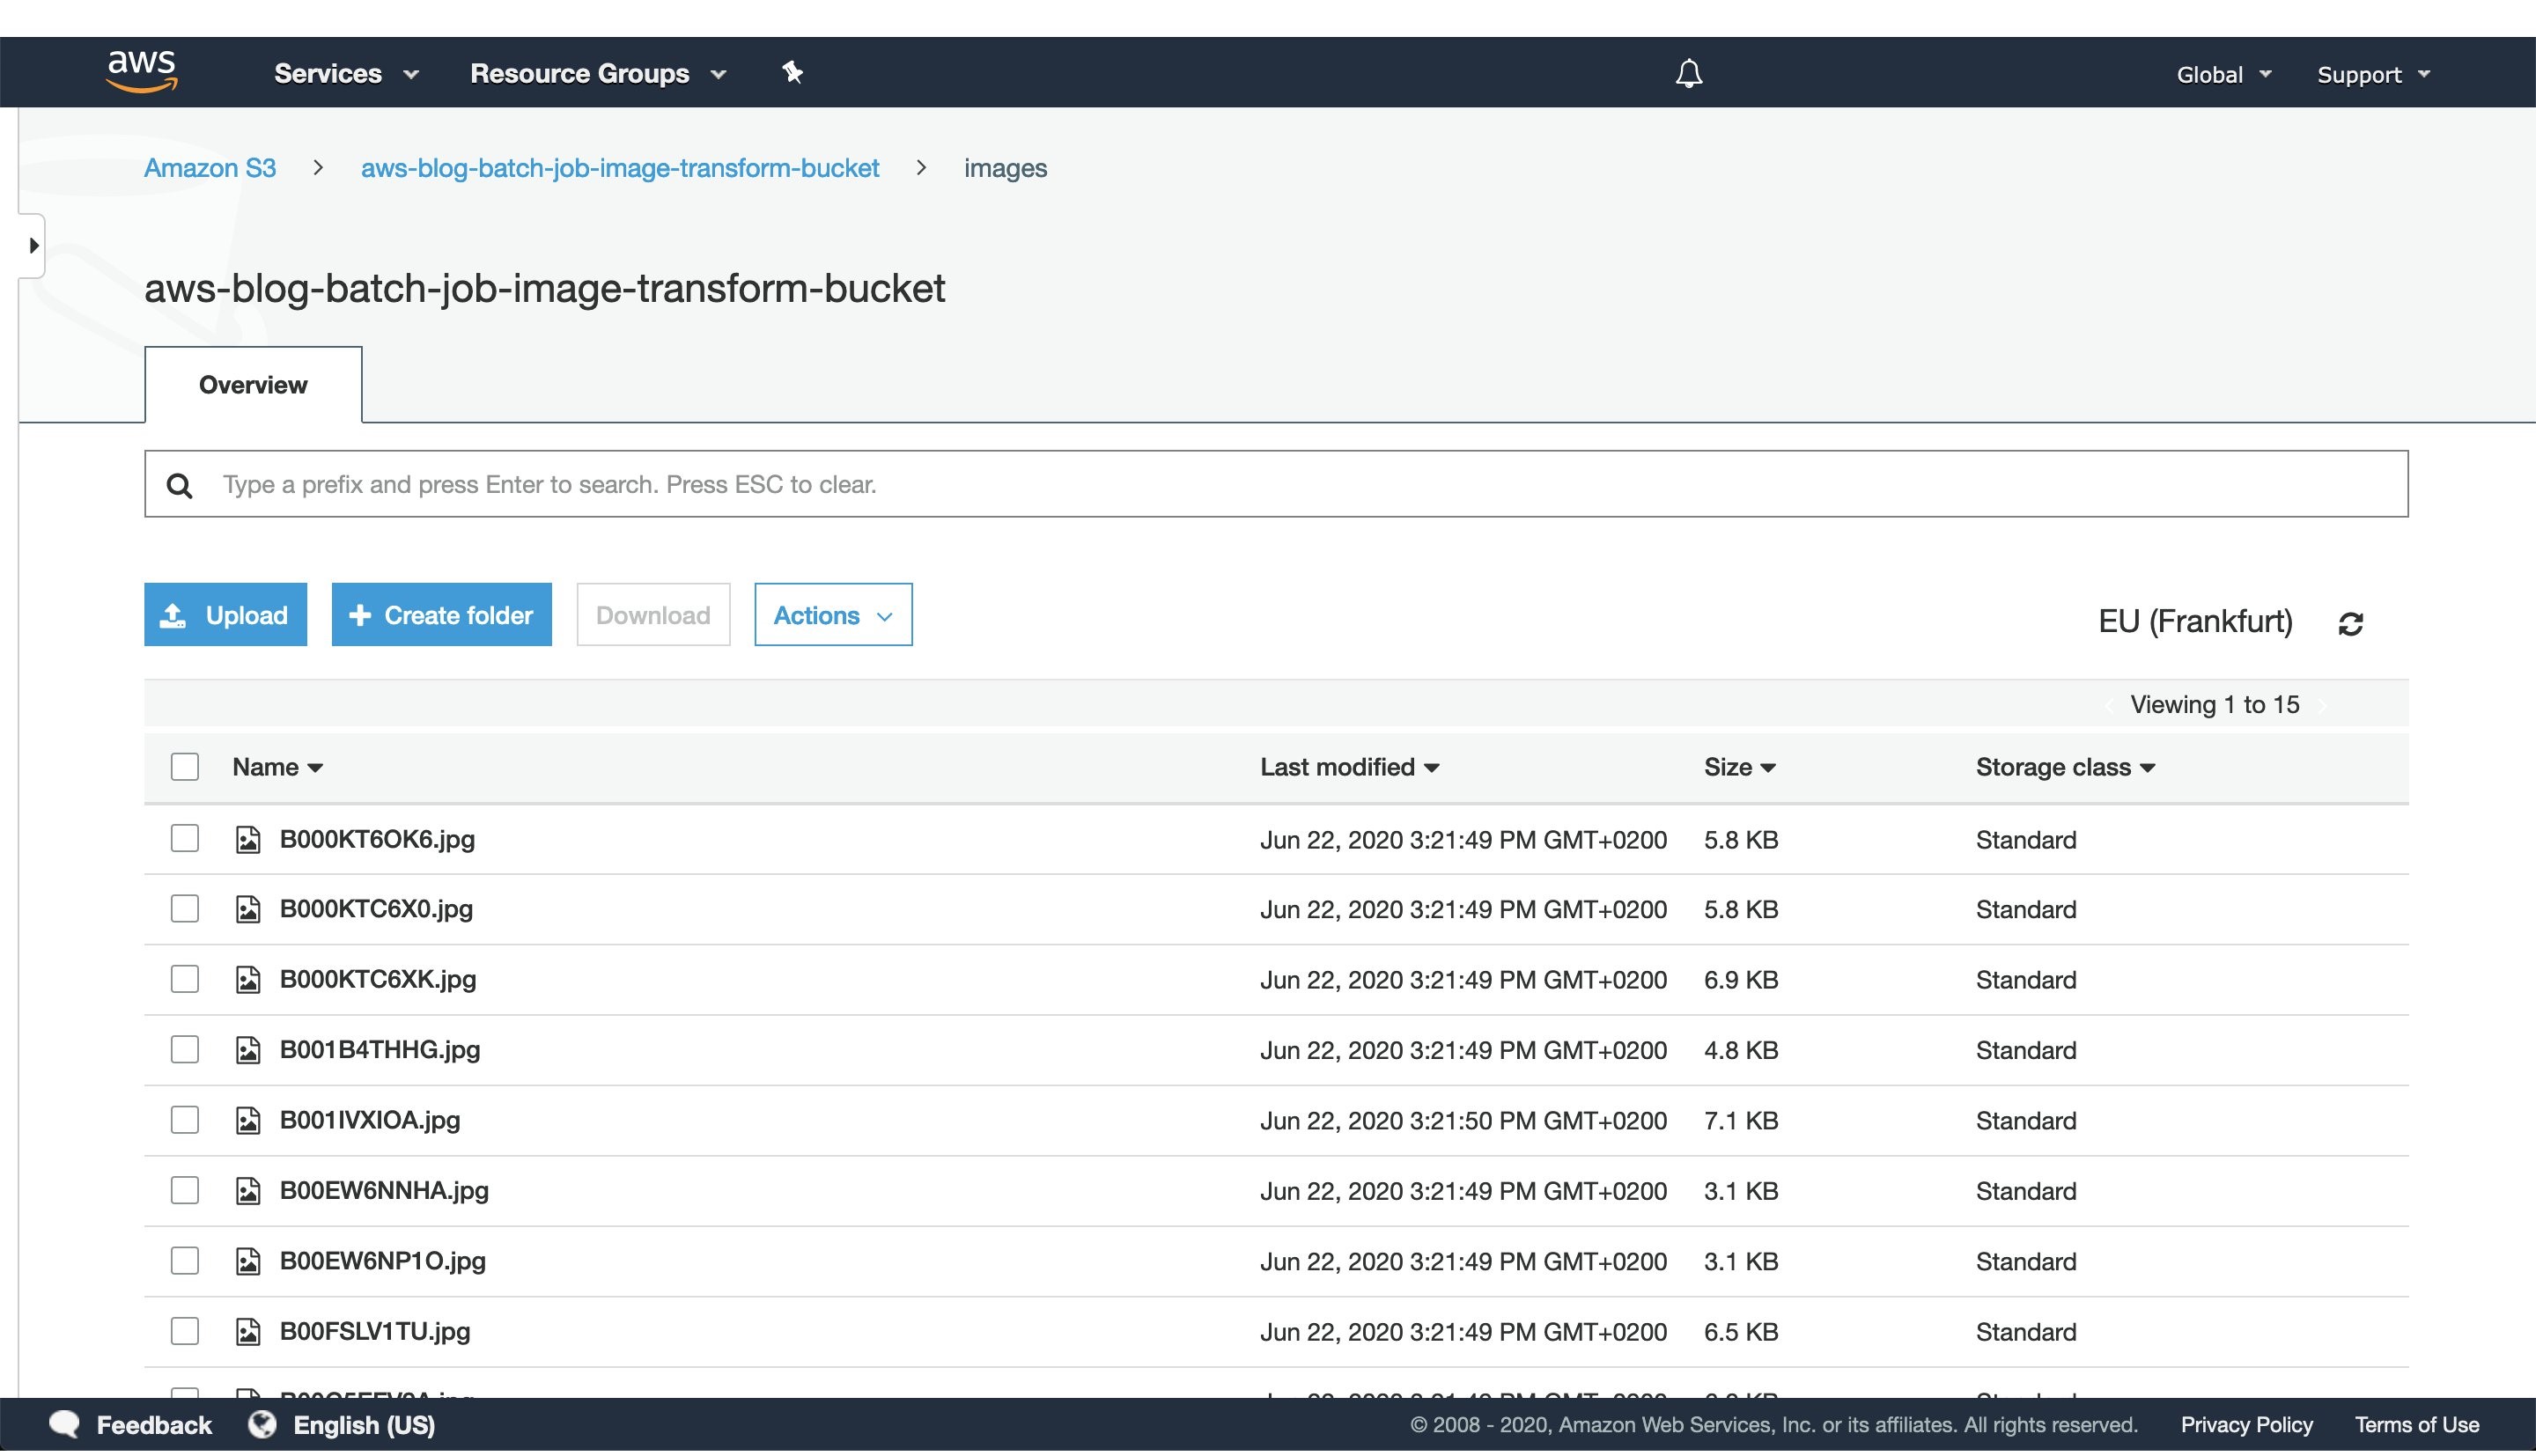
Figure 2: S3 console window with uploaded images to the `images` directory.
After CDK has successfully finished deploying, head to the S3 console screen and upload images you want to process to a path in the S3 bucket. For this exercise, we’ve added every image to the `images` directory, as seen in Figure 2.
For larger datasets, utilize the AWS CLI tool to sync your local directory with the S3 bucket. In that case, consider enabling the ‘Transfer acceleration’ option of your S3 bucket for faster data transfers. However, this will incur an additional fee.
3. Trigger batch job execution
Once CDK has completed provisioning our infrastructure and we’ve uploaded the image data we want to process, open the newly created AWS Lambda in the AWS console screen in order to trigger the batch job execution.
To do this, create a test event with the following JSON body:
{
"Paths": [
"images"
]
}
The JSON body that we provide as input to the AWS Lambda function defines a list of paths to directories in the S3 buckets containing images. Having the ability to dynamically provide paths to directories with images in S3, lets us combine multiple data sources into a single AWS Batch job execution. Furthermore, if we decide in the future to put an API Gateway in front of the Lambda, you could pass every parameter of the batch job with a simple HTTP method call.
In this example, we specified just one path to the `images` directory in the S3 bucket, which we populated with images in the previous step.
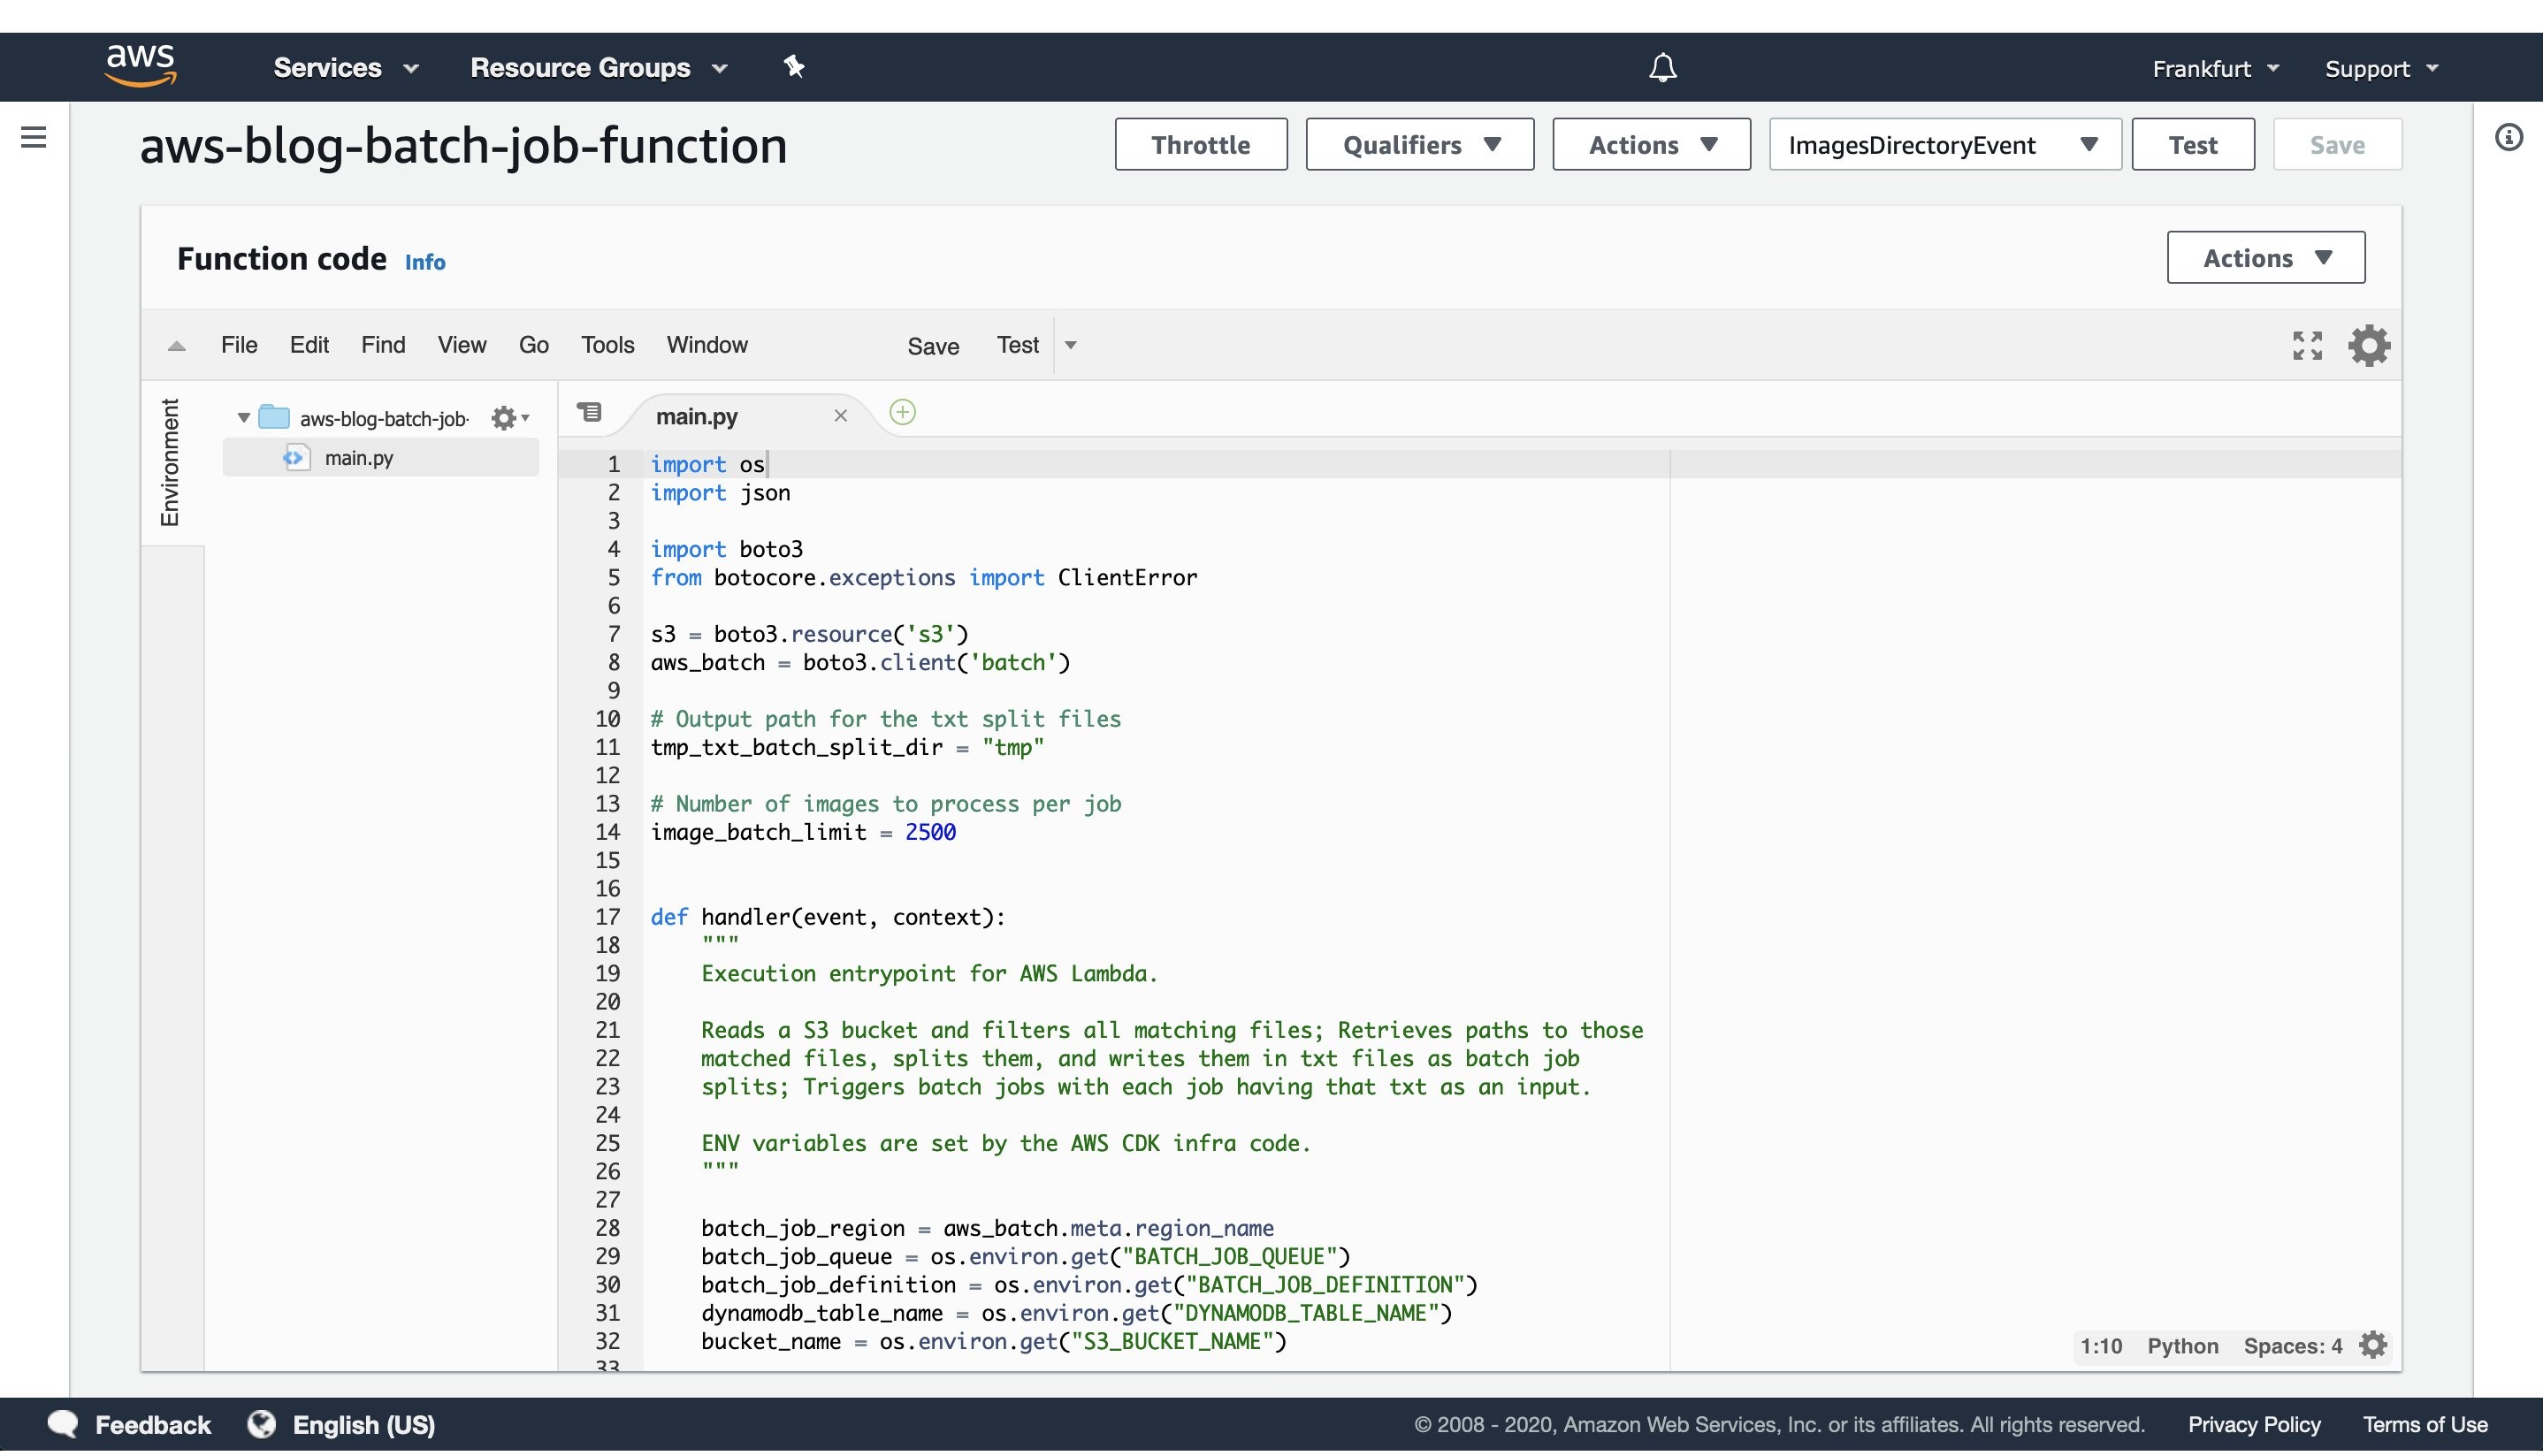
Figure 3: AWS Lambda console screen of the function that triggers batch job execution. Modify the batch size by modifying the `image_batch_limit` variable. The value of this variable will depend on your particular use-case, computation type, image sizes, as well as processing time requirements.
The python code will list every path under the images S3 path, batch them into batches of desired size, and finally save the paths to batches as txt files under tmp S3 path. Each path to a txt files in S3 will be passed as an input to a batch jobs.
Select the newly created event, and then trigger the Lambda function execution. The AWS Lambda function will submit the AWS Batch jobs to the provisioned AWS Batch compute environment.
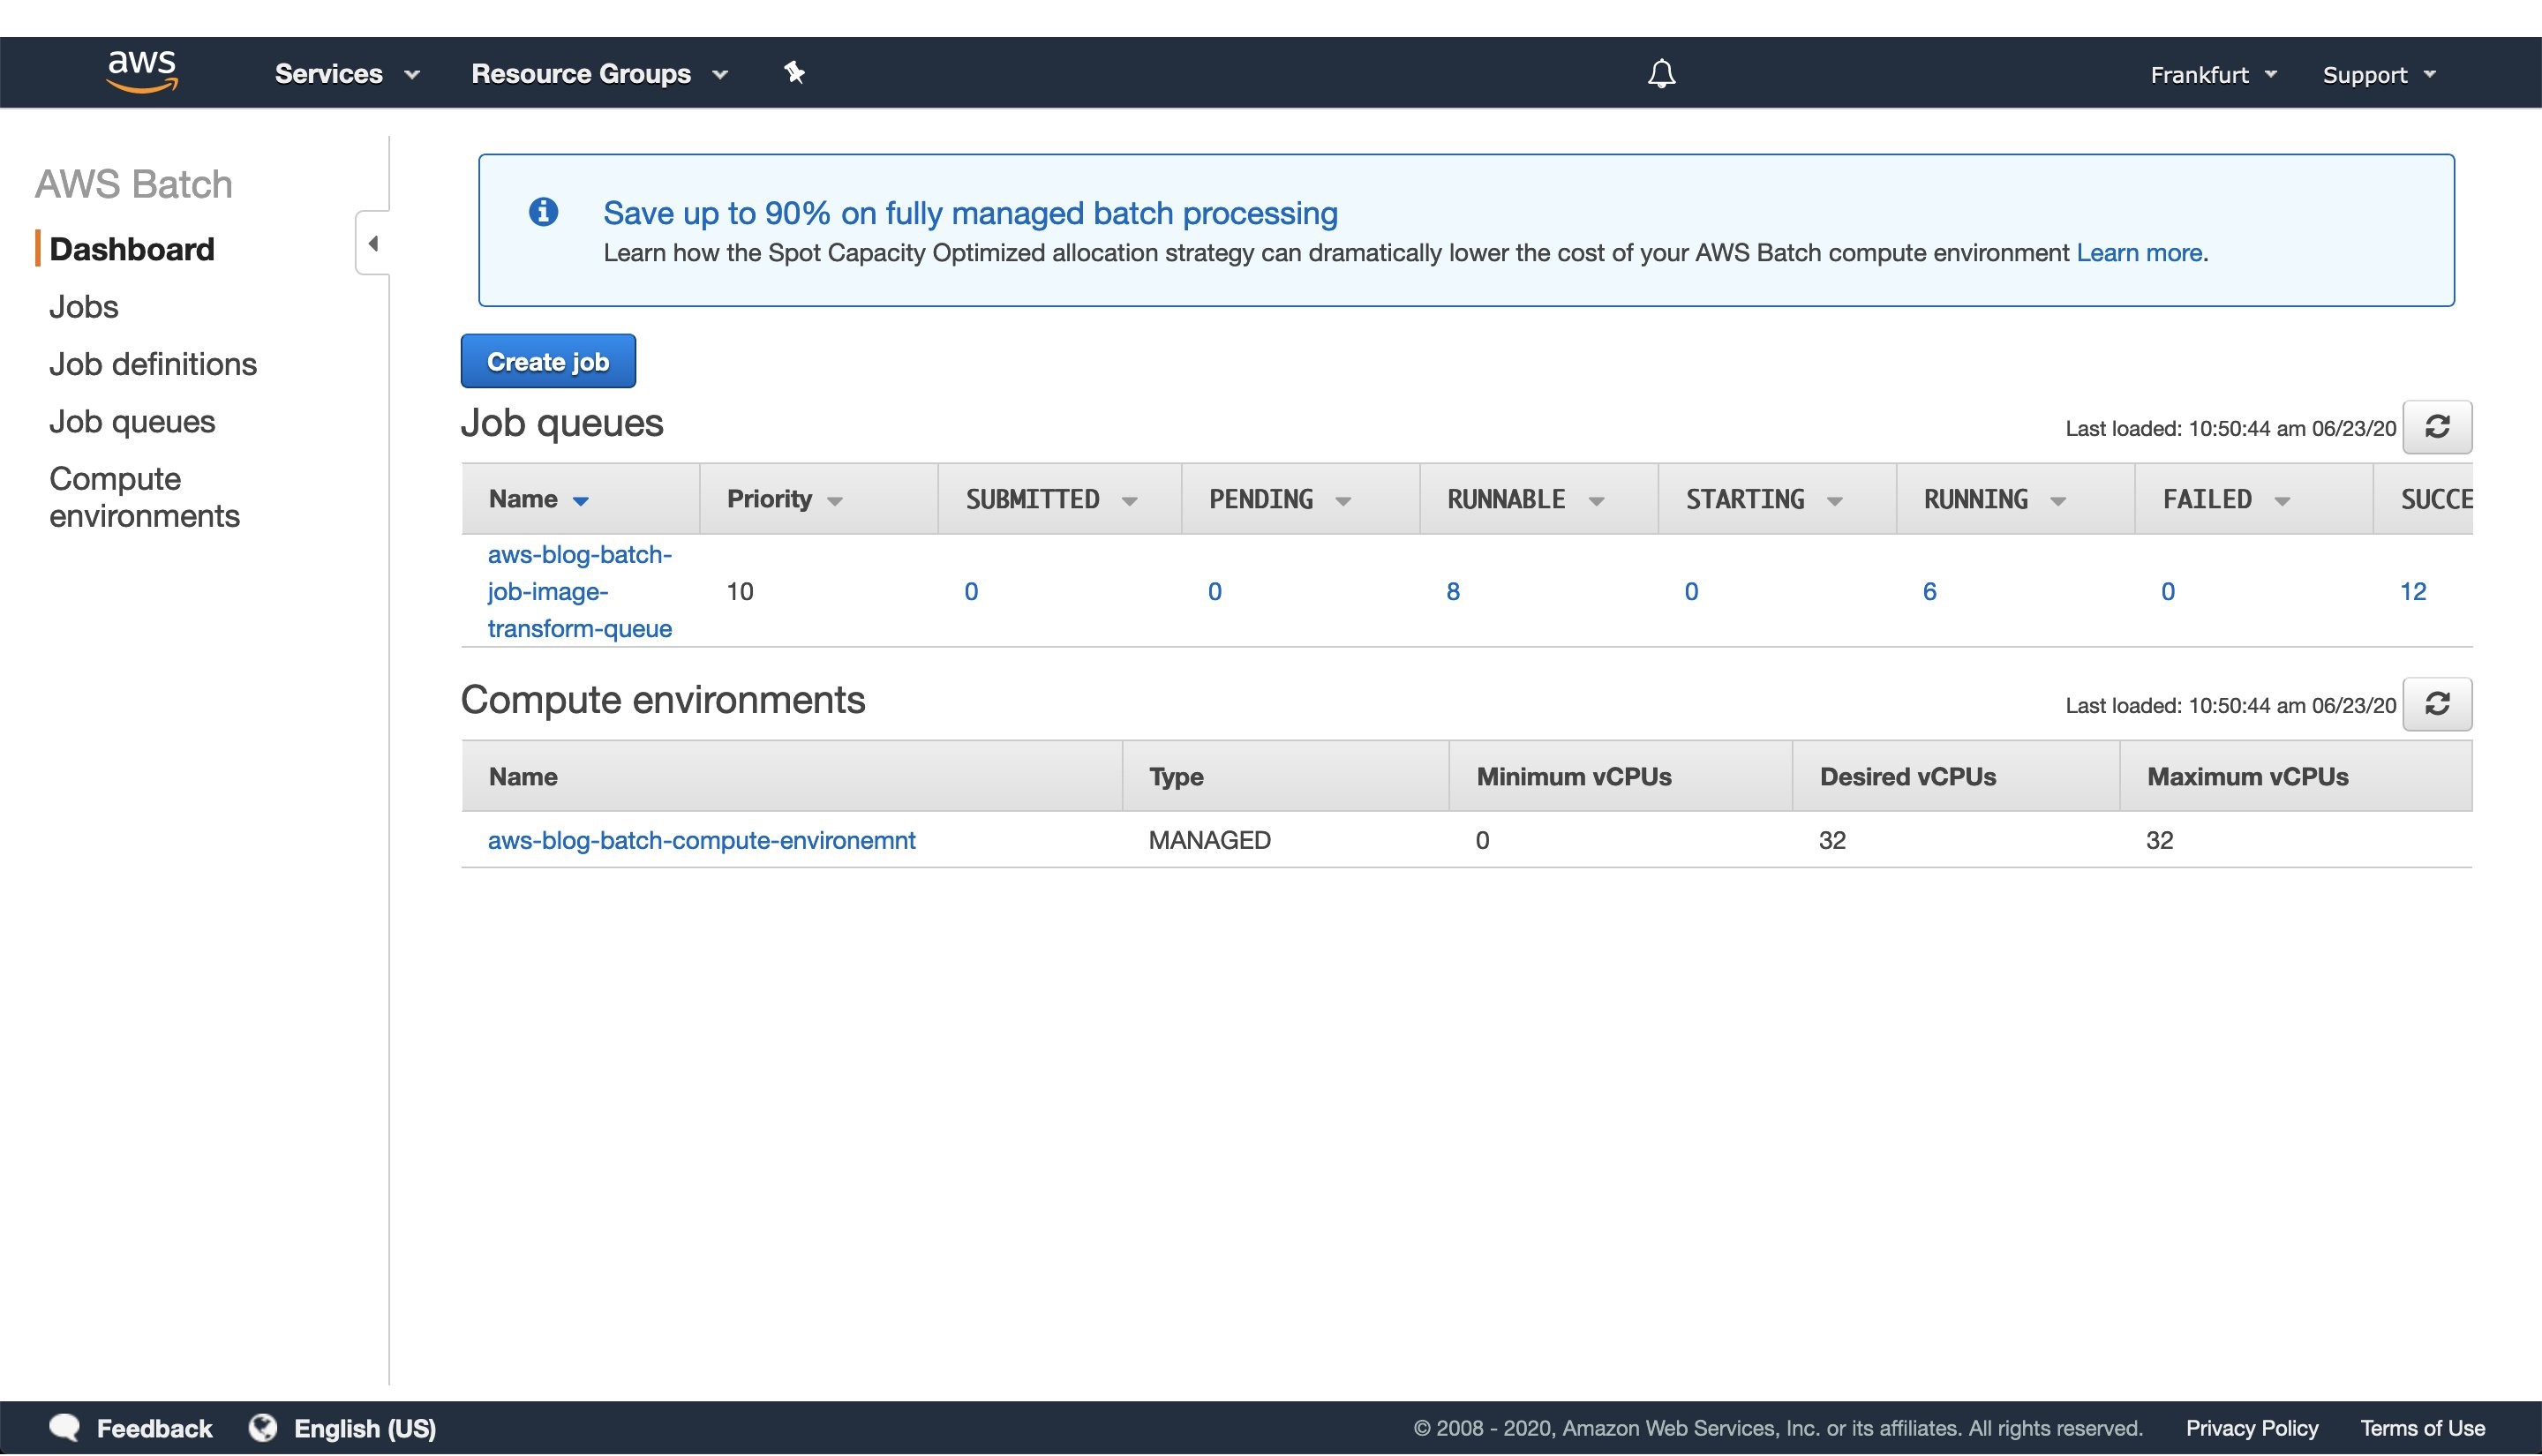
Figure 4: Screenshot of a running AWS Batch job that creates feature vectors from images and stores them to DynamoDB.
Once the AWS Lambda execution finishes its execution, we can monitor the AWS Batch jobs being processed on the AWS console screen, as seen in Figure 4. Wait until every job has finished successfully.
4. View results in DynamoDB
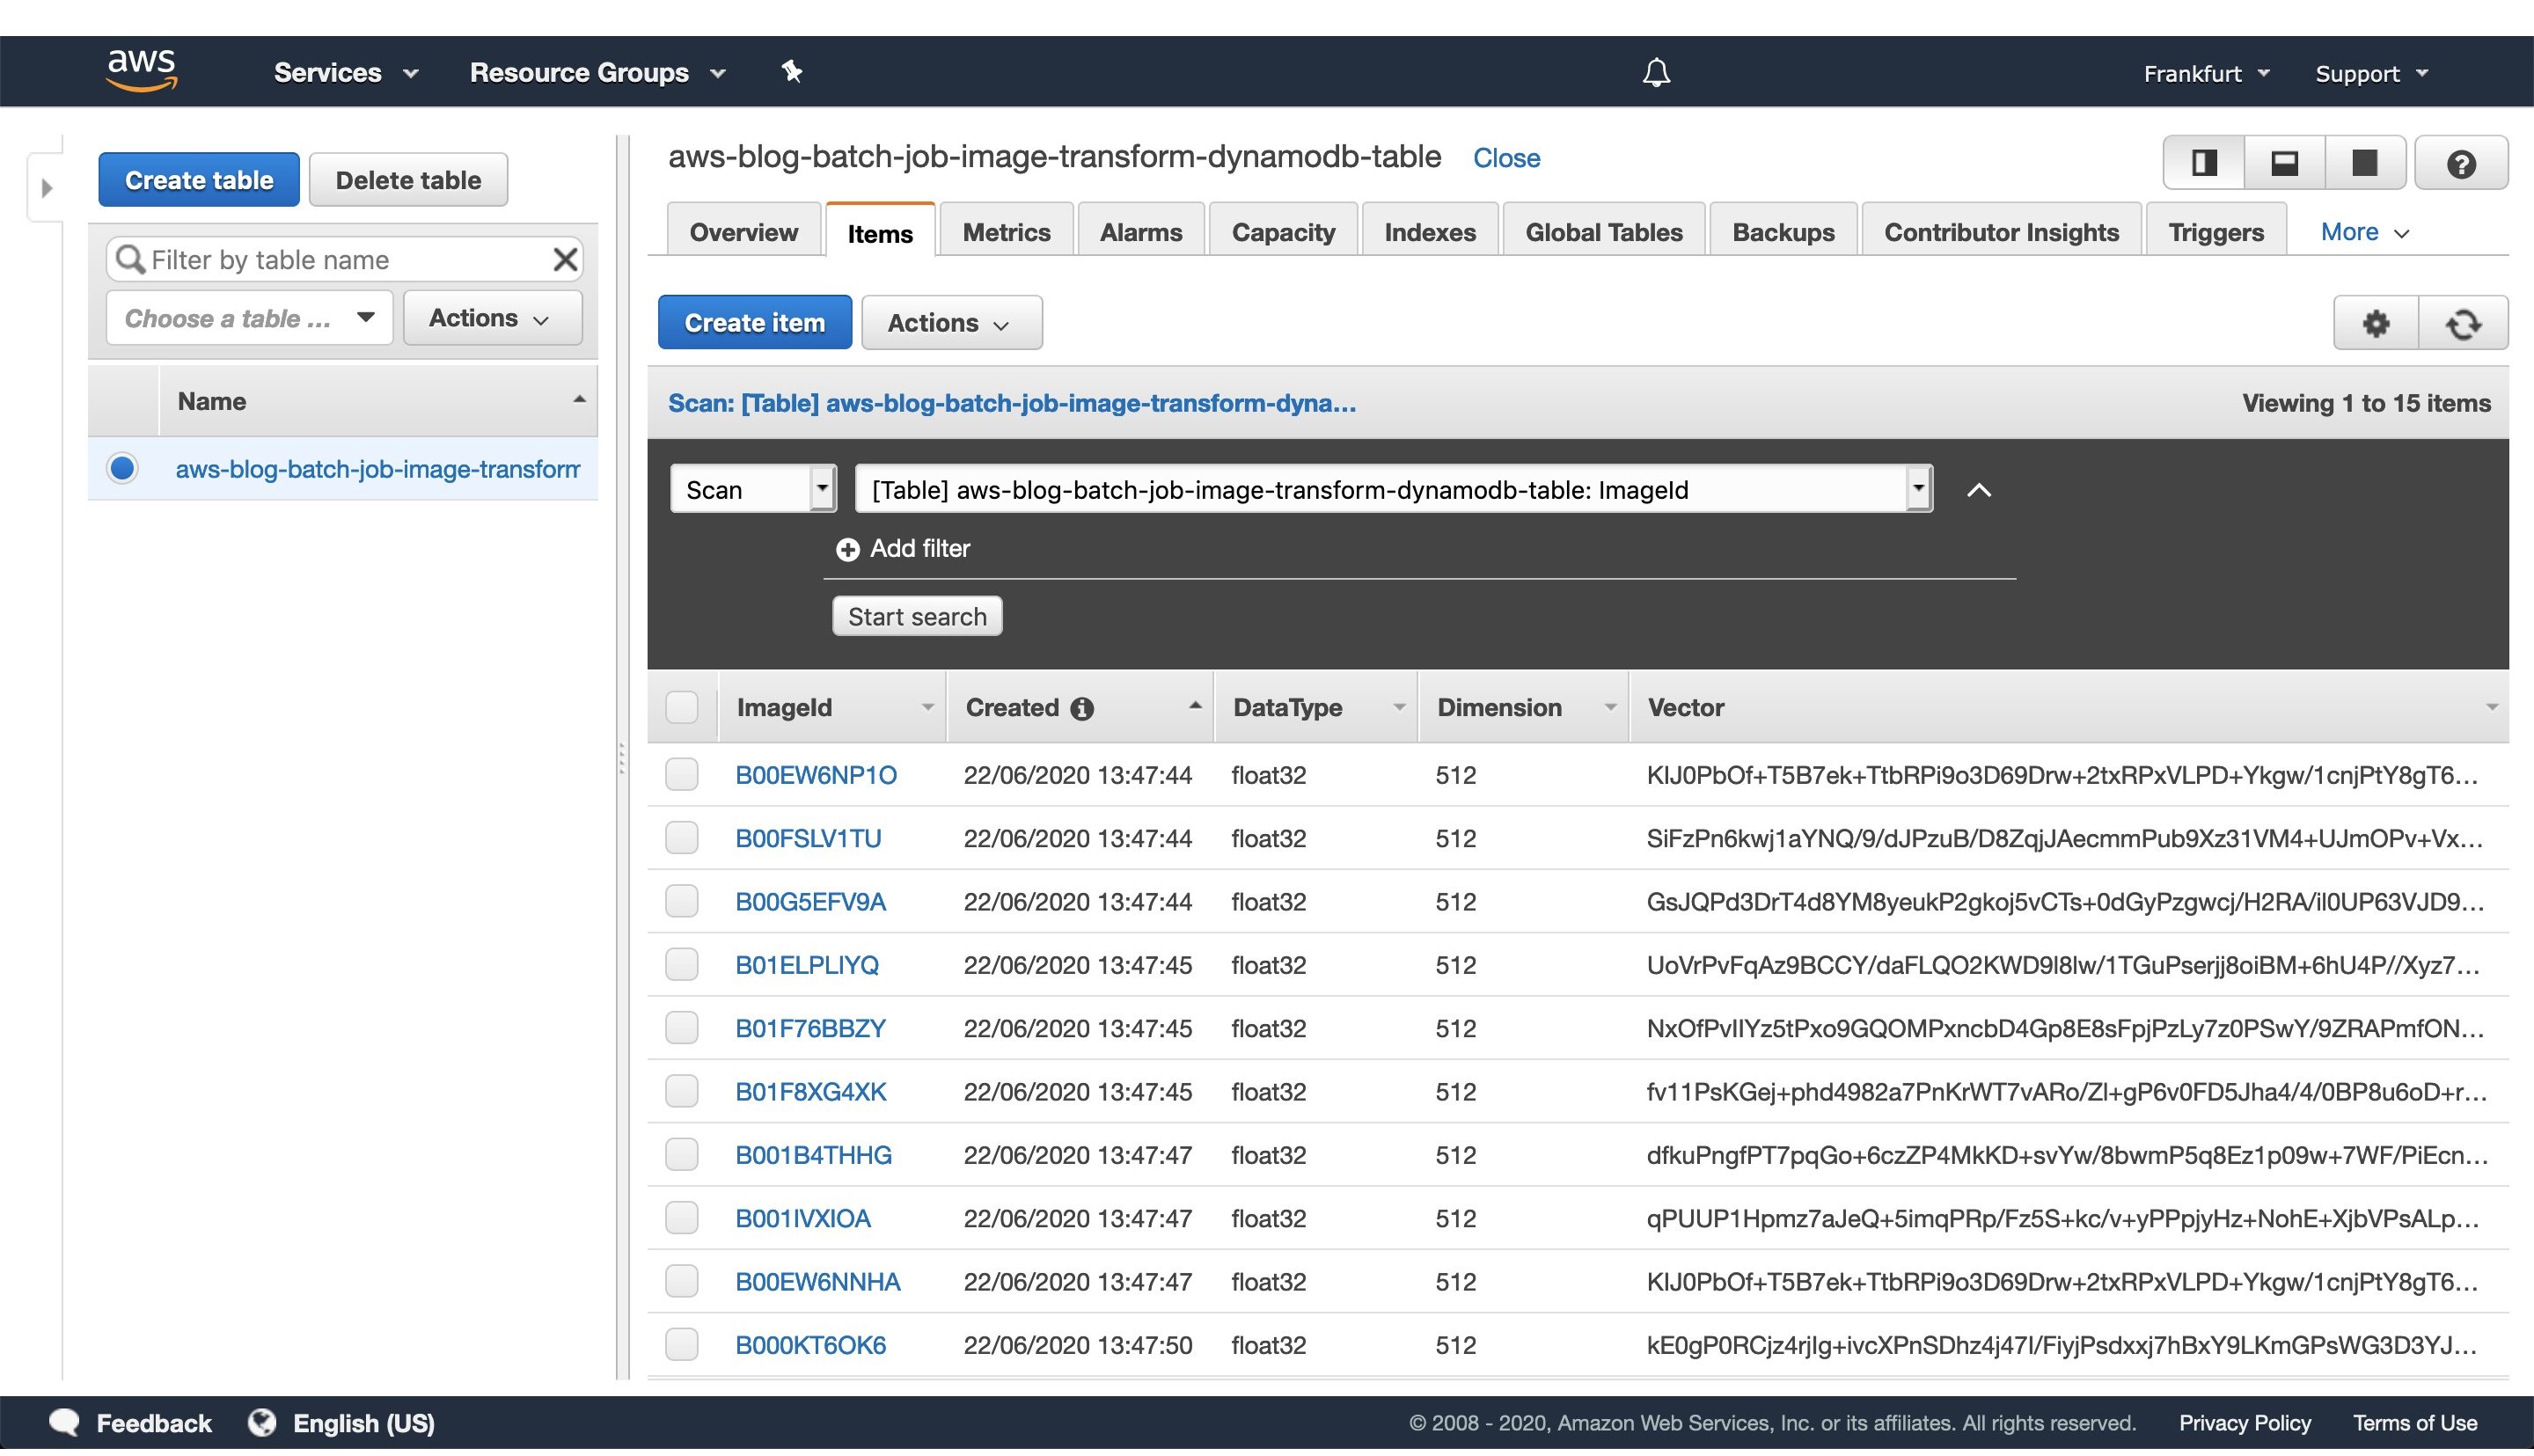
Figure 5: Image vectorization results stored for each image as a entry in the DynamoDB table.
Once every batch job is successfully finished, go to the DynamoDB AWS cloud console and see the feature vectors stored as strings obtained from the numpy tostring method, as well as other data we stored in the table.
When you are ready to access the vectors in one of your projects, utilize the code snippet provided here:
#!/usr/bin/env python3
import numpy as np
import boto3
def vector_from(item):
'''
Parameters
----------
item : DynamoDB response item object
'''
vector = np.frombuffer(item['Vector'].value, dtype=item['DataType'])
assert len(vector) == item['Dimension']
return vector
def vectors_from_dydb(dynamodb, table_name, image_ids):
'''
Parameters
----------
dynamodb : DynamoDB client
table_name : Name of the DynamoDB table
image_ids : List of id's to query the DynamoDB table for
'''
response = dynamodb.batch_get_item(
RequestItems={table_name: {'Keys': [{'ImageId': val} for val in image_ids]}},
ReturnConsumedCapacity='TOTAL'
)
query_vectors =  [vector_from(item) for item in response['Responses'][table_name]]
query_image_ids =  [item['ImageId'] for item in response['Responses'][table_name]]
return zip(query_vectors, query_image_ids)
def process_entry(vector, image_id):
'''
NOTE - Add your code here.
'''
pass
def main():
'''
Reads vectors from the batch job DynamoDB table containing the vectorization results.
'''
dynamodb = boto3.resource('dynamodb', region_name='eu-central-1')
table_name = 'aws-blog-batch-job-image-transform-dynamodb-table'
image_ids = ['B000KT6OK6', 'B000KTC6X0', 'B000KTC6XK', 'B001B4THHG']
for vector, image_id in vectors_from_dydb(dynamodb, table_name, image_ids):
process_entry(vector, image_id)
if __name__ == "__main__":
main()
This code snippet will utilize the boto3 client to access the results stored in the DynamoDB table. Make sure to update the code variables, as well as to modify this implementation to one that fits your use-case.
5. Tear down the infrastructure using CDK
To finish off the exercise, we will tear down the infrastructure that we have provisioned. Since we are using CDK, this is very simple — go to the project root directory and run:
cdk destroy
After a confirmation prompt, the infrastructure tear-down should be underway. If you want to follow the process in more detail, then go to the CloudFormation console view and monitor the process from there.
NOTE: The S3 Bucket, ECR image, and DynamoDB table resource will not be deleted, since the current CDK code defaults to RETAIN behavior in order to prevent the deletion of data we stored there. Once you are sure that you don’t need them, remove those remaining resources manually or modify the CDK code for desired behavior.
Conclusion
In this post we solved an embarrassingly parallel job of creating vector embeddings from images using AWS batch. We provisioned the infrastructure using Python CDK, uploaded sample images, submitted AWS batch job for execution, read the results from the DynamoDB table, and, finally, destroyed the AWS cloud resources we’ve provisioned at the beginning.
AWS Batch serves as a good compute environment for various jobs. For this one in particular, we can scale the processing to more compute resources with minimal or no modifications to our deep learning models and supporting code. On the other hand, it lets us potentially reduce costs by utilizing smaller compute resources and longer execution times.
The code serves as a good point for beginning to experiment more with AWS batch in a Deep Leaning/Machine Learning setup. You could extend it to utilize EC2 instances with GPUs instead of CPUs, utilize Spot instances instead of on-demand ones, utilize AWS Step Functions to automate process orchestration, utilize Amazon SQS as a mechanism to distribute the workload, as well as move the lambda job submission to another compute resource, or pretty much tailor your project for anything else you might need AWS Batch to do.
And that brings us to the conclusion of this post. Thanks for reading, and feel free to leave a comment below if you have any questions. Also, if you enjoyed reading this post, make sure to share it with your friends and colleagues!
Anomaly Detection in AWS Lambda using Amazon DevOps Guru’s ML-powered insights
=======================
Critical business applications are monitored in order to prevent anomalies from negatively impacting their operational performance and availability. Amazon DevOps Guru is a Machine Learning (ML) powered solution that aids operations by detecting anomalous behavior and providing insights and recommendations for how to address the root cause before it impacts the customer.
This post demonstrates how Amazon DevOps Guru can detect an anomaly following a critical AWS Lambda function deployment and its remediation recommendations to fix such behavior.
Solution Overview
Amazon DevOps Guru lets you monitor resources at the region or AWS CloudFormation level. This post will demonstrate how to deploy an AWS Serverless Application Model (AWS SAM) stack, and then enable Amazon DevOps Guru to monitor the stack.
You will utilize the following services:
AWS Lambda
Amazon EventBridge
Amazon DevOps Guru

Figure 1: Amazon DevOps Guru monitoring the resources in an AWS SAM stack
The architecture diagram shows an AWS SAM stack containing AWS Lambda and Amazon EventBridge resources, as well as Amazon DevOps Guru monitoring the resources in the AWS SAM stack.
This post simulates a real-world scenario where an anomaly is introduced in the AWS Lambda function in the form of latency. While the AWS Lambda function execution time is within its timeout threshold, it is not at optimal performance. This anomalous execution time can result in larger compute times and costs. Furthermore, this post demonstrates how Amazon DevOps Guru identifies this anomaly and provides recommendations for remediation.
Here is an overview of the steps that we will conduct:
- First, we will deploy the AWS SAM stack containing a healthy AWS Lambda function with an Amazon EventBridge rule to invoke it on a regular basis.
- We will enable Amazon DevOps Guru to monitor the stack, which will show the AWS Lambda function as healthy.
- After waiting for a period of time, we will make changes to the AWS Lambda function in order to introduce an anomaly and redeploy the AWS SAM stack. This anomaly will be identified by Amazon DevOps Guru, which will mark the AWS Lambda function as unhealthy, provide insights into the anomaly, and provide remediation recommendations.
- After making the changes recommended by Amazon DevOps Guru, we will redeploy the stack and observe Amazon DevOps Guru marking the AWS Lambda function healthy again.
This post also explores utilizing Provisioned Concurrency for AWS Lambda functions and the best practice approach of utilizing Warm Start for variables reuse.
Pricing
Before beginning, note the costs associated with each resource. The AWS Lambda function will incur a fee based on the number of requests and duration, while Amazon EventBridge is free. With Amazon DevOps Guru, you only pay for the data analyzed. There is no upfront cost or commitment. Learn more about the pricing per resource here.
Prerequisites
To complete this post, you need the following prerequisites:
An AWS account. For this post, we utilize the account number 111111111111. We will conduct AWS Serverless Application Model (AWS SAM) stack operations and monitoring in this account.
Access to your local terminal with the AWS SAM command line interface (CLI) installed.
Access to your local terminal with the git CLI.
AWS credentials for enabling the AWS SAM CLI to make calls to AWS Services on your behalf. In this post, AWS SAM needs access to AWS CloudFormation.
An Integrated Development Environment (IDE) of choice installed on your local machine.
Getting Started
We will set up an application stack in our AWS account that contains an AWS Lambda and an Amazon EventBridge event. The event will regularly trigger the AWS Lambda function, which simulates a high-traffic application. To get started, please follow the instructions below:
- In your local terminal, clone the
amazon-devopsguru-samples repository.
git clone https://github.com/aws-samples/amazon-devopsguru-samples.git
- In your IDE of choice, open the
amazon-devopsguru-samples repository.
- In your terminal, change directories into the repository’s subfolder
amazon-devopsguru-samples/generate-lambda-devopsguru-insights.
cd amazon-devopsguru-samples/generate-lambda-devopsguru-insights
- Utilize the SAM CLI to conduct a guided deployment of
lambda-template.yaml.
sam deploy --guided --template lambda-template.yaml
Stack Name [sam-app]: DevOpsGuru-Sample-AnomalousLambda-Stack
AWS Region [us-east-1]: us-east-1
#Shows you resources changes to be deployed and require a 'Y' to initiate deploy
Confirm changes before deploy [y/N]: y
#SAM needs permission to be able to create roles to connect to the resources in your template
Allow SAM CLI IAM role creation [Y/n]: y
Save arguments to configuration file [Y/n]: y
SAM configuration file [samconfig.toml]: y
SAM configuration environment [default]: default
You should see a success message in your terminal, such as:
Successfully created/updated stack - DevOpsGuru-Sample-AnomalousLambda-Stack in us-east-1.
Enabling Amazon DevOps Guru
Now that we have deployed our application stack, we can enable Amazon DevOps Guru.
- Log in to your AWS Account.
- Navigate to the Amazon DevOps Guru service page.
- Click “Get started”.
- In the “Amazon DevOps Guru analysis coverage” section, select “Choose later”, then click “Enable”.

Figure 2.1: Amazon DevOps Guru analysis coverage menu
- On the left-hand menu, select “Settings”
- In the “DevOps Guru analysis coverage” section, click on “Manage”.
- Select the “Analyze all AWS resources in the specified CloudFormation stacks in this Region” radio button.
- The stack created in the previous section should appear. Select it, click “Save”, and then “Confirm”.

Figure 2.2: Amazon DevOps Guru analysis coverage resource selection
Before moving on to the next section, we must allow Amazon DevOps Guru to baseline the resources and benchmark the application’s normal behavior. For our serverless stack with two resources, we recommend waiting two hours before carrying out the next steps. When enabled in a production environment, depending upon the number of resources selected for monitoring, it can take up to 24 hours for Amazon DevOps Guru to complete baselining.
Once baselining is complete, the Amazon DevOps Guru dashboard, an overview of the health of your resources, will display the application stack, DevOpsGuru-Sample-AnomalousLambda-Stack, and mark it as healthy, shown below.

Figure 2.3: Amazon DevOps Guru Healthy Dashboard
Enabling SNS
If you would like to set up notifications upon the detection of an anomaly by Amazon DevOps Guru, then please follow these additional instructions.

Figure 3: Amazon DevOps Guru Specify an SNS topic
Invoking an Anomaly
Once Amazon DevOps Guru has identified the stack as healthy, we will update the AWS Lambda function with suboptimal code. This update will simulate an update to critical business applications which are causing the anomalous performance.
- Open the
amazon-devopsguru-samples repository in your IDE.
- Open the file
generate-lambda-devopsguru-insights/lambda-code.py
- Uncomment lines 7-8 and save the file. These lines of code will produce an anomaly due to the function’s increased runtime.
- Deploy these updates to your stack by running:
cd generate-lambda-devopsguru-insights
sam deploy --template lambda-template.yaml -stack-name DevOpsGuru-Sample-AnomalousLambda-Stack
Anomaly Overview
Shortly after, Amazon DevOps Guru will generate a reactive insight from the sample stack. This insight contains recommendations, metrics, and events related to anomalous behavior. View the unhealthy stack status in the Dashboard.

Figure 4.1: Amazon DevOps Guru Unhealthy Dashboard
By clicking on the “Ongoing reactive insight” within the tile, you will be brought to the Insight Details page. This page contains an array of useful information to help you understand and address anomalous behavior.
Insight overview
Utilize this section to get a high-level overview of the insight. You can see that the status of the insight is ongoing, 1 AWS CloudFormation stack is affected, the insight started on Sept-08-2021, it does not have an end time, and it was last updated on Sept-08-2021.

Figure 4.2: Amazon DevOps Guru Ongoing Reactive Insight Overview
Aggregated metrics
The Aggregated metrics tab displays metrics related to the insight. The table is grouped by AWS CloudFormation stacks and subsequent resources that created the metrics. In this example, the insight was a product of an anomaly in the “duration p50” metric generated by the “DevOpsGuruSample-AnomalousLambda” AWS Lambda function.
AWS Lambda duration metrics derive from a percentile statistic utilized to exclude outlier values that skew average and maximum statistics. The P50 statistic is typically a great middle estimate. It is defined as 50% of estimates exceed the P50 estimate and 50% of estimates are less than the P50 estimate.
The red lines on the timeline indicate spans of time when the “duration p50” metric emitted unusual values. Click the red line in the timeline in order to view detailed information.
Choose View in CloudWatch to see how the metric looks in the CloudWatch console. For more information, see Statistics and Dimensions in the Amazon CloudWatch User Guide.
Hover over the graph in order to view details about the anomalous metric data and when it occurred.
Choose the box with the downward arrow to download a PNG image of the graph.

Figure 4.3: Amazon DevOps Guru Ongoing Reactive Insight Aggregated Metrics
Graphed anomalies
The Graphed anomalies tab displays detailed graphs for each of the insight’s anomalies. Because our insight was comprised of a single anomaly, there is one tile with details about unusual behavior detected in related metrics.
Choose View all statistics and dimensions in order to see details about the anomaly. In the window that opens, you can:
Choose View in CloudWatch in order to see how the metric looks in the CloudWatch console.
Hover over the graph to view details about the anomalous metric data and when it occurred.
Choose Statistics or Dimension in order to customize the graph’s display. For more information, see Statistics and Dimensions in the Amazon CloudWatch User Guide.

Figure 4.4: Amazon DevOps Guru Ongoing Reactive Insight Graphed Anomaly
Related events
In Related events, view AWS CloudTrail events related to your insight. These events help understand, diagnose, and address the underlying cause of the anomalous behavior. In this example, the events are:
- CreateFunction – when we created and deployed the AWS SAM template containing our AWS Lambda function.
- CreateChangeSet – when we pushed updates to our stack via the AWS SAM CLI.
- UpdateFunctionCode – when the AWS Lambda function code was updated.

Figure 4.5: Amazon DevOps Guru Ongoing Reactive Insight Related Events
Recommendations
The final section in the Insight Detail page is Recommendations. You can view suggestions that might help you resolve the underlying problem. When Amazon DevOps Guru detects anomalous behavior, it attempts to create recommendations. An insight might contain one, multiple, or zero recommendations.
In this example, the Amazon DevOps Guru recommendation matches the best resolution to our problem-provisioned concurrency.

Figure 4.6: Amazon DevOps Guru Ongoing Reactive Insight Recommendations
Understanding what happened
Amazon DevOps Guru recommends enabling Provisioned Concurrency for the AWS Lambda functions in order to help it scale better when responding to concurrent requests. As mentioned earlier, Provisioned Concurrency keeps functions initialized by creating the requested number of execution environments so that they can respond to invocations. This is a suggested best practice when building high-traffic applications, such as the one that this sample is mimicking.
In the anomalous AWS Lambda function, we have sample code that is causing delays. This is analogous to application initialization logic within the handler function. It is a best practice for this logic to live outside of the handler function. Because we are mimicking a high-traffic application, the expectation is to receive a large number of concurrent requests. Therefore, it may be advisable to turn on Provisioned Concurrency for the AWS Lambda function. For Provisioned Concurrency pricing, refer to the AWS Lambda Pricing page.
Resolving the Anomaly
To resolve the sample application’s anomaly, we will update the AWS Lambda function code and enable provisioned concurrency for the AWS Lambda infrastructure.
- Opening the sample repository in your IDE.
- Open the file
generate-lambda-devopsguru-insights/lambda-code.py.
- Move lines 7-8, the code forcing the AWS Lambda function to respond slowly, above the
lambda_handler function definition.
- Save the file.
- Open the file
generate-lambda-devopsguru-insights/lambda-template.yaml.
- Uncomment lines 15-17, the code enabling provisioned concurrency in the sample AWS Lambda function.
- Save the file.
- Deploy these updates to your stack.
cd generate-lambda-devopsguru-insights
sam deploy --template lambda-template.yaml --stack-name DevOpsGuru-Sample-AnomalousLambda-Stack
After completing these steps, the duration P50 metric will emit more typical results, thereby causing Amazon DevOps Guru to recognize the anomaly as fixed, and then close the reactive insight as shown below.

Figure 5: Amazon DevOps Guru Closed Reactive Insight
Clean Up
When you are finished walking through this post, you will have multiple test resources in your AWS account that should be cleaned up or un-provisioned in order to avoid incurring any further charges.
- Opening the sample repository in your IDE.
- Run the below AWS SAM CLI command to delete the sample stack.
cd generate-lambda-devopsguru-insights
sam delete --stack-name DevOpsGuru-Sample-AnomalousLambda-Stack
Conclusion
As seen in the example above, Amazon DevOps Guru can detect anomalous behavior in an AWS Lambda function, tie it to relevant events that introduced that anomaly, and provide recommendations for remediation by using its pre-trained ML models. All of this was possible by simply enabling Amazon DevOps Guru to monitor the resources with minimal configuration changes and no previous ML expertise. Start using Amazon DevOps Guru today.
Generating DevOps Guru Proactive Insights for Amazon ECS
=======================
Monitoring is fundamental to operating an application in production, since we can only operate what we can measure and alert on. As an application evolves, or the environment grows more complex, it becomes increasingly challenging to maintain monitoring thresholds for each component, and to validate that they’re still set to an effective value. We not only want monitoring alarms to trigger when needed, but also want to minimize false positives.
Amazon DevOps Guru is an AWS service that helps you effectively monitor your application by ingesting vended metrics from Amazon CloudWatch. It learns your application’s behavior over time and then detects anomalies. Based on these anomalies, it generates insights by first combining the detected anomalies with suspected related events from AWS CloudTrail, and then providing the information to you in a simple, ready-to-use dashboard when you start investigating potential issues. Amazon DevOpsGuru makes use of the CloudWatch Containers Insights to detect issues around resource exhaustion for Amazon ECS or Amazon EKS applications. This helps in proactively detecting issues like memory leaks in your applications before they impact your users, and also provides guidance as to what the probable root-causes and resolutions might be.
This post will demonstrate how to simulate a memory leak in a container running in Amazon ECS, and have it generate a proactive insight in Amazon DevOps Guru.
Solution Overview
The following diagram shows the environment we’ll use for our scenario. The container “brickwall-maker” is preconfigured as to how quickly to allocate memory, and we have built this container image and published it to our public Amazon ECR repository. Optionally, you can build and host the docker image in your own private repository as described in step 2 & 3.
After creating the container image, we’ll utilize an AWS CloudFormation template to create an ECS Cluster and an ECS Service called “Test” with a desired count of two. This will create two tasks using our “brickwall-maker” container image. The stack will also enable Container Insights for the ECS Cluster. Then, we will enable resource coverage for this CloudFormation stack in Amazon DevOpsGuru in order to start our resource analysis.

Source provided on GitHub:
DevOpsGuru.yaml
EnableDevOpsGuruForCfnStack.yaml
Docker container source
Steps:
1. Create your IDE environment
In the AWS Cloud9 console, click Create environment, give your environment a Name, and click Next step. On the Environment settings page, change the instance type to t3.small, and click Next step. On the Review page, make sure that the Name and Instance type are set as intended, and click Create environment. The environment creation will take a few minutes. After that, the AWS Cloud9 IDE will open, and you can continue working in the terminal tab displayed in the bottom pane of the IDE.
Install the following prerequisite packages, and ensure that you have docker installed:
sudo yum install -y docker
sudo service docker start
docker --version
Clone the git repository in order to download the required CloudFormation templates and code:
git clone https://github.com/aws-samples/amazon-devopsguru-brickwall-maker
Change to the directory that contains the cloned repository
cd amazon-devopsguru-brickwall-maker
2. Optional : Create ECR private repository
If you want to build your own container image and host it in your own private ECR repository, create a new repository with the following command and then follow the steps to prepare your own image:
aws ecr create-repository —repository-name brickwall-maker
3. Optional: Prepare Docker Image
Authenticate to Amazon Elastic Container Registry (ECR) in the target region
aws ecr get-login-password --region ap-northeast-1 | \
docker login --username AWS --password-stdin \
123456789012.dkr.ecr.ap-northeast-1.amazonaws.com
In the above command, as well as in the following shown below, make sure that you replace 123456789012 with your own account ID.
Build brickwall-maker Docker container:
docker build -t brickwall-maker .
Tag the Docker container to prepare it to be pushed to ECR:
docker tag brickwall-maker:latest 123456789012.dkr.ecr.ap-northeast-1.amazonaws.com/brickwall-maker:latest
Push the built Docker container to ECR
docker push 123456789012.dkr.ecr.ap-northeast-1.amazonaws.com/brickwall-maker:latest
4. Launch the CloudFormation template to deploy your ECS infrastructure
To deploy your ECS infrastructure, run the following command (replace your own private ECR URL or use our public URL) in the ParameterValue) to launch the CloudFormation template :
aws cloudformation create-stack --stack-name myECS-Stack \
--template-body file://DevOpsGuru.yaml \
--capabilities CAPABILITY_IAM CAPABILITY_NAMED_IAM \
--parameters ParameterKey=ImageUrl,ParameterValue=public.ecr.aws/p8v8e7e5/myartifacts:brickwallv1
5. Enable DevOps Guru to monitor the ECS Application
Run the following command to enable DevOps Guru for monitoring your ECS application:
aws cloudformation create-stack \
--stack-name EnableDevOpsGuruForCfnStack \
--template-body file://EnableDevOpsGuruForCfnStack.yaml \
--parameters ParameterKey=CfnStackNames,ParameterValue=myECS-Stack
6. Wait for base-lining of resources
This step lets DevOps Guru complete the baselining of the resources and benchmark the normal behavior. For this particular scenario, we recommend waiting two days before any insights are triggered.
Unlike other monitoring tools, the DevOps Guru dashboard would not present any counters or graphs. In the meantime, you can utilize CloudWatch Container Insights to monitor the cluster-level, task-level, and service-level metrics in ECS.
7. View Container Insights metrics
Open the CloudWatch console.
In the navigation pane, choose Container Insights.
Use the drop-down boxes near the top to select ECS Services as the resource type to view, then select DevOps Guru as the resource to monitor.
The performance monitoring view will show you graphs for several metrics, including “Memory Utilization”, which you can watch increasing from here. In addition, it will show the list of tasks in the lower “Task performance” pane showing the “Avg CPU” and “Avg memory” metrics for the individual tasks.
8. Review DevOps Guru insights
When DevOps Guru detects an anomaly, it generates a proactive insight with the relevant information needed to investigate the anomaly, and it will list it in the DevOps Guru Dashboard.
You can view the insights by clicking on the number of insights displayed in the dashboard. In our case, we expect insights to be shown in the “proactive insights” category on the dashboard.
Once you have opened the insight, you will see that the insight view is divided into the following sections:
Insight Overview with a basic description of the anomaly. In this case, stating that Memory Utilization is approaching limit with details of the stack that is being affected by the anomaly.
Anomalous metrics consisting of related graphs and a timeline of the predicted impact time in the future.
Relevant events with contextual information, such as changes or updates made to the CloudFormation stack’s resources in the region.
Recommendations to mitigate the issue. As seen in the following screenshot, it recommends troubleshooting High CPU or Memory Utilization in ECS along with a link to the necessary documentation.
The following screenshot illustrates an example insight detail page from DevOps Guru

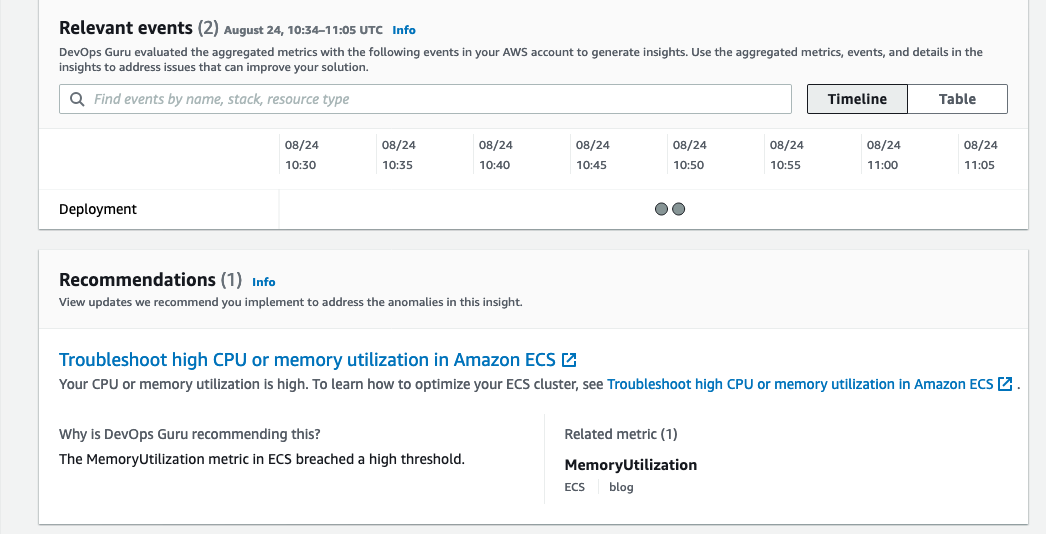
Conclusion
This post describes how DevOps Guru continuously monitors resources in a particular region in your AWS account, as well as proactively helps identify problems around resource exhaustion such as running out of memory, in advance. This helps IT operators take preventative actions even before a problem presents itself, thereby preventing downtime.
Cleaning up
After walking through this post, you should clean up and un-provision the resources in order to avoid incurring any further charges.
- To un-provision the CloudFormation stacks, on the AWS CloudFormation console, choose Stacks. Select the stack name, and choose Delete.
- Delete the AWS Cloud9 environment.
- Delete the ECR repository.
Parallel and dynamic SaaS deployments with AWS CDK Pipelines
=======================
Software as a Service (SaaS) is an increasingly popular business model for independent software vendors (ISVs), including benefits such as a pay-as-you-go pricing model, scalability, and availability.
SaaS services can be built by using numerous architectural models. The silo model provides each tenant with dedicated resources and a shared-nothing architecture. Silo deployments also provide isolation between tenants’ compute resources and their data, and they help eliminate the noisy-neighbor problem. On the other hand, the pool model offers several benefits, such as lower maintenance overhead, simplified management and operations, and cost-saving opportunities, all due to a more efficient utilization of computing resources and capacity. In the bridge model, both silo and pool models are utilized side-by-side. The bridge model is a hybrid model, where parts of the system can be in a silo model, and parts in a pool.
End-customers benefit from SaaS delivery in numerous ways. For example, the service can be available from multiple locations, letting the customer choose what is best for them. The tenant onboarding process is often real-time and frictionless. To realize these benefits for their end-customers, SaaS providers need methods for reliable, fast, and multi-region capable provisioning and software lifecycle management.
This post will describe a deployment system for automating the provision and lifecycle management of workload components in pool or silo deployment models by using AWS Cloud Development Kit (AWS CDK) and CDK Pipelines. We will explore the system’s dynamic and database driven deployment model, as well as its multi-account and multi-region capabilities, and we will provision demo deployments of workload components in both the silo and pool models.
AWS Cloud Development Kit and CDK Pipelines
For this solution, we utilized AWS Cloud Development Kit (AWS CDK) and its CDK Pipelines construct library. AWS CDK is an open-source software development framework for modeling and provisioning cloud application resources by using familiar programming languages. AWS CDK lets you define your infrastructure as code and provision it through AWS CloudFormation.
CDK Pipelines is a high-level construct library with an opinionated implementation of a continuous deployment pipeline for your CDK applications. It is powered by AWS CodePipeline, a fully managed continuous delivery service that helps automate your release pipelines for fast and reliable application as well as infrastructure updates. No servers need to be provisioned or setup, and you only pay for what you use. This solution utilizes the recently released and stable CDK Pipelines modern API.
Business Scenario
As a baseline use case, we have selected the consideration of a fictitious ISV called Unicorn that wants to implement an SaaS business model.
Unicorn operates in several countries, and requires the storing of customer data within the customers’ chosen region. Currently, Unicorn needs two regions in order to satisfy its main customer base: one in EU and one in US. Unicorn expects rapid growth, and it needs a solution that can scale to thousands of tenants. Unicorn plans to have different tenant tiers with different isolation requirements. Their planned deployment model has the majority of tenants in shared pool instances, but they also plan to support dedicated silo instances for the tenants requiring it. The solution must also be easily extendable to new Regions as Unicorn’s business expands.
Unicorn is starting small with just a single development team responsible for currently the only component in their SaaS workload architecture. Following industry best practices, Unicorn has designed its workload architecture so that each component has a clear technical ownership boundary. The chosen solution must grow together with Unicorn, and support multiple independently developed and deployed components in the future.
Solution Overview
Today, many customers utilize AWS CodePipeline to build, test, and deploy their cloud applications. For an SaaS provider such as Unicorn, considering utilizing a single pipeline for managing every deployment presented concerns. At the scale that Unicorn requires, a single pipeline with potentially hundreds of actions runs the risk of becoming throughput limited. Moreover, a single pipeline would offer Unicorn limited control over how changes are released.
Our solution addresses this problem by having a separate dynamically provisioned pipeline for each pool and silo deployment. The solution is designed to manage multiple deployments of Unicorn’s single workload component, thereby aligning with their current needs — and with small changes, including future needs.
CDK Best Practices state that an AWS CDK application maps to a component as defined by the AWS Well-Architected Framework. A component is the code, configuration, and AWS Resources that together deliver against a workload requirement. And this is typically the unit of technical ownership. A component usually includes logical units (e.g., api, database), and can have a continuous deployment pipeline.
Utilizing CDK Pipelines provides a significant benefit: with no additional code, we can deploy cross-account and cross-region just as easily as we would to a single account and region. CDK Pipelines automatically creates and manages the required cross-account encryption keys and cross-region replication buckets. Furthermore, we only need to establish a trust relationship between the accounts during the CDK bootstrapping process.
The following diagram illustrates the solution architecture:

Figure 1: Solution architecture
Let’s look closer at the two primary high level solution flows: silo and pool pipeline provisioning (1 and 2), and component code deployment (3 and 4).
Provisioning is separated into a dedicated flow, so that code deployments do not interfere with tenant onboarding, and vice versa. At the heart of the provisioning flow is the deployment database (1), which is implemented by using an Amazon DynamoDB table.
Utilizing DynamoDB Streams and AWS Lambda Triggers, a new AWS CodeBuild provisioning project build (2) is automatically started after a record is inserted into the deployment database. The provisioning project directly provisions new silo and pool pipelines by using the “cdk deploy” command. Provisioning events are processed in parallel, so that the solution can handle possible bursts in Unicorn’s tenant onboarding volumes.
CDK best practices suggest that infrastructure and runtime code live in the same package. A single AWS CodeCommit repository (3) contains everything needed: the CI/CD pipeline definitions as well as the workload component code. This repository is the source artifact for every CodePipeline pipeline and CodeBuild project. The chapter “Managing application resources as code” describes related implementation details.
The CI/CD pipeline (4) is a CDK Pipelines pipeline, and it is responsible for the component’s Software Development Life Cycle (SDLC) activities. In addition to implementing the update release process, it is expected that most SaaS providers will also implement additional activities. This includes a variety of tests and pre-production environment deployments. The chapter “Controlling deployment updates” dives deeper into this topic.
Deployments have two parts: The pipeline (5) and the component resource stack(s) (6) that it manages. The pipelines are deployed to the central toolchain account and region, whereas the component resources are deployed to the AWS Account and Region, as specified in the deployments’ record in the deployment database.
Sample code for the solution is available in GitHub. The sample code is intended for utilization in conjunction with this post. Our solution is implemented in TypeScript.
Deployment Database
Our deployment database is an Amazon DynamoDB table, with the following structure:

Figure 2: DynamoDB table
‘id’ is a unique identifier for each deployment.
‘account’ is the AWS account ID for the component resources.
‘region’ is the AWS region ID for the component resources.
‘type’ is either ‘silo’ or ‘pool’, which defines the deployment model.
This design supports tenant deployment to multiple silo and pool deployments. Each of these can target any available and bootstrapped AWS Account and Region. For example, different pools can support tenants in different regions, with select tenants deployed to dedicated silos. As pools may be limited to how many tenants they can serve, the design also supports having multiple pools within a region, and it can easily be extended with an additional attribute to support the tiers concept.
Note that the deployment database does not contain tenant information. It is expected that such mapping is maintained in a separate tenant database, where each tenant record can map to the ID of the deployment that it is associated with.
Now that we have looked at our solution design and architecture, let’s move to the hands-on section, starting with the deployment requirements for the solution.
Prerequisites
The following tools are required to deploy the solution:
NodeJS version compatible with AWS CDK version 1.124.0
The AWS Command Line Interface (AWS CLI)
Git with git-remote-codecommit extension
To follow this tutorial completely, you should have administrator access to at least one, but preferably two AWS accounts:
Toolchain: Account for the SDLC toolchain: the pipelines, the provisioning project, the repository, and the deployment database.
Workload (optional): Account for the component resources.
If you have only a single account, then the toolchain account can be used for both purposes. Credentials for the account(s) are assumed to be configured in AWS CLI profile(s).
The instructions in this post use the following placeholders, which you must replace with your specific values:
<TOOLCHAIN_ACCOUNT_ID>: The AWS Account ID for the toolchain account
<TOOLCHAIN_PROFILE_NAME>: The AWS CLI profile name for the toolchain account credentials
<WORKLOAD_ACCOUNT_ID>: The AWS Account ID for the workload account
<WORKLOAD_PROFILE_NAME>: The AWS CLI profile name for the workload account credentials
Bootstrapping
The toolchain account, and all workload account(s), must be bootstrapped prior to first-time deployment.
AWS CDK and our solutions’ dependencies must be installed to start with. The easiest way to do this is to install them locally with npm. First, we need to download our sample code, so that the we have the package.json configuration file available for npm.
Note that throughout these instructions, many commands are broken over multiple lines for readability. Take care to execute the commands completely. It is always safe to execute each code block as a whole.
Clone the sample code repository from GitHub, and then install the dependencies by using npm:
git clone https://github.com/aws-samples/aws-saas-parallel-deployments
cd aws-saas-parallel-deployments
npm ci
CDK Pipelines requires use of modern bootstrapping. To ensure that this is enabled, start by setting the related environment variable:
export CDK_NEW_BOOTSTRAP=1
Then, bootstrap the toolchain account. You must bootstrap both the region where the toolchain stack is deployed, as well as every target region for component resources. Here, we will first bootstrap only the us-east-1 region, and later you can optionally bootstrap additional region(s).
To bootstrap, we use npx to execute the locally installed version of AWS CDK:
npx cdk bootstrap <TOOLCHAIN_ACCOUNT_ID>/us-east-1 --profile <TOOLCHAIN_PROFILE_NAME>
If you have a workload account that is separate from the toolchain account, then that account must also be bootstrapped. When bootstrapping the workload account, we will establish a trust relationship with the toolchain account. Skip this step if you don’t have a separate workload account.
The workload account boostrappings follows the security best practice of least privilege. First create an execution policy with the minimum permissions required to deploy our demo component resources. We provide a sample policy file in the solution repository for this purpose. Then, use that policy as the execution policy for the trust relationship between the toolchain account and the workload account
aws iam create-policy \
--profile <WORKLOAD_PROFILE_NAME> \
--policy-name CDK-Exec-Policy \
--policy-document file://policies/workload-cdk-exec-policy.json
npx cdk bootstrap <WORKLOAD_ACCOUNT_ID>/us-east-1 \
--profile <WORKLOAD_PROFILE_NAME> \
--trust <TOOLCHAIN_ACCOUNT_ID> \
--cloudformation-execution-policies arn:aws:iam::<WORKLOAD_ACCOUNT_ID>:policy/CDK-Exec-Policy
Toolchain deployment
Prior to being able to deploy for the first time, you must create an AWS CodeCommit repository for the solution. Create this repository in the toolchain account:
aws codecommit create-repository \
--profile <TOOLCHAIN_PROFILE_NAME> \
--region us-east-1 \
--repository-name unicorn-repository
Next, you must push the contents to the CodeCommit repository. For this, use the git command together with the git-remote-codecommit extension in order to authenticate to the repository with your AWS CLI credentials. Our pipelines are configured to use the main branch.
git remote add unicorn codecommit::us-east-1://<TOOLCHAIN_PROFILE_NAME>@unicorn-repository
git push unicorn main
Now we are ready to deploy the toolchain stack:
export AWS_REGION=us-east-1
npx cdk deploy --profile <TOOLCHAIN_PROFILE_NAME>
Workload deployments
At this point, our CI/CD pipeline, provisioning project, and deployment database have been created. The database is initially empty.
Note that the DynamoDB command line interface demonstrated below is not intended to be the SaaS providers provisioning interface for production use. SaaS providers typically have online registration portals, wherein the customer signs up for the service. When new deployments are needed, then a record should automatically be inserted into the solution’s deployment database.
To demonstrate the solution’s capabilities, first we will provision two deployments, with an optional third cross-region deployment:
- A silo deployment (silo1) in the us-east-1 region.
- A pool deployment (pool1) in the us-east-1 region.
- A pool deployment (pool2) in the eu-west-1 region (optional).
To start, configure the AWS CLI environment variables:
export AWS_REGION=us-east-1
export AWS_PROFILE=<TOOLCHAIN_PROFILE_NAME>
Add the deployment database records for the first two deployments:
aws dynamodb put-item \
--table-name unicorn-deployments \
--item '{
"id": {"S":"silo1"},
"type": {"S":"silo"},
"account": {"S":"<WORKLOAD_ACCOUNT_ID>"},
"region": {"S":"us-east-1"}
}'
aws dynamodb put-item \
--table-name unicorn-deployments \
--item '{
"id": {"S":"pool1"},
"type": {"S":"pool"},
"account": {"S":"<WORKLOAD_ACCOUNT_ID>"},
"region": {"S":"us-east-1"}
}'
This will trigger two parallel builds of the provisioning CodeBuild project. Use the CodeBuild Console in order to observe the status and progress of each build.
Cross-region deployment (optional)
Optionally, also try a cross-region deployment. Skip this part if a cross-region deployment is not relevant for your use case.
First, you must bootstrap the target region in the toolchain and the workload accounts. Bootstrapping of eu-west-1 here is identical to the bootstrapping of the us-east-1 region earlier. First bootstrap the toolchain account:
npx cdk bootstrap <TOOLCHAIN_ACCOUNT_ID>/eu-west-1 --profile <TOOLCHAIN_PROFILE_NAME>
If you have a separate workload account, then we must also bootstrap it for the new region. Again, please skip this if you have only a single account:
npx cdk bootstrap <WORKLOAD_ACCOUNT_ID>/eu-west-1 \
--profile <WORKLOAD_PROFILE_NAME> \
--trust <TOOLCHAIN_ACCOUNT_ID> \
--cloudformation-execution-policies arn:aws:iam::<WORKLOAD_ACCOUNT_ID>:policy/CDK-Exec-Policy
Then, add the cross-region deployment:
aws dynamodb put-item \
--table-name unicorn-deployments \
--item '{
"id": {"S":"pool2"},
"type": {"S":"pool"},
"account": {"S":"<WORKLOAD_ACCOUNT_ID>"},
"region": {"S":"eu-west-1"}
}'
Validation of deployments
After the builds have completed, use the CodePipeline console to verify that the deployment pipelines were successfully created in the toolchain account:

Figure 3: CodePipeline console
Similarly, in the workload account, stacks containing your component resources will have been deployed to each configured region for the deployments. In this demo, we are deploying a single “hello world” container application utilizing AWS App Runner as runtime environment. Successful deployment can be verified by using CloudFormation Console:

Figure 4: CloudFormation console
Now that we have successfully finished with our demo deployments, let’s look at how updates to the pipelines and the component resources can be managed.
Managing application resources as code
As highlighted earlier in the Solution Overview, every aspect of our solution shares a single source repository. With all of our code in a single source, we can easily deliver complex changes impacting multiple aspects of our solution. And all of this can be packaged, tested, and released as a single change set. For example, a change can introduce a new stage to the CI/CD pipeline, modify an existing stage in the silo and pool pipelines, and/or make code and resource changes to the component resources.
Managing the pipeline definitions is made simple by the self-mutate capability of the CDK Pipelines. Once initially deployed, each CDK Pipelines pipeline can update its own definition. This is implemented by using a separate SelfMutate stage in the pipeline definition. This stage is executed before any deployment actions, thereby ensuring that the pipeline always executes the latest version that is defined by the source code.
Managing how and when the pipelines trigger to execute also required attention. CDK Pipelines configures pipelines by default to utilize event-based polling of the source repository. While this is a reasonable default, and it is great for the CI/CD pipeline, it is undesired for our silo and pool pipelines. If all of these pipelines would execute automatically on code commits to the source repository, the CI/CD pipeline could not manage the release flow. To address this, we have configured the silo and pool pipelines with the trigger in the CodeCommitSourceOptions to NONE.
Controlling deployment updates
A key aspect of SaaS delivery is controlling how you roll out changes to tenants. Significant business risk can arise if changes are released to all tenants all-at-once in a single big bang.
This risk can be managed by utilizing a combination of silo and pool deployments. Reduce your risk by spreading tenants into multiple pools, and gradually rolling out your changes to these pools. Based on business needs and/or risk assessment, select customers can be provisioned into dedicated silo deployments, thereby allowing update control for those customers separately. Note that while all of a pool’s tenants get the same underlying update simultaneously, you can utilize feature flags to selectively enable new features only for specific tenants in the deployment.
In the demo solution, the CI/CD pipeline contains only a single custom stage “UpdateDeployments”. This CodeBuild action implements a simple “one-at-a-time” strategy. The code has been purposely written so that it is simple and provides you with a starting point to implement your own more complex strategy, as based on your unique business needs. In the default implementation, every silo and pool pipeline tracks the same “main” branch of the repository. Releases are governed by controlling when each pipeline executes to update its resources.
When designing your release strategy, look into how the planned process helps implement releases and changes with high quality and frequency. A typical starting point is a CI/CD pipeline with continuous automated deployments via multiple test and staging environments in order to validate your changes prior to deployment to any production tenants.
Furthermore, consider if utilizing a canary release strategy would help identify potential issues with your changes prior to rolling them out across all deployments in production. In a canary release, each change is first deployed only to a small subset of your deployments. Once you are satisfied with the change quality, then the change can either automatically or manually be released to the rest of your deployments. As an example, an AWS Step Functions state machine could be combined with the solution, and then utilized to control the release flow, execute validation tests, implement approval steps (either manual or automatic), and even conduct rollback if necessary.
Further considerations
The example in this post provisions every silo and pool deployment to a single AWS account. However, the solution is not limited to a single account, and it can deploy equally easily to multiple AWS accounts. When operating at scale, it is best-practice to spread your workloads to several accounts. The Organizing Your AWS Environment using Multiple Accounts whitepaper has in-depth guidance on strategies for spreading your workloads.
If combined with an AWS account-vending machine implementation, such as an AWS Control Tower Landing Zone, then the demo solution could be adapted so that new AWS accounts are provisioned automatically. This would be useful if your business requires full account-level deployment isolation, and you also want automated provisioning.
To meet Unicorn’s future needs for spreading their solution architecture over multiple separate components, the deployment database and associated lambda function could be decoupled from the rest of the toolchain components in order to provide a central deployment service. When provisioned as standalone, and amended with Amazon Simple Notification Service-based notifications sent to the component deployment systems for example, this central deployment service could be utilized for managing the deployments for multiple components.
In addition, you should analyze your deployment lifecycle transitions, and then consider what action should be taken when a tenant is disabled and/or deleted. Implementing a deployment archival/deletion process is not in the scope of this post.
Cleanup
To cleanup every resource deployed in this post, conduct the following actions:
- In the workload account:
- In us-east-1 Region, delete CloudFormation stacks named “pool-pool1-resources” and “silo-silo1-resources” and the CDK bootstrap stack “CDKToolKit”.
- In eu-west-1 Region, delete CloudFormation stack named “pool-pool2-resources” and the CDK Bootstrap stack “CDKToolKit”
- In the toolchain account:
- In us-east-1 Region, delete CloudFormation stacks “toolchain”, “pool-pool1-pipeline”, “pool-pool2-pipeline”, “silo-silo1-pipeline” and the CDK bootstrap stack “CDKToolKit”.
- In eu-west-1 Region, delete CloudFormation stack “pool-pool2-pipeline-support-eu-west-1” and the CDK bootstrap stack “CDKToolKit”
- Cleanup and delete S3 buckets “toolchain-*”, “pool-pool1-pipeline-*”, “pool-pool2-pipeline-*”, and “silo-silo1-pipeline-*”.
Conclusion
This solution demonstrated an implementation of an automated SaaS application component deployment factory. We covered how an ISV venturing into the SaaS model can utilize AWS CDK and CDK Pipelines in order to avoid a multitude of undifferentiated heavy lifting by leveraging and combining AWS CDK’s cross-region and cross-account capabilities with CDK Pipelines’ self-mutating deployment pipelines. Furthermore, we demonstrated how all of this can be written, managed, and released just like any other code you write. We also demonstrated how a single dynamic provisioning system can be utilized to operate in a mixed mode, with both silo and pool deployments.
Visit the AWS SaaS Factory Program page for further information on how AWS can help you on your SaaS journey — regardless of the stage you are currently in.
Detect Python and Java code security vulnerabilities with Amazon CodeGuru Reviewer
=======================
with Aaron Friedman (Principal PM-T for xGuru services)
Amazon CodeGuru is a developer tool that uses machine learning and automated reasoning to catch hard to find defects and security vulnerabilities in application code. The purpose of this blog is to show how new CodeGuru Reviewer features help improve the security posture of your Python applications and highlight some of the specific categories of code vulnerabilities that CodeGuru Reviewer can detect. We will also cover newly expanded security capabilities for Java applications.
Amazon CodeGuru Reviewer can detect code vulnerabilities and provide actionable recommendations across dozens of the most common and impactful categories of code security issues (as classified by industry-recognized standards, Open Web Application Security, OWASP , “top ten” and Common Weakness Enumeration, CWE. The following are some of the most severe code vulnerabilities that CodeGuru Reviewer can now help you detect and prevent:
Injection weaknesses typically appears in data-rich applications. Every year, hundreds of web servers are compromised using SQL Injection. An attacker can use this method to bypass access control and read or modify application data.
Path Traversal security issues occur when an application does not properly handle special elements within a provided path name. An attacker can use it to overwrite or delete critical files and expose sensitive data.
Null Pointer Dereference issues can occur due to simple programming errors, race conditions, and others. Null Pointer Dereference can cause availability issues in rare conditions. Attackers can use it to read and modify memory.
Weak or broken cryptography is a risk that may compromise the confidentiality and integrity of sensitive data.
Security vulnerabilities present in source code can result in application downtime, leaked data, lost revenue, and lost customer trust. Best practices and peer code reviews aren’t sufficient to prevent these issues. You need a systematic way of detecting and preventing vulnerabilities from being deployed to production. CodeGuru Reviewer Security Detectors can provide a scalable approach to DevSecOps, a mechanism that employs automation to address security issues early in the software development lifecycle. Security detectors automate the detection of hard-to-find security vulnerabilities in Java and now Python applications, and provide actionable recommendations to developers.
By baking security mechanisms into each step of the process, DevSecOps enables the development of secure software without sacrificing speed. However, false positive issues raised by Static Application Security Testing (SAST) tools often must be manually triaged effectively and work against this value. CodeGuru uses techniques from automated reasoning, and specifically, precise data-flow analysis, to enhance the precision of code analysis. CodeGuru therefore reports fewer false positives.
Many customers are already embracing open-source code analysis tools in their DevSecOps practices. However, integrating such software into a pipeline requires a heavy up front lift, ongoing maintenance, and patience to configure. Furthering the utility of new security detectors in Amazon CodeGuru Reviewer, this update adds integrations with Bandit and Infer, two widely-adopted open-source code analysis tools. In Java code bases, CodeGuru Reviewer now provide recommendations from Infer that detect null pointer dereferences, thread safety violations and improper use of synchronization locks. And in Python code, the service detects instances of SQL injection, path traversal attacks, weak cryptography, or the use of compromised libraries. Security issues found and recommendations generated by these tools are shown in the console, in pull requests comments, or through CI/CD integrations, alongside code recommendations generated by CodeGuru’s code quality and security detectors. Let’s dive deep and review some examples of code vulnerabilities that CodeGuru Reviewer can help detect.
Injection (Python)
Amazon CodeGuru Reviewer can help detect the most common injection vulnerabilities including SQL, XML, OS command, and LDAP types. For example, SQL injection occurs when SQL queries are constructed through string formatting. An attacker could manipulate the program inputs to modify the intent of the SQL query. The following python statement executes a SQL query constructed through string formatting and can be an attack vector:
import sqlite3
from flask import request
def removing_product():
productId = request.args.get('productId')
str = 'DELETE FROM products WHERE productID = ' + productId
return str
def sql_injection():
connection = psycopg2.connect("dbname=test user=postgres")
cur = db.cursor()
query = removing_product()
cur.execute(query)
CodeGuru will flag a potential SQL injection using Bandit security detector, will make the following recommendation:
>> We detected a SQL command that might use unsanitized input.
This can result in an SQL injection. To increase the security of your code,
sanitize inputs before using them to form a query string.
To avoid this, the user should correct the code to use a parameter sanitization mechanism that guards against SQL injection as done below:
import sqlite3
from flask import request
def removing_product():
productId = sanitize_input(request.args.get('productId'))
str = 'DELETE FROM products WHERE productID = ' + productId
return str
def sql_injection():
connection = psycopg2.connect("dbname=test user=postgres")
cur = db.cursor()
query = removing_product()
cur.execute(query)
In the above corrected code, user supplied sanitize_input method will take care of sanitizing user inputs.
Path Traversal (Python)
When applications use user input to create a path to read or write local files, an attacker can manipulate the input to overwrite or delete critical files or expose sensitive data. These critical files might include source code, sensitive, or application configuration information.
@app.route('/someurl')
def path_traversal():
file_name = request.args["file"]
f = open("./{}".format(file_name))
f.close()
In above example, file name is directly passed to an open API without checking or filtering its content.
CodeGuru’s recommendation:
>> Potentially untrusted inputs are used to access a file path.
To protect your code from a path traversal attack, verify that your inputs are
sanitized.
In response, the developer should sanitize data before using it for creating/opening file.
@app.route('/someurl')
def path_traversal():
file_name = sanitize_data(request.args["file"])
f = open("./{}".format(file_name))
f.close()
In this modified code, input data file_name has been clean/filtered by sanitized_data api call.
Null Pointer Dereference (Java)
Infer detectors are a new addition that complement CodeGuru Reviewer native Java Security Detectors. Infer detectors, based on the Facebook Infer static analyzer, include rules to detect null pointer dereferences, thread safety violations, and improper use of synchronization locks. In particular, the null-pointer-dereference rule detects paths in the code that lead to null pointer exceptions in Java. Null pointer dereference is a very common pitfall in Java and is considered one of 25 most dangerous software weaknesses.
The Infer null-pointer-dereference rule guards against unexpected null pointer exceptions by detecting locations in the code where pointers that could be null are dereferenced. CodeGuru augments the Infer analyzer with knowledge about the AWS APIs, which allows the security detectors to catch potential null pointer exceptions when using AWS APIs.
For example, the AWS DynamoDBMapper class provides a convenient abstraction for mapping Amazon DynamoDB tables to Java objects. However, developers should be aware that DynamoDB Mapper load operations can return a null pointer if the object was not found in the table. The following code snippet updates a record in a catalog using a DynamoDB Mapper:
DynamoDBMapper mapper = new DynamoDBMapper(client);
// Retrieve the item.
CatalogItem itemRetrieved = mapper.load(
CatalogItem.class, 601);
// Update the item.
itemRetrieved.setISBN("622-2222222222");
itemRetrieved.setBookAuthors(
new HashSet<String>(Arrays.asList(
"Author1", "Author3")));
mapper.save(itemRetrieved);
CodeGuru will protect against a potential null dereference by making the following recommendation:
object `itemRetrieved` last assigned on line 88 could be null
and is dereferenced at line 90.
In response, the developer should add a null check to prevent the null pointer dereference from occurring.
DynamoDBMapper mapper = new DynamoDBMapper(client);
// Retrieve the item.
CatalogItem itemRetrieved = mapper.load(CatalogItem.class, 601);
// Update the item.
if (itemRetrieved != null) {
itemRetrieved.setISBN("622-2222222222");
itemRetrieved.setBookAuthors(
new HashSet<String>(Arrays.asList(
"Author1","Author3")));
mapper.save(itemRetrieved);
} else {
throw new CatalogItemNotFoundException();
}
Weak or broken cryptography (Python)
Python security detectors support popular frameworks along with built-in APIs such as cryptography, pycryptodome etc. to identify ciphers related vulnerability. As suggested in CWE-327 , the use of a non-standard/inadequate key length algorithm is dangerous because attacker may be able to break the algorithm and compromise whatever data has been protected. In this example, `PBKDF2` is used with a weak algorithm and may lead to cryptographic vulnerabilities.
from Crypto.Protocol.KDF import PBKDF2
from Crypto.Hash import SHA1
def risky_crypto_algorithm(password):
salt = get_random_bytes(16)
keys = PBKDF2(password, salt, 64, count=1000000,
hmac_hash_module=SHA1)
SHA1 is used to create a PBKDF2, however, it is insecure hence not recommended for PBKDF2. CodeGuru’s identifies the issue and makes the following recommendation:
>> The `PBKDF2` function is using a weak algorithm which might
lead to cryptographic vulnerabilities. We recommend that you use the
`SHA224`, `SHA256`, `SHA384`,`SHA512/224`, `SHA512/256`, `BLAKE2s`,
`BLAKE2b`, `SHAKE128`, `SHAKE256` algorithms.
In response, the developer should use the correct SHA algorithm to protect against potential cipher attacks.
from Crypto.Protocol.KDF import PBKDF2
from Crypto.Hash import SHA512
def risky_crypto_algorithm(password):
salt = get_random_bytes(16)
keys = PBKDF2(password, salt, 64, count=1000000,
hmac_hash_module=SHA512)
This modified example uses high strength SHA512 algorithm.
Conclusion
This post reviewed Amazon CodeGuru Reviewer security detectors and how they automatically check your code for vulnerabilities and provide actionable recommendations in code reviews. We covered new capabilities for detecting issues in Python applications, as well as additional security features from Bandit and Infer. Together CodeGuru Reviewer’s security features provide a scalable approach for customers embracing DevSecOps, a mechanism that requires automation to address security issues earlier in the software development lifecycle. CodeGuru automates detection and helps prevent hard-to-find security vulnerabilities, accelerating DevSecOps processes for application development workflow.
You can get started from the CodeGuru console by running a full repository scan or integrating CodeGuru Reviewer with your supported CI/CD pipeline. Code analysis from Infer and Bandit is included as part of the standard CodeGuru Reviewer service.
For more information about automating code reviews and application profiling with Amazon CodeGuru, check out the AWS DevOps Blog. For more details on how to get started, visit the documentation.
Page 1|Page 2|Page 3|Page 4