Contents of this page is copied directly from AWS blog sites to make it Kindle friendly. Some styles & sections from these pages are removed to render this properly in 'Article Mode' of Kindle e-Reader browser. All the contents of this page is property of AWS.
Page 1|Page 2|Page 3|Page 4
EC2 Image Builder and Hands-free Hardening of Windows Images for AWS Elastic Beanstalk
=======================
AWS Elastic Beanstalk takes care of undifferentiated heavy lifting for customers by regularly providing new platform versions to update all Linux-based and Windows Server-based platforms. In addition to the updates to existing software components and support for new features and configuration options incorporated into the Elastic Beanstalk managed Amazon Machine Images (AMI), you may need to install third-party packages, or apply additional controls in order to meet industry or internal security criteria; for example, the Defense Information Systems Agency’s (DISA) Security Technical Implementation Guides (STIG).
In this blog post you will learn how to automate the process of customizing Elastic Beanstalk managed AMIs using EC2 Image Builder and apply the medium and low severity STIG settings to Windows instances whenever new platform versions are released.
You can extend the solution in this blog post to go beyond system hardening. EC2 Image Builder allows you to execute scripts that define the custom configuration for an image, known as Components. There are over 20 Amazon managed Components that you can use. You can also create your own, and even share with others.
These services are discussed in this blog post:
EC2 Image Builder simplifies the building, testing, and deployment of virtual machine and container images.
Amazon EventBridge is a serverless event bus that simplifies the process of building event-driven architectures.
AWS Lambda lets you run code without provisioning or managing servers.
AWS Systems Manager Parameter Store provides secure, hierarchical storage for configuration data, and secrets.
AWS Elastic Beanstalk is an easy-to-use service for deploying and scaling web applications and services.
Prerequisites
This solution has the following prerequisites:
AWS SAM CLI to deploy the solution. See the installing the AWS CLI page for instructions if needed.
Either the AWS Command Line Interface (AWS CLI) or the AWS Tools for PowerShell should be installed and configured on your machine. This blog post provides equivalent commands when applicable.
Microsoft .NET 5 SDK to compile the included Lambda functions
Docker Desktop to create the container image used to publish the Lambda function
All of the code necessary to deploy the solution is available on the . The repository details the solution’s codebase, and the “Deploying the Solution” section walks through the deployment process. Let’s start with a walkthrough of the solution’s design.
Overview of solution
The solution automates the following three steps.
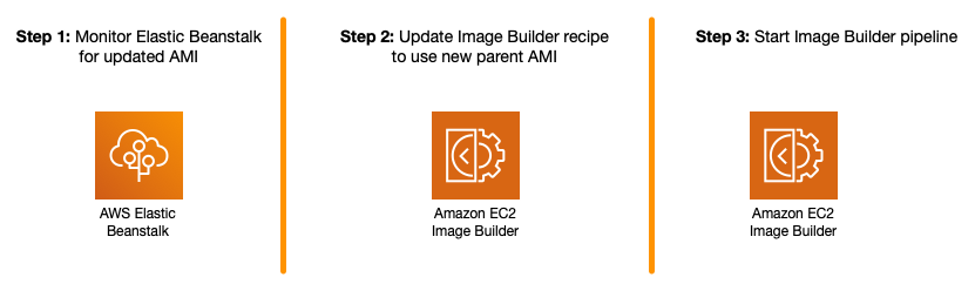
Figure 1 – Steps being automated
The Image Builder Pipeline takes care of launching an EC2 instance using the Elastic Beanstalk managed AMI, hardens the image using EC2 Image Builder’s STIG Medium Component, and outputs a new AMI that can be used by application teams to create their Elastic Beanstalk Environments.

Figure 2 – EC2 Image Builder Pipeline Steps
To automate Step 1, an Amazon EventBridge rule is used to trigger an AWS Lambda function to get the latest AMI ID for the Elastic Beanstalk platform used, and ensures that the Parameter Store parameter is kept up to date.
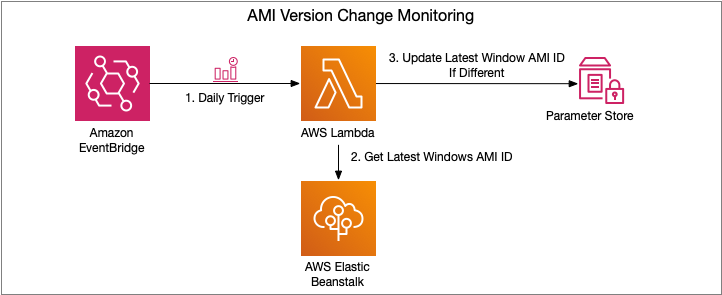
Figure 3 – AMI Version Change Monitoring Flow
Steps 2 and 3 are trigged upon change to the Parameter Store parameter. An EventBridge rule is created to trigger a Lambda function, which manages the creation of a new EC2 Image Builder Recipe, updates the EC2 Image Builder Pipeline to use this new recipe, and starts a new instance of an EC2 Image Builder Pipeline.

Figure 4 – EC2 Image Builder Pipeline Execution Flow
If you would also like to store the ID of the newly created AMI, see the Tracking the latest server images in Amazon EC2 Image Builder pipelines blog post on how to use Parameter Store for this purpose. This will enable you to notify teams that a new AMI is available for consumption.
Let’s dive a bit deeper into each of these pieces and how to deploy the solution.
Walkthrough
The following are the high-level steps we will be walking through in the rest of this post.
Deploy SAM template that will provision all pieces of the solution. Checkout the Using container image support for AWS Lambda with AWS SAM blog post for more details.
Invoke the AMI version monitoring AWS Lambda function. The EventBridge rule is configured for a daily trigger and for the purposes of this blog post, we do not want to wait that long prior to seeing the pipeline in action.
View the details of the resultant image after the Image Builder Pipeline completes
Deploying the Solution
The first step to deploying the solution is to create the Elastic Container Registry Repository that will be used to upload the image artifacts created. You can do so using the following AWS CLI or AWS Tools for PowerShell command:
aws ecr create-repository --repository-name elastic-beanstalk-image-pipeline-trigger --image-tag-mutability IMMUTABLE --image-scanning-configuration scanOnPush=true --region us-east-1
New-ECRRepository -RepositoryName elastic-beanstalk-image-pipeline-trigger -ImageTagMutability IMMUTABLE -ImageScanningConfiguration_ScanOnPush $True -Region us-east-1
This will return output similar to the following. Take note of the repositoryUri as you will be using that in an upcoming step.
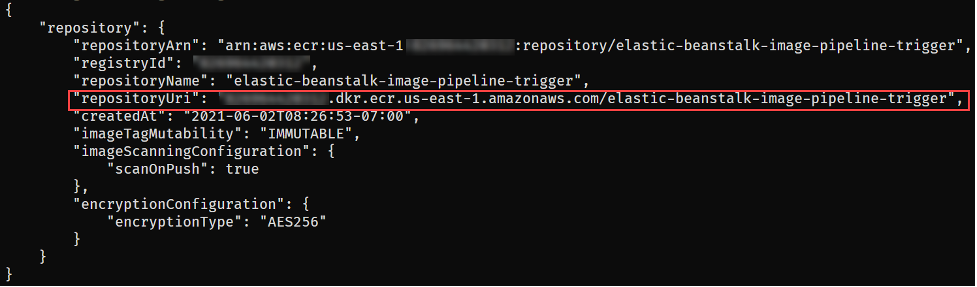
Figure 5 – ECR repository creation output
With the repository configured, you are ready to get the solution. Either download or clone the project’s aws-samples/elastic-beanstalk-image-pipeline-trigger GitHub repository to a local directory. Once you have the project downloaded, you can compile it using the following command from the project’s src/BeanstalkImageBuilderPipeline directory.
dotnet publish -c Release -o ./bin/Release/net5.0/linux-x64/publish
The output should look like:
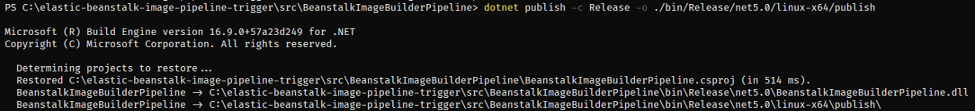
Figure 6 – .NET project compilation output
Now that the project is compiled, you are ready to create the container image by executing the following SAM CLI command.
sam build --template-file ./serverless.template

Figure 7 – SAM build command output
Next up deploy the SAM template with the following command, replacing REPOSITORY_URL with the URL of the ECR repository created earlier:
sam deploy --stack-name elastic-beanstalk-image-pipeline --image-repository <REPOSITORY_URL> --capabilities CAPABILITY_IAM --region us-east-1
The SAM CLI will both push the container image and create the CloudFormation Stack, deploying all resources needed for this solution. The deployment output will look similar to:
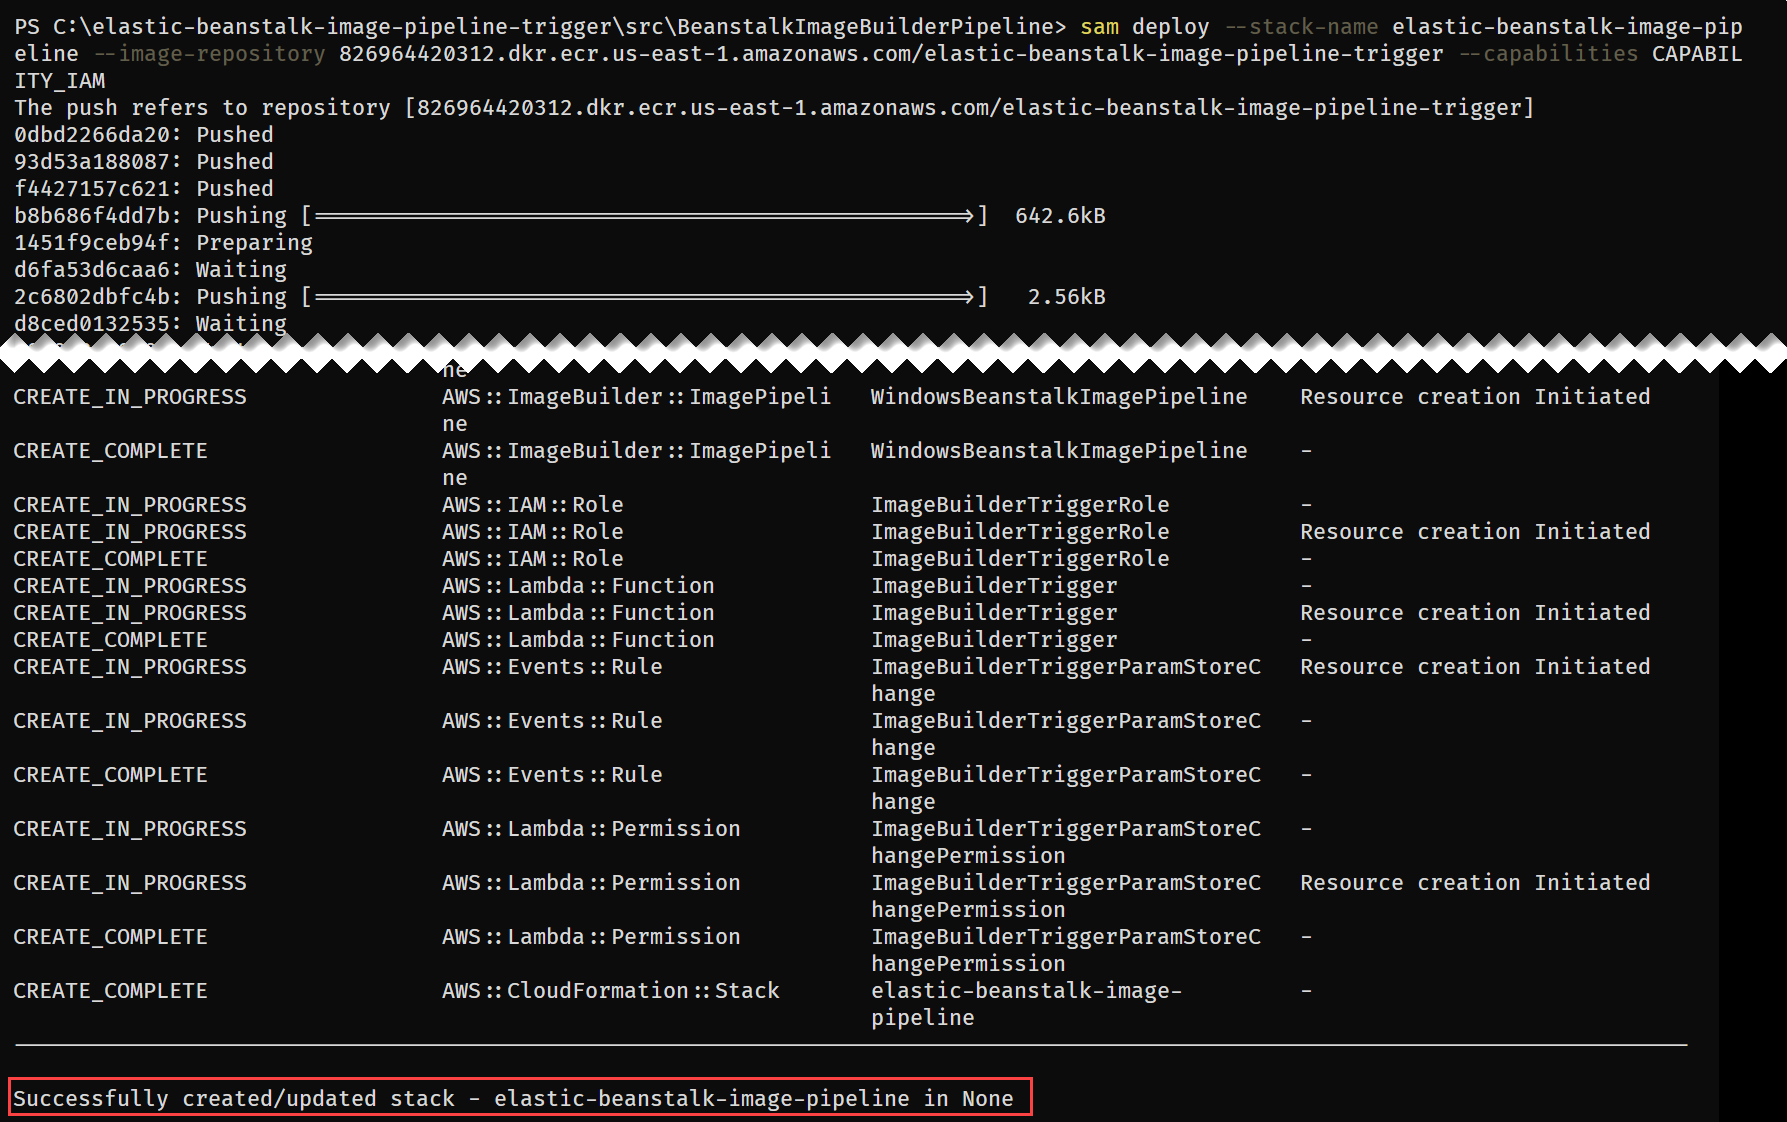
Figure 8 – SAM deploy command output
With the CloudFormation Stack completed, you are ready to move onto starting the pipeline to create a custom Windows AMI with the medium DISA STIG applied.
Invoke AMI ID Monitoring Lambda
Let’s start by invoking the Lambda function, depicted in Figure 3, responsible for ensuring that the latest Elastic Beanstalk managed AMI ID is stored in Parameter Store.
aws lambda invoke --function-name BeanstalkManagedAmiMonitor response.json --region us-east-1
Invoke-LMFunction -FunctionName BeanstalkManagedAmiMonitor -Region us-east-1

Figure 9 – Lambda invocation output
The Lambda’s CloudWatch log group contains the BeanstalkManagedAmiMonitor function’s output. For example, below you can see that the SSM parameter is being updated with the new AMI ID.

Figure 10 – BeanstalkManagedAmiMonitor Lambda’s log
After this Lambda function updates the Parameter Store parameter with the latest AMI ID, the EC2 Image Builder recipe will be updated to use this AMI ID as the parent image, and the Image Builder pipeline will be started. You can see evidence of this by going to the ImageBuilderTrigger Lambda function’s CloudWatch log group. Below you can see a log entry with the message “Starting image pipeline execution…”.
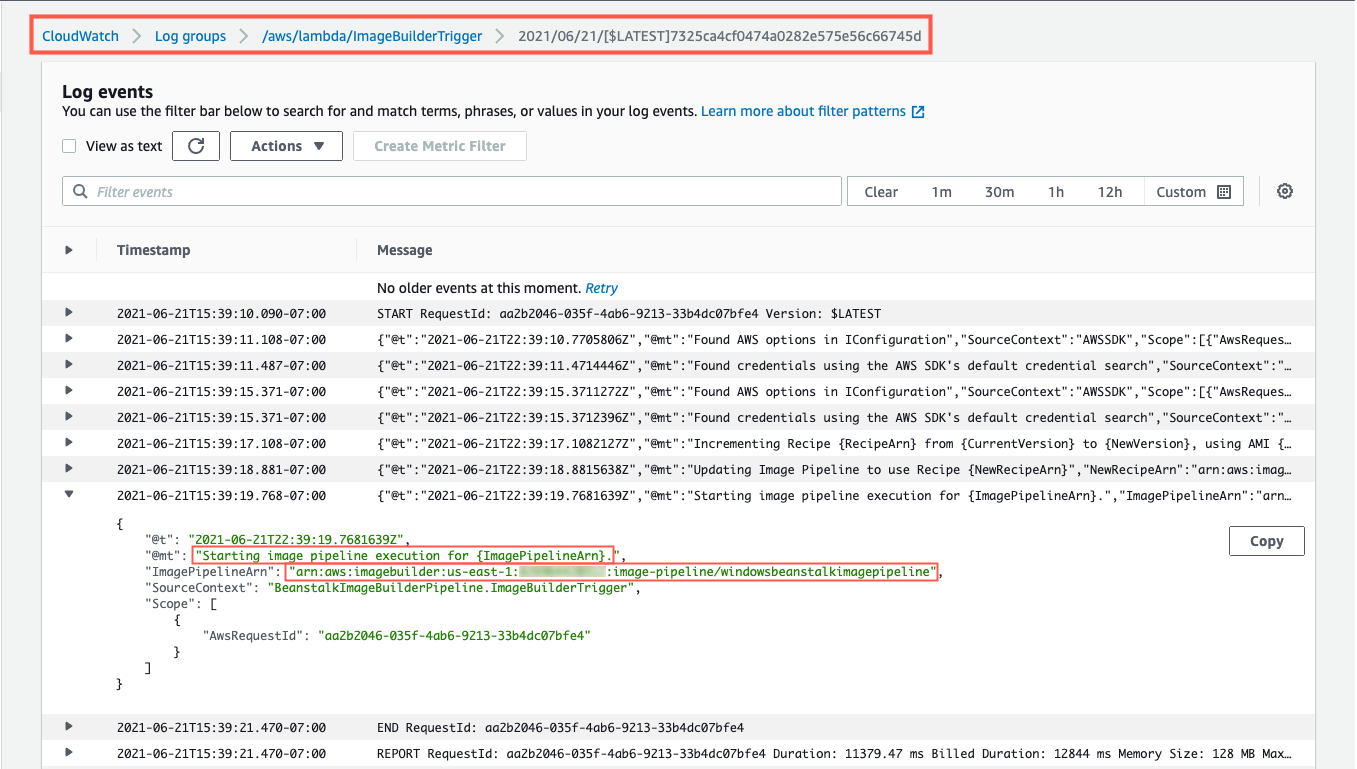
Figure 11 – ImageBuilderTrigger Lambda’s log
To keep track of the status of the image creation, navigate to the EC2 Image Builder console, and select the 1.0.1 version of the demo-beanstalk-image.

Figure 12 – EC2 Image Builder images list
This will display the details for that build. Keep an eye on the status. While the image is being create, you will see the status as “Building”. Applying the latest Windows updates and DISA STIG can take about an hour.

Figure 13 – EC2 Image Builder image build version details
Once the AMI has been created, the status will change to “Available”. Click on the version column’s link to see the details of that version.

Figure 14 – EC2 Image Builder image build version details
You can use the AMI ID listed when creating an Elastic Beanstalk application. When using the create new environment wizard, you can modify the capacity settings to specify this custom AMI ID. The automation is configured to run on a daily basis. Only for the purposes of this post, did we have to invoke the Lambda function directly.
Cleaning up
To avoid incurring future charges, delete the resources using the following commands, replacing the AWS_ACCOUNT_NUMBER placeholder with appropriate value.
aws imagebuilder delete-image --image-build-version-arn arn:aws:imagebuilder:us-east-1:<AWS_ACCOUNT_NUMBER>:image/demo-beanstalk-image/1.0.1/1 --region us-east-1
aws imagebuilder delete-image-pipeline --image-pipeline-arn arn:aws:imagebuilder:us-east-1:<AWS_ACCOUNT_NUMBER>:image-pipeline/windowsbeanstalkimagepipeline --region us-east-1
aws imagebuilder delete-image-recipe --image-recipe-arn arn:aws:imagebuilder:us-east-1:<AWS_ACCOUNT_NUMBER>:image-recipe/demo-beanstalk-image/1.0.1 --region us-east-1
aws cloudformation delete-stack --stack-name elastic-beanstalk-image-pipeline --region us-east-1
aws cloudformation wait stack-delete-complete --stack-name elastic-beanstalk-image-pipeline --region us-east-1
aws ecr delete-repository --repository-name elastic-beanstalk-image-pipeline-trigger --force --region us-east-1
Remove-EC2IBImage -ImageBuildVersionArn arn:aws:imagebuilder:us-east-1:<AWS_ACCOUNT_NUMBER>:image/demo-beanstalk-image/1.0.1/1 -Region us-east-1
Remove-EC2IBImagePipeline -ImagePipelineArn arn:aws:imagebuilder:us-east-1:<AWS_ACCOUNT_NUMBER>:image-pipeline/windowsbeanstalkimagepipeline -Region us-east-1
Remove-EC2IBImageRecipe -ImageRecipeArn arn:aws:imagebuilder:us-east-1:<AWS_ACCOUNT_NUMBER>:image-recipe/demo-beanstalk-image/1.0.1 -Region us-east-1
Remove-CFNStack -StackName elastic-beanstalk-image-pipeline -Region us-east-1
Wait-CFNStack -StackName elastic-beanstalk-image-pipeline -Region us-east-1
Remove-ECRRepository -RepositoryName elastic-beanstalk-image-pipeline-trigger -IgnoreExistingImages $True -Region us-east-1
Conclusion
In this post, you learned how to leverage EC2 Image Builder, Lambda, and EventBridge to automate the creation of a Windows AMI with the medium DISA STIGs applied that can be used for Elastic Beanstalk environments. Don’t stop there though, you can apply these same techniques whenever you need to base recipes on AMIs that the image origin is not available in EC2 Image Builder.
Further Reading
EC2 Image Builder has a number of image origins supported out of the box, see the Automate OS Image Build Pipelines with EC2 Image Builder blog post for more details. EC2 Image Builder is also not limited to just creating AMIs. The Build and Deploy Docker Images to AWS using EC2 Image Builder blog post shows you how to build Docker images that can be utilized throughout your organization.
These resources can provide additional information on the topics touched on in this article:
A simpler deployment experience with AWS SAM CLI
AWS Tools for PowerShell is now generally available with version 4.0
.NET 5 on AWS

Carlos Santos
Carlos Santos is a Microsoft Specialist Solutions Architect with Amazon Web Services (AWS). In his role, Carlos helps customers through their cloud journey, leveraging his experience with application architecture, and distributed system design.
Deploy data lake ETL jobs using CDK Pipelines
=======================
This post is co-written with Isaiah Grant, Cloud Consultant at 2nd Watch.
Many organizations are building data lakes on AWS, which provides the most secure, scalable, comprehensive, and cost-effective portfolio of services. Like any application development project, a data lake must answer a fundamental question: “What is the DevOps strategy?” Defining a DevOps strategy for a data lake requires extensive planning and multiple teams. This typically requires multiple development and test cycles before maturing enough to support a data lake in a production environment. If an organization doesn’t have the right people, resources, and processes in place, this can quickly become daunting.
What if your data engineering team uses basic building blocks to encapsulate data lake infrastructure and data processing jobs? This is where CDK Pipelines brings the full benefit of infrastructure as code (IaC). CDK Pipelines is a high-level construct library within the AWS Cloud Development Kit (AWS CDK) that makes it easy to set up a continuous deployment pipeline for your AWS CDK applications. The AWS CDK provides essential automation for your release pipelines so that your development and operations team remain agile and focus on developing and delivering applications on the data lake.
In this post, we discuss a centralized deployment solution utilizing CDK Pipelines for data lakes. This implements a DevOps-driven data lake that delivers benefits such as continuous delivery of data lake infrastructure, data processing, and analytical jobs through a configuration-driven multi-account deployment strategy. Let’s dive in!
Data lakes on AWS
A data lake is a centralized repository where you can store all of your structured and unstructured data at any scale. Store your data as is, without having to first structure it, and run different types of analytics—from dashboards and visualizations to big data processing, real-time analytics, and machine learning in order to guide better decisions. To further explore data lakes, refer to What is a data lake?
We design a data lake with the following elements:
Secure data storage
Data cataloging in a central repository
Data movement
Data analysis
The following figure represents our data lake.
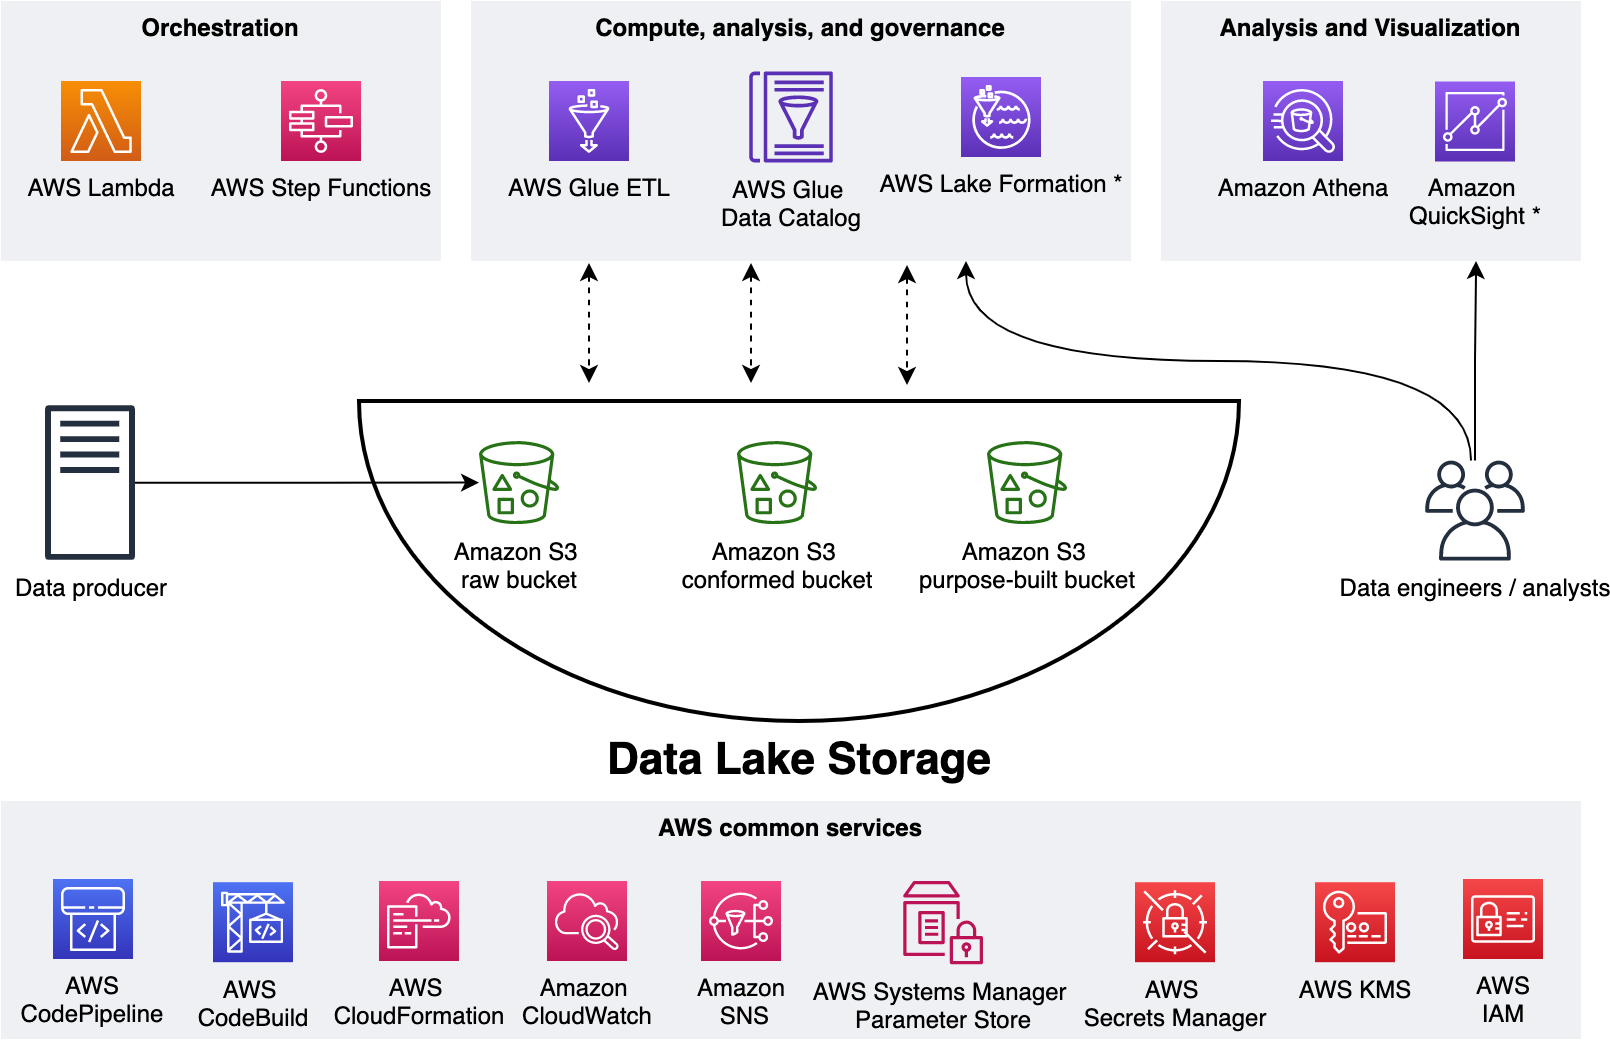
We use three Amazon Simple Storage Service (Amazon S3) buckets:
raw – Stores the input data in its original format
conformed – Stores the data that meets the data lake quality requirements
purpose-built – Stores the data that is ready for consumption by applications or data lake consumers
The data lake has a producer where we ingest data into the raw bucket at periodic intervals. We utilize the following tools: AWS Glue processes and analyzes the data. AWS Glue Data Catalog persists metadata in a central repository. AWS Lambda and AWS Step Functions schedule and orchestrate AWS Glue extract, transform, and load (ETL) jobs. Amazon Athena is used for interactive queries and analysis. Finally, we engage various AWS services for logging, monitoring, security, authentication, authorization, alerting, and notification.
A common data lake practice is to have multiple environments such as dev, test, and production. Applying the IaC principle for data lakes brings the benefit of consistent and repeatable runs across multiple environments, self-documenting infrastructure, and greater flexibility with resource management. The AWS CDK offers high-level constructs for use with all of our data lake resources. This simplifies usage and streamlines implementation.
Before exploring the implementation, let’s gain further scope of how we utilize our data lake.
The solution
Our goal is to implement a CI/CD solution that automates the provisioning of data lake infrastructure resources and deploys ETL jobs interactively. We accomplish this as follows: 1) applying separation of concerns (SoC) design principle to data lake infrastructure and ETL jobs via dedicated source code repositories, 2) a centralized deployment model utilizing CDK pipelines, and 3) AWS CDK enabled ETL pipelines from the start.
Data lake infrastructure
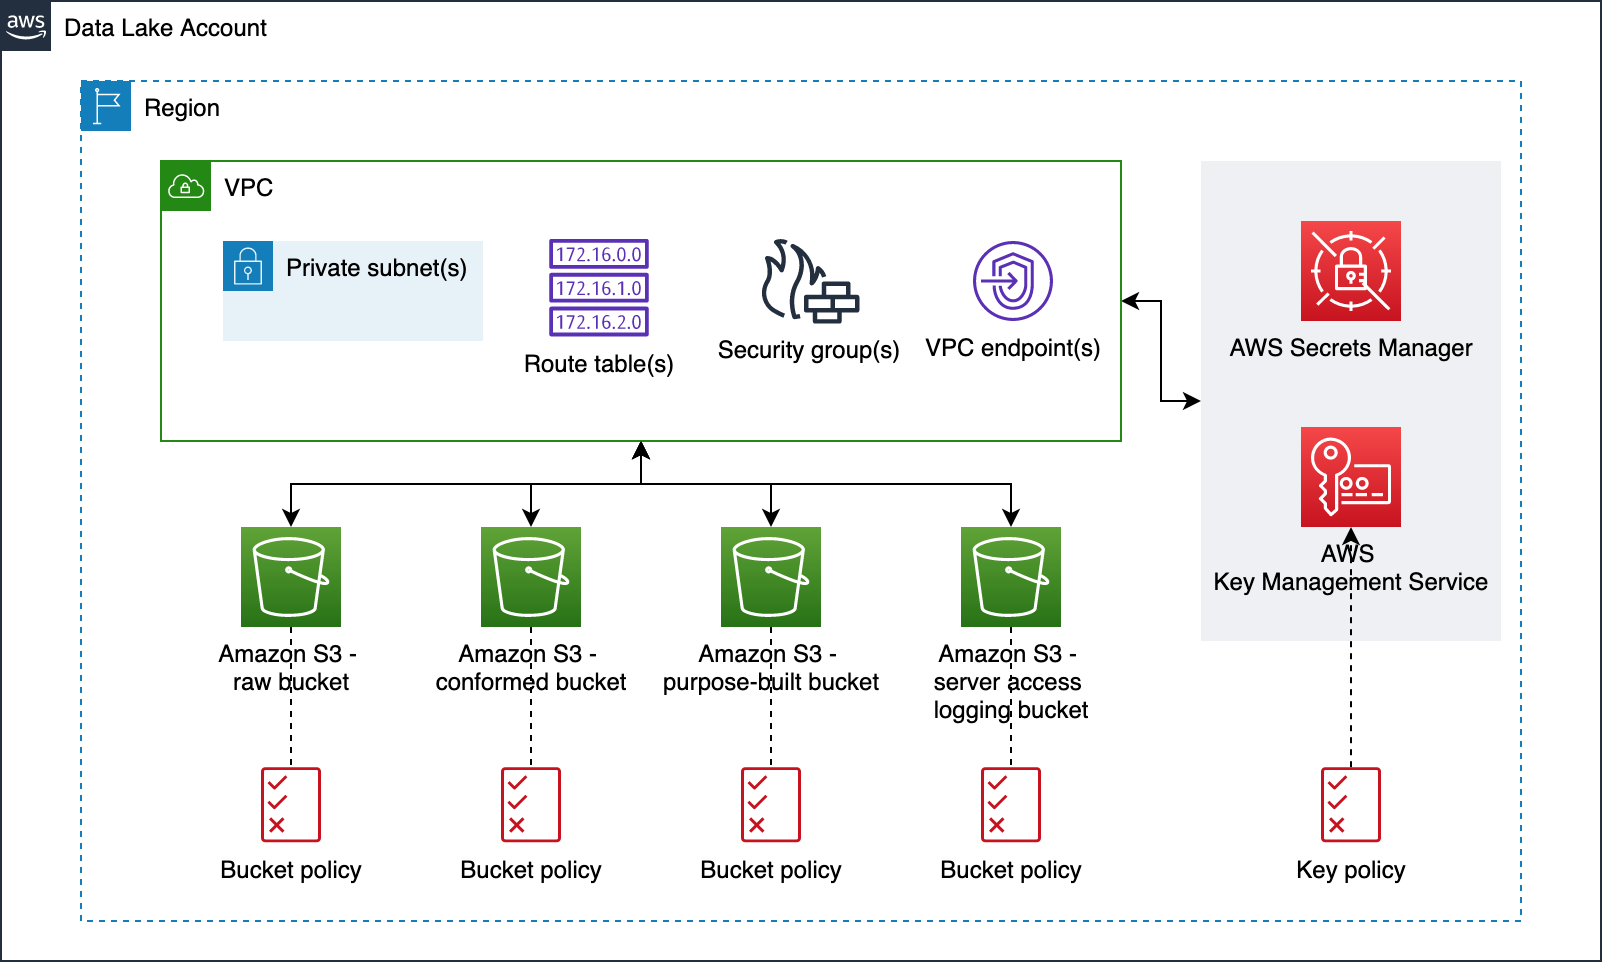
Our data lake infrastructure provisioning includes Amazon S3 buckets, S3 bucket policies, AWS Key Management Service (KMS) encryption keys, Amazon Virtual Private Cloud (Amazon VPC), subnets, route tables, security groups, VPC endpoints, and secrets in AWS Secrets Manager. The following diagram illustrates this.
Data lake ETL jobs
For our ETL jobs, we process New York City TLC Trip Record Data. The following figure displays our ETL process, wherein we run two ETL jobs within a Step Functions state machine.
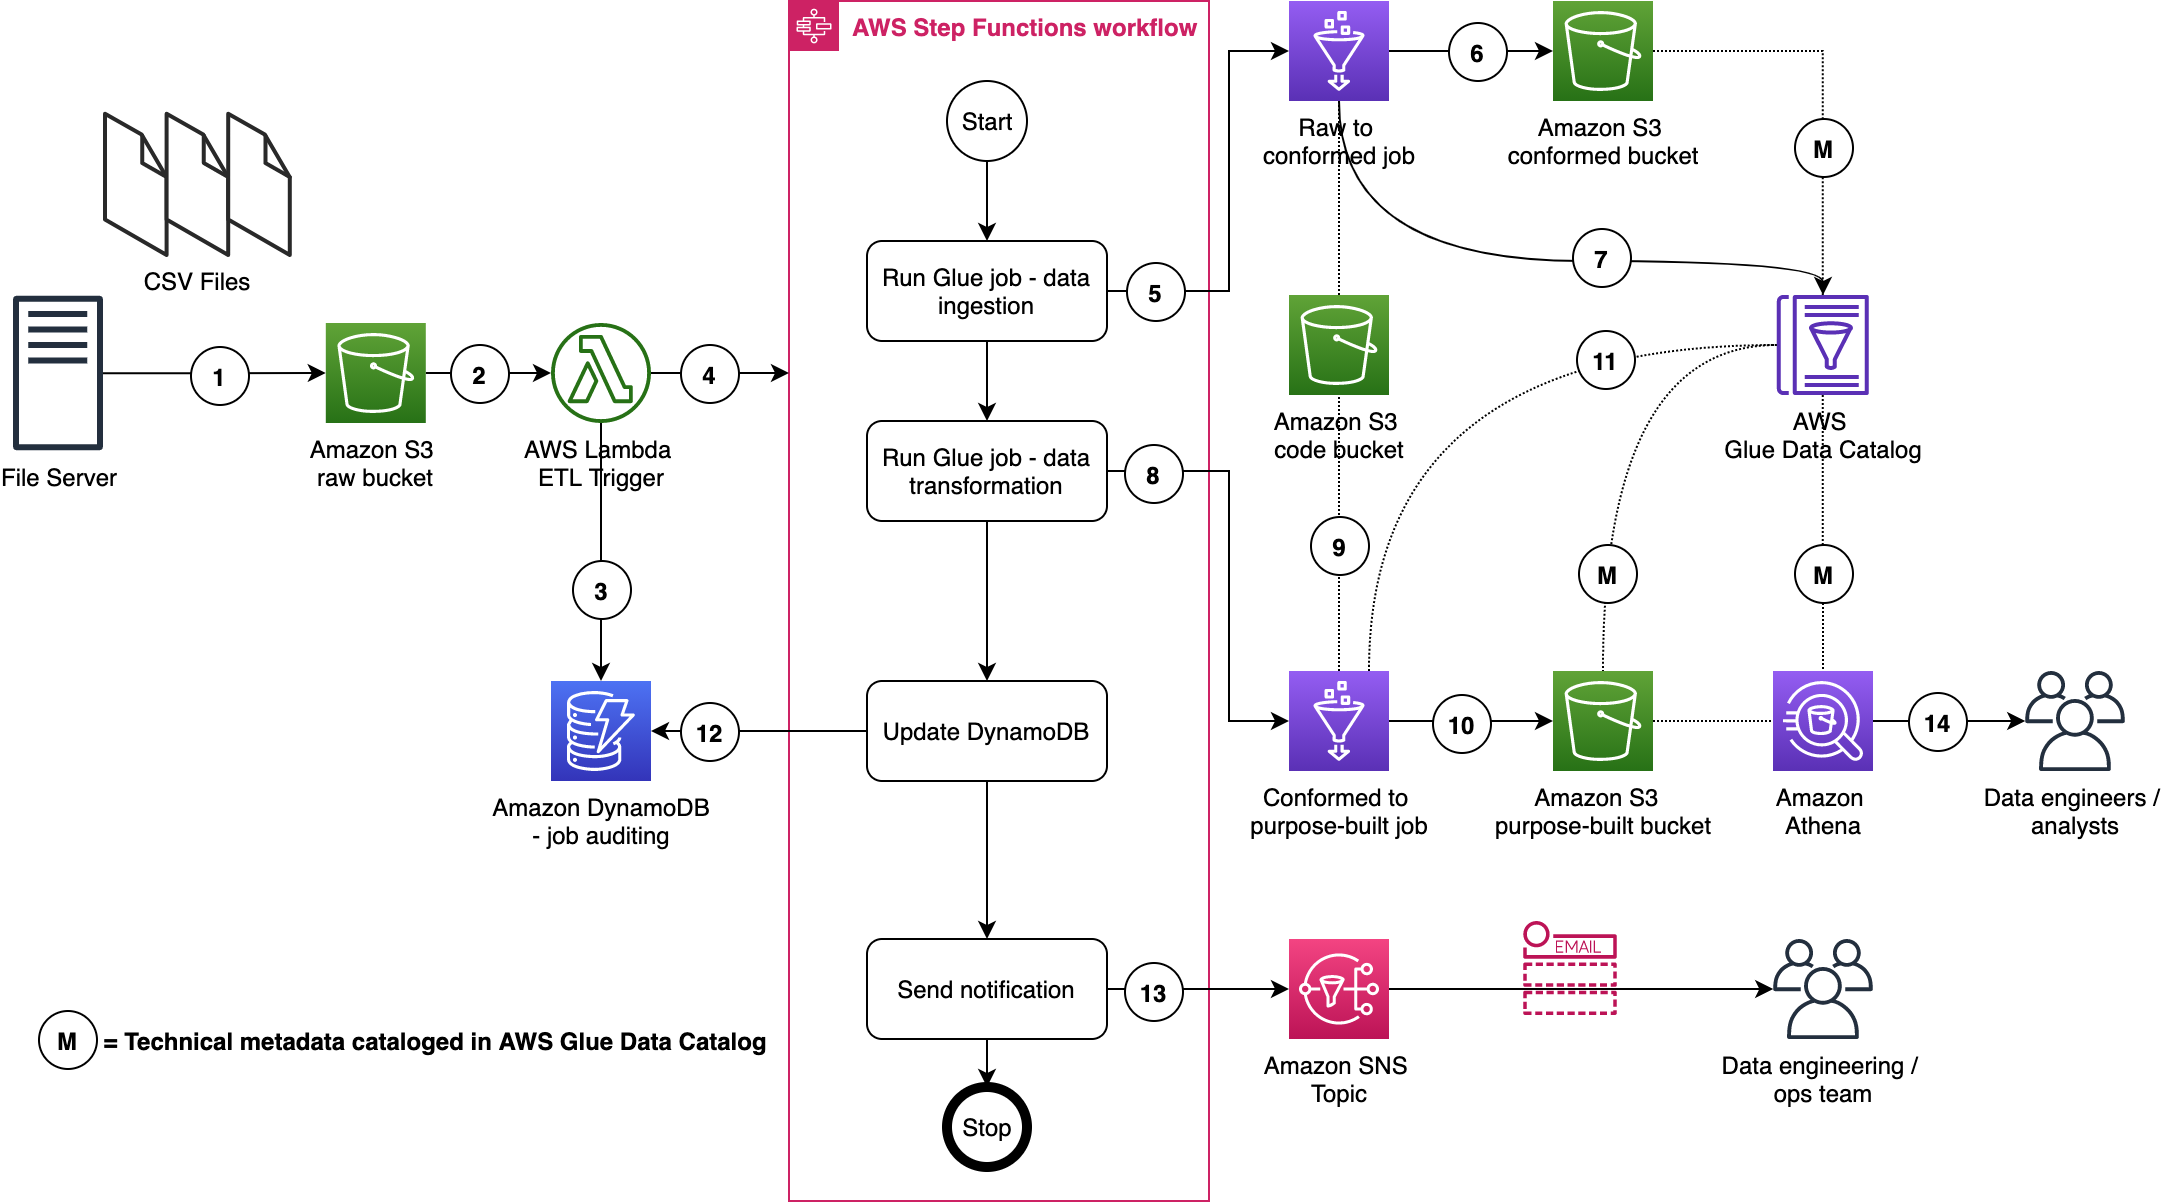
Here are a few important details:
- A file server uploads files to the S3 raw bucket of the data lake. The file server is a data producer and source for the data lake. We assume that the data is pushed to the raw bucket.
- Amazon S3 triggers an event notification to the Lambda function.
- The function inserts an item in the Amazon DynamoDB table in order to track the file processing state. The first state written indicates the AWS Step Function start.
- The function starts the state machine.
- The state machine runs an AWS Glue job (Apache Spark).
- The job processes input data from the raw zone to the data lake conformed zone. The job also converts CSV input data to Parquet formatted data.
- The job updates the Data Catalog table with the metadata of the conformed Parquet file.
- A second AWS Glue job (Apache Spark) processes the input data from the conformed zone to the purpose-built zone of the data lake.
- The job fetches ETL transformation rules from the Amazon S3 code bucket and transforms the input data.
- The job stores the result in Parquet format in the purpose-built zone.
- The job updates the Data Catalog table with the metadata of the purpose-built Parquet file.
- The job updates the DynamoDB table and updates the job status to completed.
- An Amazon Simple Notification Service (Amazon SNS) notification is sent to subscribers that states the job is complete.
- Data engineers or analysts can now analyze data via Athena.
We will discuss data formats, Glue jobs, ETL transformation logics, data cataloging, auditing, notification, orchestration, and data analysis in more detail in AWS CDK Pipelines for Data Lake ETL Deployment GitHub repository. This will be discussed in the subsequent section.
Centralized deployment
Now that we have data lake infrastructure and ETL jobs ready, let’s define our deployment model. This model is based on the following design principles:
A dedicated AWS account to run CDK pipelines.
One or more AWS accounts into which the data lake is deployed.
The data lake infrastructure has a dedicated source code repository. Typically, data lake infrastructure is a one-time deployment and rarely evolves. Therefore, a dedicated code repository provides a landing zone for your data lake.
Each ETL job has a dedicated source code repository. Each ETL job may have unique AWS service, orchestration, and configuration requirements. Therefore, a dedicated source code repository will help you more flexibly build, deploy, and maintain ETL jobs.
We organize our source code repo into three branches: dev (main), test, and prod. In the deployment account, we manage three separate CDK Pipelines and each pipeline is sourced from a dedicated branch. Here we choose a branch-based software development method in order to demonstrate the strategy in more complex scenarios where integration testing and validation layers require human intervention. As well, these may not immediately follow with a corresponding release or deployment due to their manual nature. This facilitates the propagation of changes through environments without blocking independent development priorities. We accomplish this by isolating resources across environments in the central deployment account, allowing for the independent management of each environment, and avoiding cross-contamination during each pipeline’s self-mutating updates. The following diagram illustrates this method.
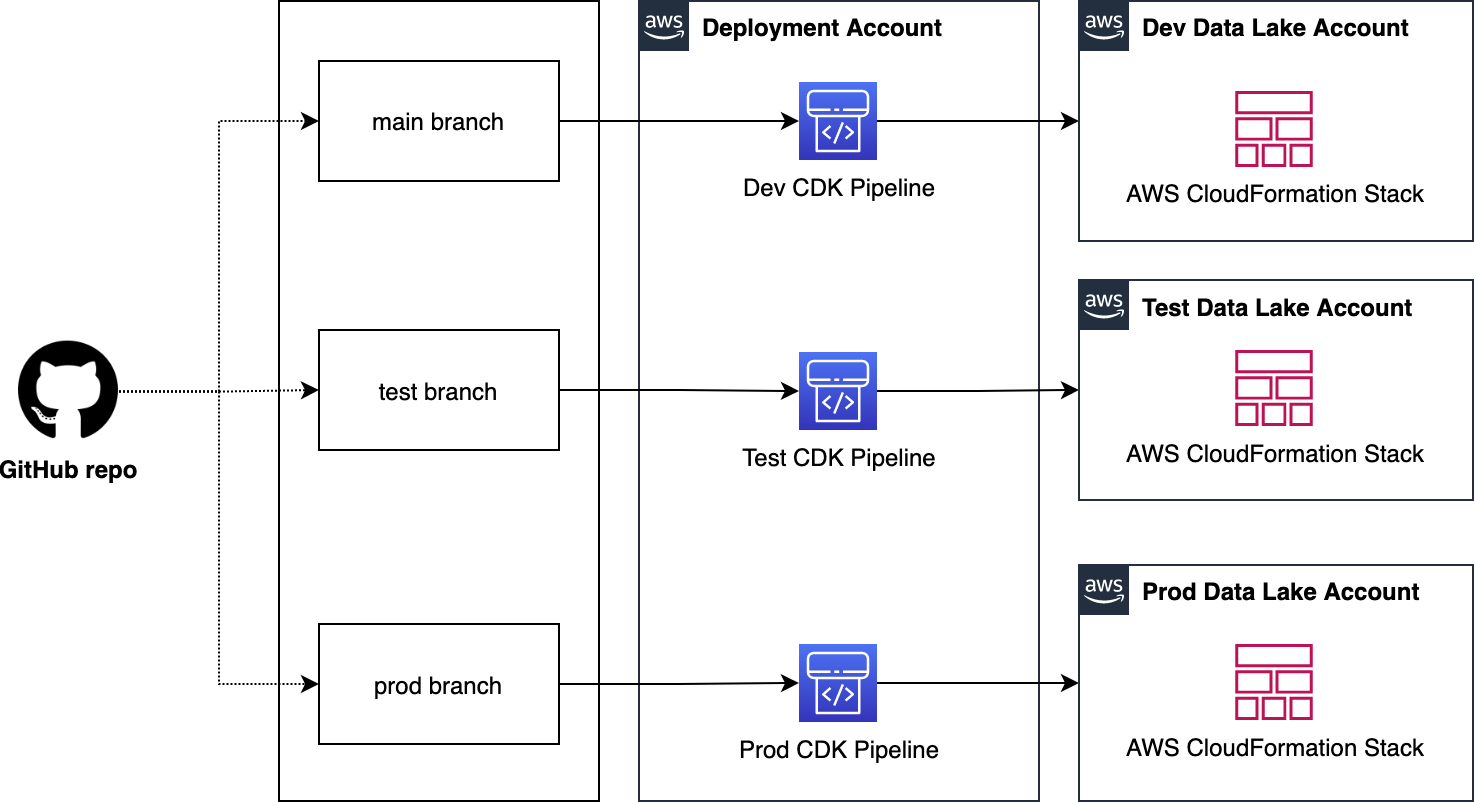
Note: This centralized deployment strategy can be adopted for trunk-based software development with minimal solution modification.
Deploying data lake ETL jobs
The following figure illustrates how we utilize CDK Pipelines to deploy data lake infrastructure and ETL jobs from a central deployment account. This model follows standard nomenclature from the AWS CDK. Each repository represents a cloud infrastructure code definition. This includes the pipelines construct definition. Pipelines have one or more actions, such as cloning the source code (source action) and synthesizing the stack into an AWS CloudFormation template (synth action). Each pipeline has one or more stages, such as testing and deploying. In an AWS CDK app context, the pipelines construct is a stack like any other stack. Therefore, when the AWS CDK app is deployed, a new pipeline is created in AWS CodePipeline.
This provides incredible flexibility regarding DevOps. In other words, as a developer with an understanding of AWS CDK APIs, you can harness the power and scalability of AWS services such as CodePipeline, AWS CodeBuild, and AWS CloudFormation.
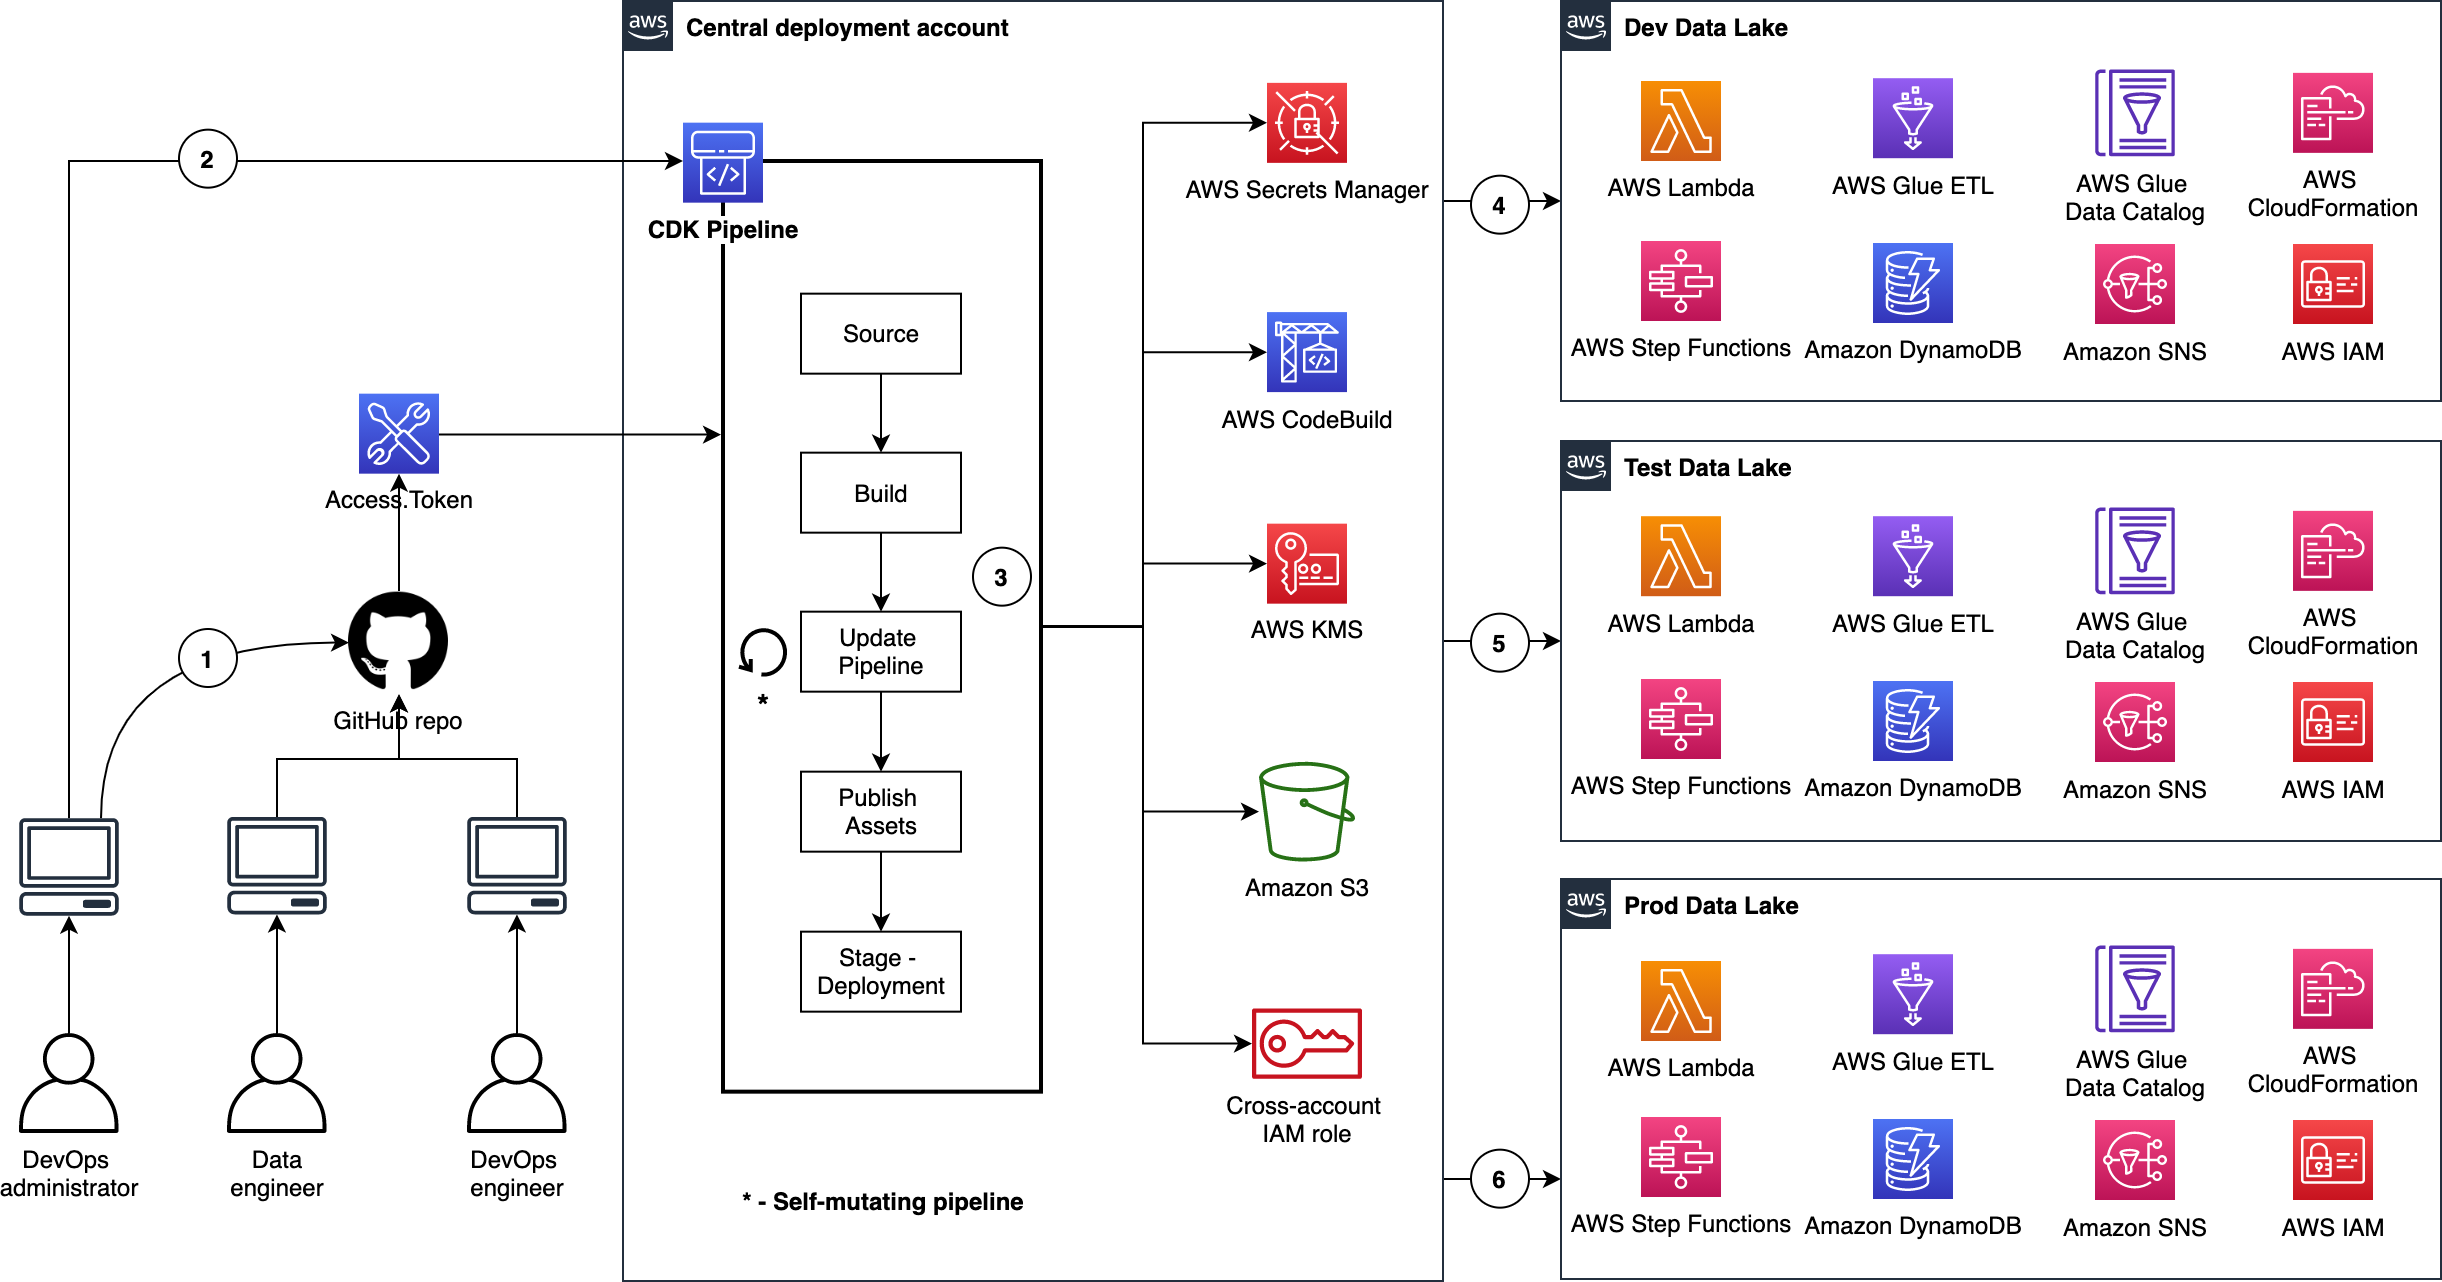
Here are a few important details:
- The DevOps administrator checks in the code to the repository.
- The DevOps administrator (with elevated access) facilitates a one-time manual deployment on a target environment. Elevated access includes administrative privileges on the central deployment account and target AWS environments.
- CodePipeline periodically listens to commit events on the source code repositories. This is the self-mutating nature of CodePipeline. It’s configured to work with and can update itself according to the provided definition.
- Code changes made to the main repo branch are automatically deployed to the data lake dev environment.
- Code changes to the repo test branch are automatically deployed to the test environment.
- Code changes to the repo prod branch are automatically deployed to the prod environment.
CDK Pipelines starter kits for data lakes
Want to get going quickly with CDK Pipelines for your data lake? Start by cloning our two GitHub repositories. Here is a summary:
CDK Pipelines for Data Lake Infrastructure Deployment
This repository contains the following reusable resources:
CDK Application
CDK Pipelines stack
CDK Pipelines deploy stage
Amazon VPC stack
Amazon S3 stack
It also contains the following automation scripts:
AWS environments configuration
Deployment account bootstrapping
Target account bootstrapping
Account secrets configuration (e.g., GitHub access tokens)
CDK Pipelines for Data Lake ETL Deployment
This repository contains the following reusable resources:
CDK Application
CDK Pipelines stack
CDK Pipelines deploy stage
Amazon DynamoDB stack
AWS Glue stack
AWS Step Functions stack
It also contains the following:
AWS Lambda scripts
AWS Glue scripts
AWS Step Functions State machine script
Advantages
This section summarizes some of the advantages offered by this solution.
Scalable and centralized deployment model
We utilize a scalable and centralized deployment model to deliver end-to-end automation. This allows DevOps and data engineers to use the single responsibility principal while maintaining precise control over the deployment strategy and code quality. The model can readily be expanded to more accounts, and the pipelines are responsive to custom controls within each environment, such as a production approval layer.
Configuration-driven deployment
Configuration in the source code and AWS Secrets Manager allow deployments to utilize targeted values that are declared globally in a single location. This provides consistent management of global configurations and dependencies such as resource names, AWS account Ids, Regions, and VPC CIDR ranges. Similarly, the CDK Pipelines export outputs from CloudFormation stacks for later consumption via other resources.
Repeatable and consistent deployment of new ETL jobs
Continuous integration and continuous delivery (CI/CD) pipelines allow teams to deploy to production more frequently. Code changes can be safely and securely propagated through environments and released for deployment. This allows rapid iteration on data processing jobs, and these jobs can be changed in isolation from pipeline changes, resulting in reliable workflows.
Cleaning up
You may delete the resources provisioned by utilizing the starter kits. You can do this by running the cdk destroy command using AWS CDK Toolkit. For detailed instructions, refer to the Clean up sections in the starter kit README files.
Conclusion
In this post, we showed how to utilize CDK Pipelines to deploy infrastructure and data processing ETL jobs of your data lake in dev, test, and production AWS environments. We provided two GitHub repositories for you to test and realize the full benefits of this solution first hand. We encourage you to fork the repositories, bring your ETL scripts, bootstrap your accounts, configure account parameters, and continuously delivery your data lake ETL jobs.
Let’s stay in touch via the GitHub—CDK Pipelines for Data Lake Infrastructure Deployment and CDK Pipelines for Data Lake ETL Deployment.
Secure and analyse your Terraform code using AWS CodeCommit, AWS CodePipeline, AWS CodeBuild and tfsec
=======================
Introduction
More and more customers are using Infrastructure-as-Code (IaC) to design and implement their infrastructure on AWS. This is why it is essential to have pipelines with Continuous Integration/Continuous Deployment (CI/CD) for infrastructure deployment. HashiCorp Terraform is one of the popular IaC tools for customers on AWS.
In this blog, I will guide you through building a CI/CD pipeline on AWS to analyze and identify possible configurations issues in your Terraform code templates. This will help mitigate security risks within our infrastructure deployment pipelines as part of our CI/CD. To do this, we utilize AWS tools and the Open Source tfsec tool, a static analysis security scanner for your Terraform code, including more than 90 preconfigured checks with the ability to add custom checks.
Solutions Overview
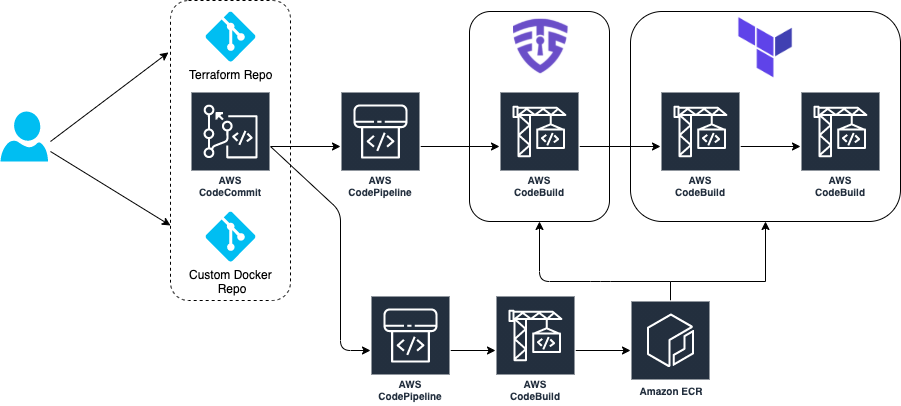
The architecture goes through a CI/CD pipeline created on AWS using AWS CodeCommit, AWS CodePipeline, AWS CodeBuild, and Amazon ECR.
Our demo has two separate pipelines:
- CI/CD Pipeline to build and push our custom Docker image to Amazon ECR
- CI/CD Pipeline where our tfsec analysis is executed and Terraform provisions infrastructure
The tfsec configuration and Terraform goes through a buildspec specification file defined within an AWS CodeBuild action. This action will calculate how many potential security risks we currently have within our Terraform templates, which will be displayed in our manual acceptance process for verification.
Provisioning the infrastructure
We have created an AWS Cloud Development Kit (AWS CDK) app hosted in a Git Repository written in Python. Here you can deploy the two main pipelines in order to manage this scenario. For a list of the deployment prerequisites, see the README.md file.
Clone the repo in your local machine. Then, bootstrap and deploy the CDK stack:
git clone https://github.com/aws-samples/aws-cdk-tfsec
cd aws-cdk-tfsec
pip install -r requirements.txt
cdk bootstrap aws://account_id/eu-west-1
cdk deploy --all
The infrastructure creation takes around 5-10 minutes due the AWS CodePipelines and referenced repository creation. Once the CDK has deployed the infrastructure, clone the two new AWS CodeCommit repos that have already been created and push the example code. First, one for the custom Docker image, and later for your Terraform code, like this:
git clone https://git-codecommit.eu-west-1.amazonaws.com/v1/repos/awsome-terraform-example-container
cd awsome-terraform-example-container
git checkout -b main
cp repos/docker_image/* .
git add .
git commit -am "First commit"
git push origin main
Once the Docker image is built and pushed to the Amazon ECR, proceed with Terraform repo. Check the pipeline process on the AWS CodePipeline console.
git clone https://git-codecommit.eu-west-1.amazonaws.com/v1/repos/awsome-terraform-example
cd awsome-terraform-example
git checkout -b main
cp -aR repos/terraform_code/* .
git add .
git commit -am "First commit"
git push origin main
The Terraform provisioning AWS CodePipeline has the following aspect:
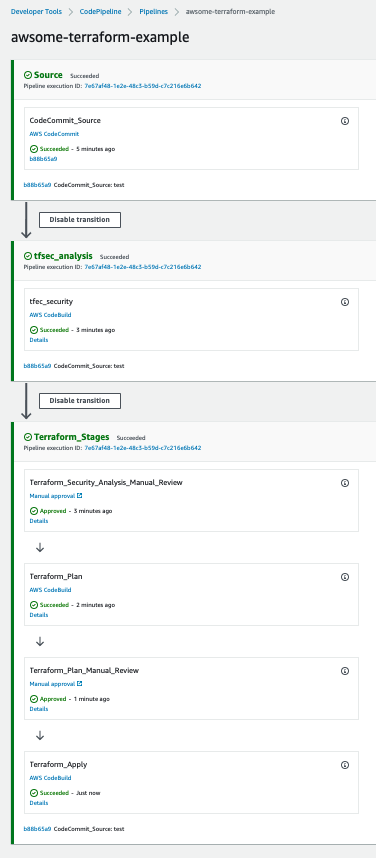
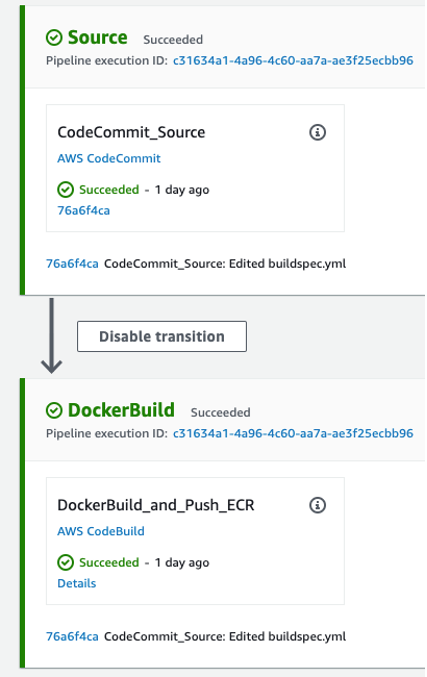
The pipeline has three main stages:
Source – AWS CodeCommit stores the Terraform repository infrastructure and every time we push code to the main branch the AWS CodePipeline will be triggered.
tfsec analysis – AWS CodeBuild looks for a buildspec to execute the tfsec actions configured on the same buildspec.
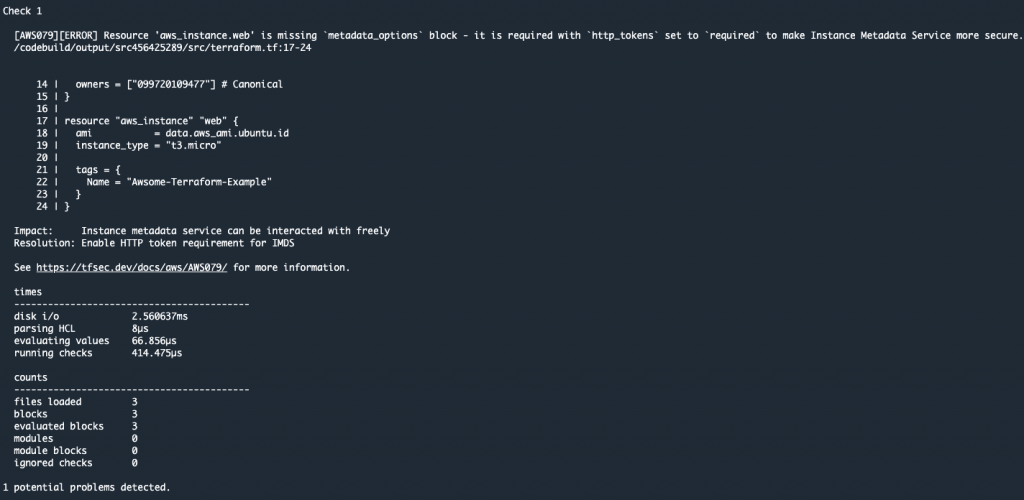
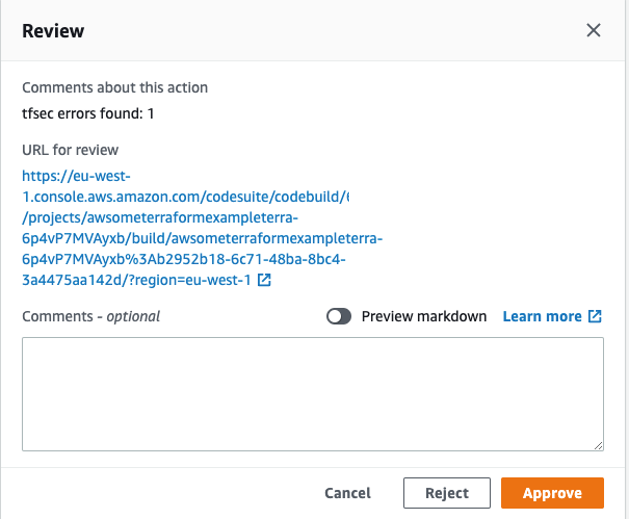
The output shows the potential security issues detected by tfsec for our Terraform code. The output is linking to the different security issues already defined on tfsec. Check the security checks defined by tfsec here. After tfsec execution, a manual approval action is set up to decide if we should go for the next steps or if we reject and stop the AWS CodePipeline execution.
The URL for review is linking to our tfsec output console.
Terraform plan and Terraform apply – This will be applied to our infrastructure plan. After the Terraform plan command and before the Terraform apply, a manual action is set up to decide if we can apply the changes.
After going through all of the stages, our Terraform infrastructure should be created.
Clean up
After completing your demo, feel free to delete your stack using the CDK cli:
cdk destroy --all
Conclusion
At AWS, security is our top priority. This post demonstrates how to build a CI/CD pipeline by using AWS Services to automate and secure your infrastructure as code via Terraform and tfsec.
Learn more about tfsec through the official documentation: https://tfsec.dev/
Blue/Green deployment with AWS Developer tools on Amazon EC2 using Amazon EFS to host application source code
=======================
Many organizations building modern applications require a shared and persistent storage layer for hosting and deploying data-intensive enterprise applications, such as content management systems, media and entertainment, distributed applications like machine learning training, etc. These applications demand a centralized file share that scales to petabytes without disrupting running applications and remains concurrently accessible from potentially thousands of Amazon EC2 instances.
Simultaneously, customers want to automate the end-to-end deployment workflow and leverage continuous methodologies utilizing AWS developer tools services for performing a blue/green deployment with zero downtime. A blue/green deployment is a deployment strategy wherein you create two separate, but identical environments. One environment (blue) is running the current application version, and one environment (green) is running the new application version. The blue/green deployment strategy increases application availability by generally isolating the two application environments and ensuring that spinning up a parallel green environment won’t affect the blue environment resources. This isolation reduces deployment risk by simplifying the rollback process if a deployment fails.
Amazon Elastic File System (Amazon EFS) provides a simple, scalable, and fully-managed elastic NFS file system for use with AWS Cloud services and on-premises resources. It scales on demand, thereby eliminating the need to provision and manage capacity in order to accommodate growth. Utilize Amazon EFS to create a shared directory that stores and serves code and content for numerous applications. Your application can treat a mounted Amazon EFS volume like local storage. This means you don’t have to deploy your application code every time the environment scales up to multiple instances to distribute load.
In this blog post, I will guide you through an automated process to deploy a sample web application on Amazon EC2 instances utilizing Amazon EFS mount to host application source code, and utilizing a blue/green deployment with AWS code suite services in order to deploy the application source code with no downtime.
How this solution works
This blog post includes a CloudFormation template to provision all of the resources needed for this solution. The CloudFormation stack deploys a Hello World application on Amazon Linux 2 EC2 Instances running behind an Application Load Balancer and utilizes Amazon EFS mount point to store the application content. The AWS CodePipeline project utilizes AWS CodeCommit as the version control, AWS CodeBuild for installing dependencies and creating artifacts, and AWS CodeDeploy to conduct deployment on EC2 instances running in an Amazon EC2 Auto Scaling group.
Figure 1 below illustrates our solution architecture.
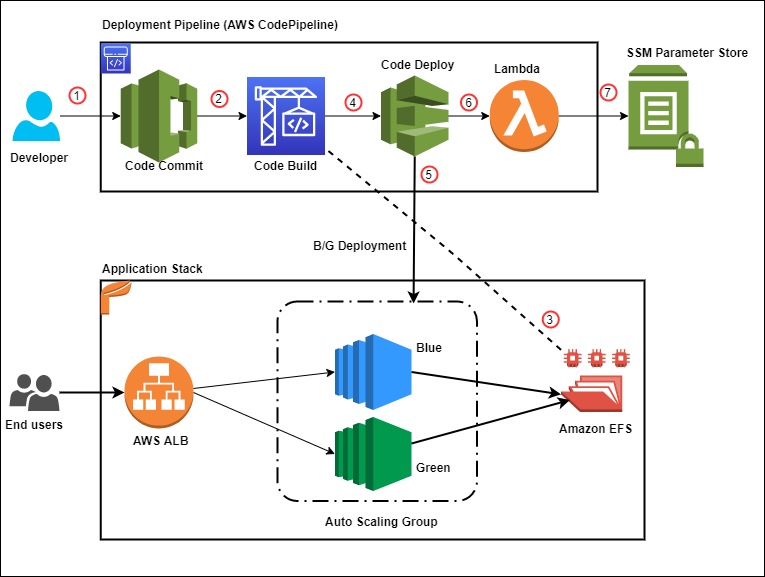
Figure 1: Sample solution architecture
The event flow in Figure 1 is as follows:
- A developer commits code changes from their local repo to the CodeCommit repository. The commit triggers CodePipeline execution.
- CodeBuild execution begins to compile source code, install dependencies, run custom commands, and create deployment artifact as per the instructions in the Build specification reference file.
- During the build phase, CodeBuild copies the source-code artifact to Amazon EFS file system and maintains two different directories for current (green) and new (blue) deployments.
- After successfully completing the build step, CodeDeploy deployment kicks in to conduct a Blue/Green deployment to a new Auto Scaling Group.
- During the deployment phase, CodeDeploy mounts the EFS file system on new EC2 instances as per the CodeDeploy AppSpec file reference and conducts other deployment activities.
- After successful deployment, a Lambda function triggers in order to store a deployment environment parameter in Systems Manager parameter store. The parameter stores the current EFS mount name that the application utilizes.
- The AWS Lambda function updates the parameter value during every successful deployment with the current EFS location.
Prerequisites
For this walkthrough, the following are required:
An AWS account
Access to an AWS account with administrator or PowerUser (or equivalent) AWS Identity and Access Management(IAM) role policies attached
Git Command Line installed and configured in your local environment
Deploy the solution
Once you’ve assembled the prerequisites, download or clone the GitHub repo and store the files on your local machine. Utilize the commands below to clone the repo:
mkdir -p ~/blue-green-sample/
cd ~/blue-green-sample/
git clone https://github.com/aws-samples/blue-green-deployment-pipeline-for-efs
Once completed, utilize the following steps to deploy the solution in your AWS account:
- Create a private Amazon Simple Storage Service (Amazon S3) bucket by using this documentation

Figure 2: AWS S3 console view when creating a bucket
- Upload the cloned or downloaded GitHub repo files to the root of the S3 bucket. the S3 bucket objects structure should look similar to Figure 3:

Figure 3: AWS S3 bucket object structure
- Go to the S3 bucket and select the template name solution-stack-template.yml, and then copy the object URL.
- Open the CloudFormation console. Choose the appropriate AWS Region, and then choose Create Stack. Select With new resources.
- Select Amazon S3 URL as the template source, paste the object URL that you copied in Step 3, and then choose Next.
- On the Specify stack details page, enter a name for the stack and provide the following input parameter. Modify the default values for other parameters in order to customize the solution for your environment. You can leave everything as default for this walkthrough.
ArtifactBucket– The name of the S3 bucket that you created in the first step of the solution deployment. This is a mandatory parameter with no default value.
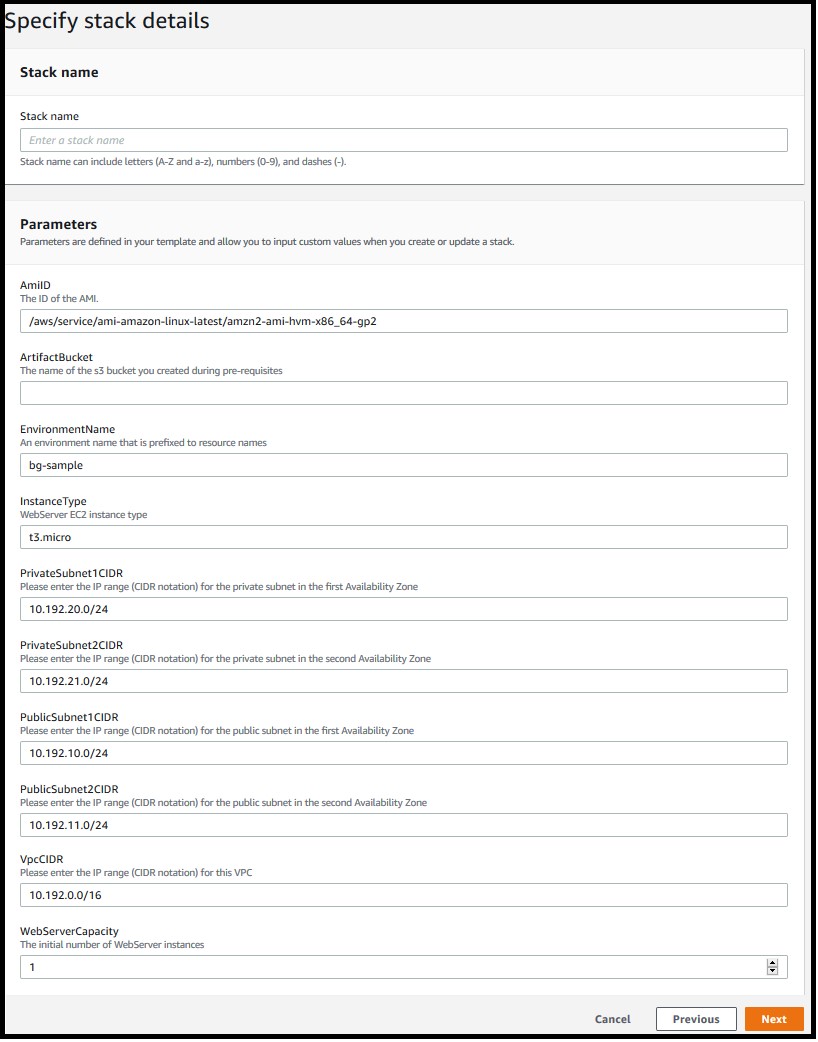
Figure 4: Defining the stack name and input parameters for the CloudFormation stack
- Choose Next.
- On the Options page, keep the default values and then choose Next.
- On the Review page, confirm the details, acknowledge that CloudFormation might create IAM resources with custom names, and then choose Create Stack.
- Once the stack creation is marked as CREATE_COMPLETE, the following resources are created:
A virtual private cloud (VPC) configured with two public and two private subnets.
NAT Gateway, an EIP address, and an Internet Gateway.
Route tables for private and public subnets.
Auto Scaling Group with a single EC2 Instance.
Application Load Balancer and a Target Group.
Three security groups—one each for ALB, web servers, and EFS file system.
Amazon EFS file system with a mount target for each Availability Zone.
CodePipeline project with CodeCommit repository, CodeBuild, and CodeDeploy resources.
SSM parameter to store the environment current deployment status.
Lambda function to update the SSM parameter for every successful pipeline execution.
Required IAM Roles and policies.
Note: It may take anywhere from 10-20 minutes to complete the stack creation.
Test the solution
Now that the solution stack is deployed, follow the steps below to test the solution:
- Validate CodePipeline execution status
After successfully creating the CloudFormation stack, a CodePipeline execution automatically triggers to deploy the default application code version from the CodeCommit repository.
In the AWS console, choose Services and then CloudFormation. Select your stack name. On the stack Outputs tab, look for the CodePipelineURL key and click on the URL.
Validate that all steps have successfully completed. For a successful CodePipeline execution, you should see something like Figure 5. Wait for the execution to complete in case it is still in progress.
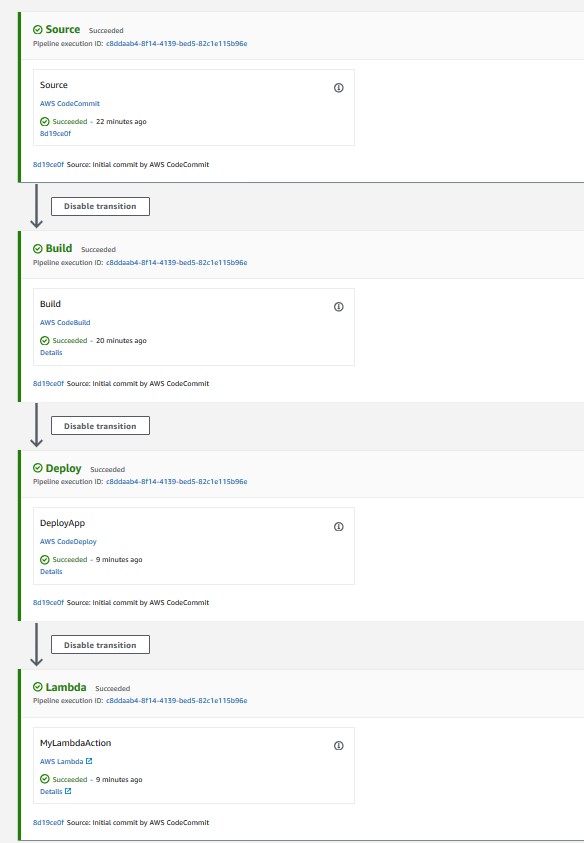
Figure 5: CodePipeline console showing execution status of all stages
- Validate the Website URL
After completing the pipeline execution, hit the website URL on a browser to check if it’s working.
On the stack Outputs tab, look for the WebsiteURL key and click on the URL.
For a successful deployment, it should open a default page similar to Figure 6.
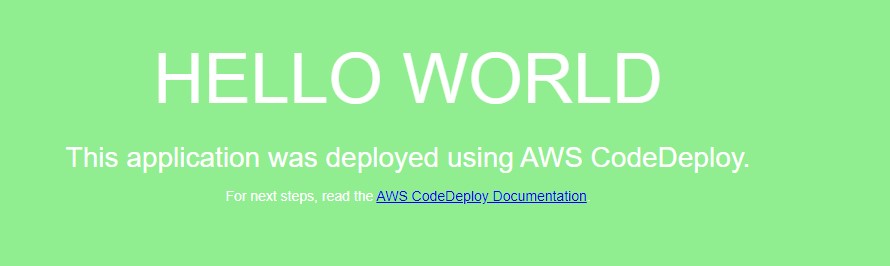
Figure 6: Sample “Hello World” application (Green deployment)
- Validate the EFS share
After the website deployed successfully, we will get into the application server and validate the EFS mount point and the application source code directory.
Open the Amazon EC2 console, and then choose Instances in the left navigation pane.
Select the instance named bg-sample and choose
For Connection method, choose Session Manager, and then choose connect
After the connection is made, run the following bash commands to validate the EFS mount and the deployed content. Figure 7 shows a sample output from running the bash commands.
sudo df –h | grep efs
ls –la /efs/green
ls –la /var/www/
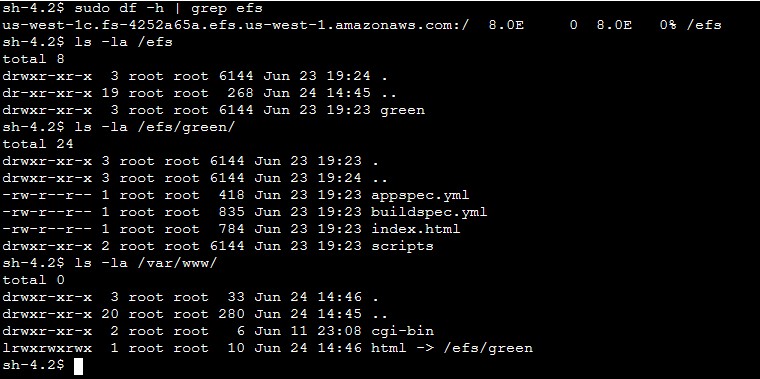
Figure 7: Sample output from the bash command (Green deployment)
- Deploy a new revision of the application code
After verifying the application status and the deployed code on the EFS share, commit some changes to the CodeCommit repository in order to trigger a new deployment.
On the stack Outputs tab, look for the CodeCommitURL key and click on the corresponding URL.
Click on the file html.
Click on
Uncomment line 9 and comment line 10, so that the new lines look like those below after the changes:
background-color: #0188cc;
#background-color: #90ee90;
Add Author name, Email address, and then choose Commit changes.
After you commit the code, the CodePipeline triggers and executes Source, Build, Deploy, and Lambda stages. Once the execution completes, hit the Website URL and you should see a new page like Figure 8.
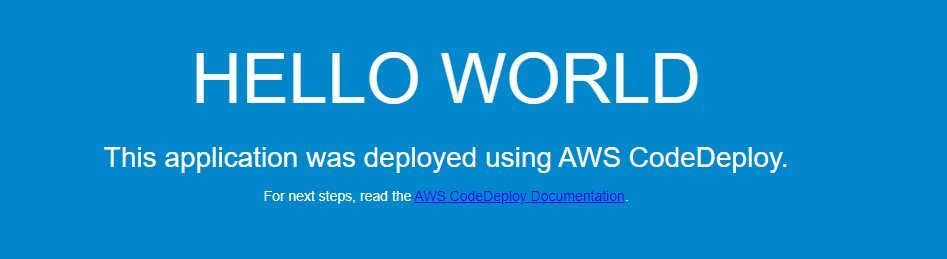
Figure 8: New Application version (Blue deployment)
On the EFS side, the application directory on the new EC2 instance now points to /efs/blue as shown in Figure 9.
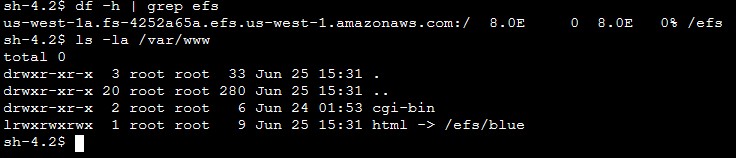
Figure 9: Sample output from the bash command (Blue deployment)
Solution review
Let’s review the pipeline stages details and what happens during the Blue/Green deployment:
1) Build stage
For this sample application, the CodeBuild project is configured to mount the EFS file system and utilize the buildspec.yml file present in the source code root directory to run the build. Following is the sample build spec utilized in this solution:
version: 0.2
phases:
install:
runtime-versions:
php: latest
build:
commands:
- current_deployment=$(aws ssm get-parameter --name $SSM_PARAMETER --query "Parameter.Value" --region $REGION --output text)
- echo $current_deployment
- echo $SSM_PARAMETER
- echo $EFS_ID $REGION
- if [[ "$current_deployment" == "null" ]]; then echo "this is the first GREEN deployment for this project" ; dir='/efs/green' ; fi
- if [[ "$current_deployment" == "green" ]]; then dir='/efs/blue' ; else dir='/efs/green' ; fi
- if [ ! -d $dir ]; then  mkdir $dir >/dev/null 2>&1 ; fi
- echo $dir
- rsync -ar $CODEBUILD_SRC_DIR/ $dir/
artifacts:
files:
- '**/*'
During the build job, the following activities occur:
Installs latest php runtime version.
Reads the SSM parameter value in order to know the current deployment and decide which directory to utilize. The SSM parameter value flips between green and blue for every successful deployment.
Synchronizes the latest source code to the EFS mount point.
Creates artifacts to be utilized in subsequent stages.
Note: Utilize the default buildspec.yml as a reference and customize it further as per your requirement. See this link for more examples.
2) Deploy Stage
The solution is utilizing CodeDeploy blue/green deployment type for EC2/On-premises. The deployment environment is configured to provision a new EC2 Auto Scaling group for every new deployment in order to deploy the new application revision. CodeDeploy creates the new Auto Scaling group by copying the current one. See this link for more details on blue/green deployment configuration with CodeDeploy. During each deployment event, CodeDeploy utilizes the appspec.yml file to run the deployment steps as per the defined life cycle hooks. Following is the sample AppSpec file utilized in this solution.
version: 0.0
os: linux
hooks:
BeforeInstall:
- location: scripts/install_dependencies
timeout: 180
runas: root
AfterInstall:
- location: scripts/app_deployment
timeout: 180
runas: root
BeforeAllowTraffic :
- location: scripts/check_app_status
timeout: 180
runas: root
Note: The scripts mentioned in the AppSpec file are available in the scripts directory of the CodeCommit repository. Utilize these sample scripts as a reference and modify as per your requirement.
For this sample, the following steps are conducted during a deployment:
BeforeInstall:
Installs required packages on the EC2 instance.
Mounts the EFS file system.
Creates a symbolic link to point the apache home directory /var/www/html to the appropriate EFS mount point. It also ensures that the new application version deploys to a different EFS directory without affecting the current running application.
AfterInstall:
Stops apache web server.
Fetches current EFS directory name from Systems Manager.
Runs some clean up commands.
Restarts apache web server.
BeforeAllowTraffic:
Checks application status if running fine.
Exits the deployment with error if the app returns a non 200 HTTP status code.
3) Lambda Stage
After completing the deploy stage, CodePipeline triggers a Lambda function in order to update the SSM parameter value with the updated EFS directory name. This parameter value alternates between “blue” and “green” to help CodePipeline identify the right EFS file system path during the next deployment.
CodeDeploy Blue/Green deployment
Let’s review the sequence of events flow during the CodeDeploy deployment:
- CodeDeploy creates a new Auto Scaling group by copying the original one.
- Provisions a replacement EC2 instance in the new Auto Scaling Group.
- Conducts the deployment on the new instance as per the instructions in the yml file.
- Sets up health checks and redirects traffic to the new instance.
- Terminates the original instance along with the Auto Scaling Group.
- After completing the deployment, it should appear as shown in Figure 10.
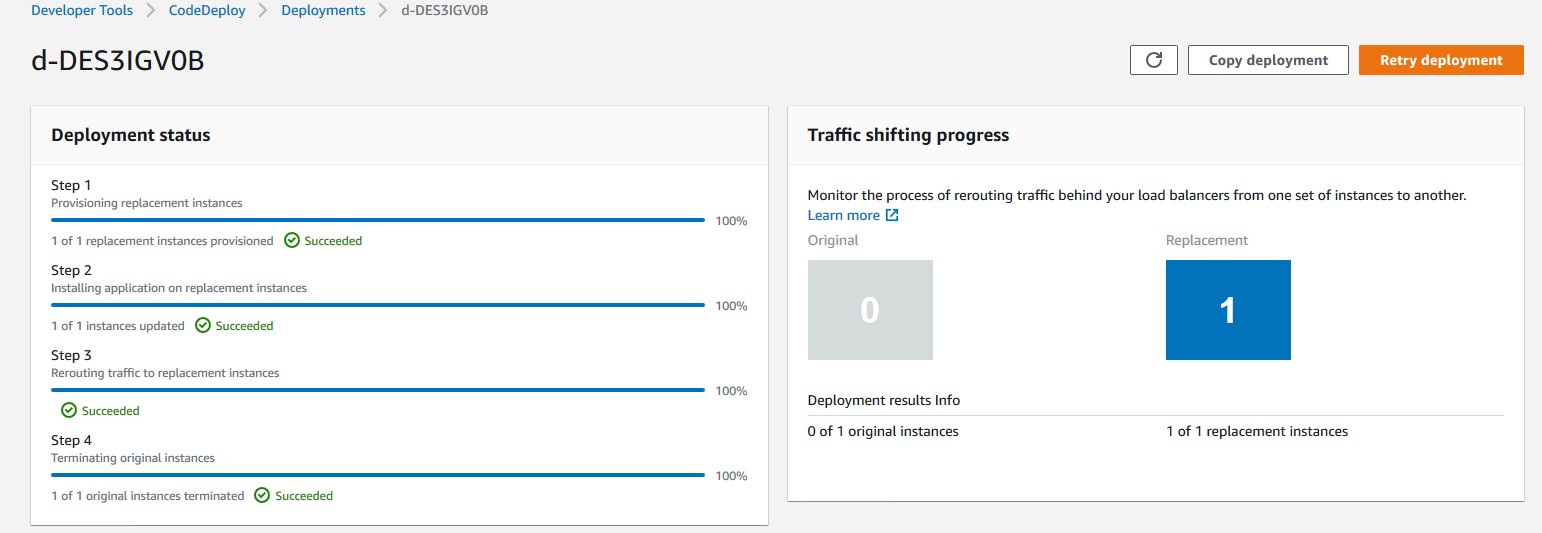
Figure 10: AWS console view of a Blue/Green CodeDeploy deployment on Ec2
Troubleshooting
To troubleshoot any service-related issues, see the following links:
Troubleshooting AWS CloudFormation
Troubleshooting AWS CodePipeline
Troubleshooting AWS CodeDeploy
Troubleshooting AWS CodeCommit
Troubleshooting AWS CodeBuild
Troubleshooting Amazon EFS file system
More information
Now that you have tested the solution, here are some additional points worth noting:
The sample template and code utilized in this blog can work in any AWS region and are mainly intended for demonstration purposes. Utilize the sample as a reference and modify it further as per your requirement.
This solution works with single account, Region, and VPC combination.
For this sample, we have utilized AWS CodeCommit as version control, but you can also utilize any other source supported by AWS CodePipeline like Bitbucket, GitHub, or GitHub Enterprise Server
Clean up
Follow these steps to delete the components and avoid any future incurring charges:
- Open the AWS CloudFormation console.
- On the Stacks page in the CloudFormation console, select the stack that you created for this blog post. The stack must be currently running.
- In the stack details pane, choose Delete.
- Select Delete stack when prompted.
- Empty and delete the S3 bucket created during deployment step 1.
Conclusion
In this blog post, you learned how to set up a complete CI/CD pipeline for conducting a blue/green deployment on EC2 instances utilizing Amazon EFS file share as mount point to host application source code. The EFS share will be the central location hosting your application content, and it will help reduce your overall deployment time by eliminating the need for deploying a new revision on every EC2 instance local storage. It also helps to preserve any dynamically generated content when the life of an EC2 instance ends.
Author bio
 Rakesh Singh
Rakesh is a Senior Technical Account Manager at Amazon. He loves automation and enjoys working directly with customers to solve complex technical issues and provide architectural guidance. Outside of work, he enjoys playing soccer, singing karaoke, and watching thriller movies.
Choosing a Well-Architected CI/CD approach: Open Source on AWS
=======================
Introduction
When building a CI/CD platform, it is important to make an informed decision regarding every underlying tool. This post explores evaluating the criteria for selecting each tool focusing on a balance between meeting functional and non-functional requirements, and maximizing value.
Your first decision: source code management.
Source code is potentially your most valuable asset, and so we start by choosing a source code management tool. These tools normally have high non-functional requirements in order to protect your assets and to ensure they are available to the organization when needed. The requirements usually include demand for high durability, high availability (HA), consistently high throughput, and strong security with role-based access controls.
At the same time, source code management tools normally have many specific functional requirements as well. For example, the ability to provide collaborative code review in the UI, flexible and tunable merge policies including both automated and manual gates (code checks), and out-of-box UI-level integrations with numerous other tools. These kinds of integrations can include enabling monitoring, CI, chats, and agile project management.
Many teams also treat source code management tools as their portal into other CI/CD tools. They make them shareable between teams, and might prefer to stay within one single context and user interface throughout the entire DevOps cycle. Many source code management tools are actually a stack of services that support multiple steps of your CI/CD workflows from within a single UI. This makes them an excellent starting point for building your CI/CD platforms.
The first decision your need to make is whether to go with an open source solution for managing code or with AWS-managed solutions, such as AWS CodeCommit. Open source solutions include (but are not limited to) the following: Gerrit, Gitlab, Gogs, and Phabricator.
You decision will be influenced by the amount of benefit your team can gain from the flexibility provided through open source, and how well your team can support deploying and managing these solutions. You will also need to consider the infrastructure and management overhead cost.
Engineering teams that have the capacity to develop their own plugins for their CI/CD platforms, or whom even contribute directly to open source projects, will often prefer open source solutions for the flexibility they provide. This will be especially true if they are fluent in designing and supporting their own cloud infrastructure. If the team gets more value by trading the flexibility of open source for not having to worry about managing infrastructure (especially if High Availability, Scalability, Durability, and Security are more critical) an AWS-managed solution would be a better choice.
Source Code Management Solution
When the choice is made in favor of an open-source code management solution (such as Gitlab), the next decision will be how to architect the deployment. Will the team deploy to a single instance, or design for high availability, durability, and scalability? Teams that want to design Gitlab for HA can use the following guide to proceed: Installing GitLab on Amazon Web Services (AWS)
By adopting AWS services (such as Amazon RDS, Amazon ElastiCache for Redis, and Autoscaling Groups), you can lower the management burden of supporting the underlying infrastructure in this self-managed HA scenario.

High level overview of self-managed HA Gitlab deployment
Your second decision: Continuous Integration engine
Selecting your CI engine, you might be able to benefit from additional features of previously selected solutions. Gitlab provides both source control services, as well as built-in CI tools, called Gitlab CI. Gitlab Runners are responsible for running CI jobs, and the actual jobs are described as YML files stored in Gitlab’s git repository along with product code. For security and performance reasons, GitLab Runners should be on resources separate from your GitLab instance.
You could manage those resources or you could use one of the AWS services that can support deploying and managing Runners. The use of an on-demand service removes the expense of implementing and managing a capability that is undifferentiated heavy lifting for you. This provides cost optimization and enables operational excellence. You pay for what you use and the service team manages the underlying service.
Continuous Integration engine Solution
In an architecture example (below), Gitlab Runners are deployed in containers running on Amazon EKS. The team has less infrastructure to manage, can start focusing on development faster by not having to implement the capability, and can provision resources in an optimal way for their on-demand needs.
To further optimize costs, you can use EC2 Spot Instances for your EKS nodes. CI jobs are normally compute intensive and limited in run time. The runner jobs can easily be restarted on a different resource with little impact. This makes them tolerant of failure and the use of EC2 Spot instances very appealing. Amazon EKS and Spot Instances are supported out-of-box in Gitlab. As a result there is no integration to develop, only configuration is required.
To support infrastructure as code best practices, Runners are deployed with Helm and are stored and versioned as Helm charts. All of the infrastructure as code information used to implement the CI/CD platform itself is stored in templates such as Terraform.

High level overview of Infrastructure as Code on Gitlab and Gitlab CI
Your third decision: Container Registry
You will be unable to deploy Runners if the container images are not available. As a result, the primary non-functional requirements for your production container registry are likely to include high availability, durability, transparent scalability, and security. At the same time, your functional requirements for a container registry might be lower. It might be sufficient to have a simple UI, and simple APIs supporting basic flows. Customers looking for a managed solution can use Amazon ECR, which is OCI compliant and supports Helm Charts.
Container Registry Solution
For this set of requirements, the flexibility and feature velocity of open source tools does not provide an advantage. Self-supporting high availability and strengthened security could be costly in implementation time and long-term management. Based on [Blog post 1 Diagram 1], an AWS-managed solution provides cost advantages and has no management overhead. In this case, an AWS-managed solution is a better choice for your container registry than an open-source solution hosted on AWS. In this example, Amazon ECR is selected. Customers who prefer to go with open-source container registries might consider solutions like Harbor.

High level overview of Gitlab CI with Amazon ECR
Additional Considerations
Now that the main services for the CI/CD platform are selected, we will take a high level look at additional important considerations. You need to make sure you have observability into both infrastructure and applications, that backup tools and policies are in place, and that security needs are addressed.
There are many mechanisms to strengthen security including the use of security groups. Use IAM for granular permission control. Robust policies can limit the exposure of your resources and control the flow of traffic. Implement policies to prevent your assets leaving your CI environment inappropriately. To protect sensitive data, such as worker secrets, encrypt these assets while in transit and at rest. Select a key management solution to reduce your operational burden and to support these activities such as AWS Key Management Service (AWS KMS). To deliver secure and compliant application changes rapidly while running operations consistently with automation, implement DevSecOps.
Amazon S3 is durable, secure, and highly available by design making it the preferred choice to store EBS-level backups by many customers. Amazon S3 satisfies the non-functional requirements for a backup store. It also supports versioning and tiered storage classes, making it a cost-effective as well.
Your observability requirements may emphasize versatility and flexibility for application-level monitoring. Using Amazon CloudWatch to monitor your infrastructure and then extending your capabilities through an open-source solutions such as Prometheus may be advantageous. You can get many of the benefits of both open-source Prometheus and AWS services with Amazon Managed Service for Prometheus (AMP). For interactive visualization of metrics, many customers choose solutions such as open-source Grafana, available as an AWS service Amazon Managed Service for Grafana (AMG).

CI/CD Platform with Gitlab and AWS
Conclusion
We have covered how making informed decisions can maximize value and synergy between open-source solutions on AWS, such as Gitlab, and AWS-managed services, such as Amazon EKS and Amazon ECR. You can find the right balance of open-source tools and AWS services that will meet your functional and non-functional requirements, and help maximizing the value you get from those resources.
Pete Goldberg, Director of Partnerships at GitLab: “When aligning your development process to AWS Well Architected Framework, GitLab allows customers to build and automate processes to achieve Operational Excellence. As a single tool designed to facilitate collaboration across the organization, GitLab simplifies the process to follow the Fully Separated Operating Model where Engineering and Operations come together via automated processes that remove the historical barriers between the groups. This gives organizations the ability to efficiently and rapidly deploy new features and applications that drive the business while providing the risk mitigation and compliance they require. By allowing operations teams to define infrastructure as code in the same tool that the engineering teams are storing application code, and allowing your automation bring those together for your CI/CD workflows companies can move faster while having compliance and controls built-in, providing the entire organization greater transparency. With GitLab’s integrations with different AWS compute options (EC2, Lambda, Fargate, ECS or EKS), customers can choose the best type of compute for the job without sacrificing the controls required to maintain Operational Excellence.”
Author bio
 Mikhail is a Solutions Architect for RUS-CIS. Mikhail supports customers on their cloud journeys with Well-architected best practices and adoption of DevOps techniques on AWS. Mikhail is a fan of ChatOps, Open Source on AWS and Operational Excellence design principles.
Use the Snyk CLI to scan Python packages using AWS CodeCommit, AWS CodePipeline, and AWS CodeBuild
=======================
One of the primary advantages of working in the cloud is achieving agility in product development. You can adopt practices like continuous integration and continuous delivery (CI/CD) and GitOps to increase your ability to release code at quicker iterations. Development models like these demand agility from security teams as well. This means your security team has to provide the tooling and visibility to developers for them to fix security vulnerabilities as quickly as possible.
Vulnerabilities in cloud-native applications can be roughly classified into infrastructure misconfigurations and application vulnerabilities. In this post, we focus on enabling developers to scan vulnerable data around Python open-source packages using the Snyk Command Line Interface (CLI).
The world of package dependencies
Traditionally, code scanning is performed by the security team; they either ship the code to the scanning instance, or in some cases ship it to the vendor for vulnerability scanning. After the vendor finishes the scan, the results are provided to the security team and forwarded to the developer. The end-to-end process of organizing the repositories, sending the code to security team for scanning, getting results back, and remediating them is counterproductive to the agility of working in the cloud.
Let’s take an example of package A, which uses package B and C. To scan package A, you scan package B and C as well. Similar to package A having dependencies on B and C, packages B and C can have their individual dependencies too. So the dependencies for each package get complex and cumbersome to scan over time. The ideal method is to scan all the dependencies in one go, without having manual intervention to understand the dependencies between packages.
Building on the foundation of GitOps and Gitflow
GitOps was introduced in 2017 by Weaveworks as a DevOps model to implement continuous deployment for cloud-native applications. It focuses on the developer ability to ship code faster. Because security is a non-negotiable piece of any application, this solution includes security as part of the deployment process. We define the Snyk scanner as declarative and immutable AWS Cloud Development Kit (AWS CDK) code, which instructs new Python code committed to the repository to be scanned.
Another continuous delivery practice that we base this solution on is Gitflow. Gitflow is a strict branching model that enables project release by enforcing a framework for managing Git projects. As a brief introduction on Gitflow, typically you have a main branch, which is the code sent to production, and you have a development branch where new code is committed. After the code in development branch passes all tests, it’s merged to the main branch, thereby becoming the code in production. In this solution, we aim to provide this scanning capability in all your branches, providing security observability through your entire Gitflow.
AWS services used in this solution
We use the following AWS services as part of this solution:
AWS CDK – The AWS CDK is an open-source software development framework to define your cloud application resources using familiar programming languages. In this solution, we use Python to write our AWS CDK code.
AWS CodeBuild – CodeBuild is a fully managed build service in the cloud. CodeBuild compiles your source code, runs unit tests, and produces artifacts that are ready to deploy. CodeBuild eliminates the need to provision, manage, and scale your own build servers.
AWS CodeCommit – CodeCommit is a fully managed source control service that hosts secure Git-based repositories. It makes it easy for teams to collaborate on code in a secure and highly scalable ecosystem. CodeCommit eliminates the need to operate your own source control system or worry about scaling its infrastructure. You can use CodeCommit to securely store anything from source code to binaries, and it works seamlessly with your existing Git tools.
AWS CodePipeline – CodePipeline is a continuous delivery service you can use to model, visualize, and automate the steps required to release your software. You can quickly model and configure the different stages of a software release process. CodePipeline automates the steps required to release your software changes continuously.
Amazon EventBridge – EventBridge rules deliver a near-real-time stream of system events that describe changes in AWS resources. With simple rules that you can quickly set up, you can match events and route them to one or more target functions or streams.
AWS Systems Manager Parameter Store – Parameter Store, a capability of AWS Systems Manager, provides secure, hierarchical storage for configuration data management and secrets management. You can store data such as passwords, database strings, Amazon Machine Image (AMI) IDs, and license codes as parameter values.
Prerequisites
Before you get started, make sure you have the following prerequisites:
An AWS account (use a Region that supports CodeCommit, CodeBuild, Parameter Store, and CodePipeline)
A Snyk account
An existing CodeCommit repository you want to test on
Architecture overview
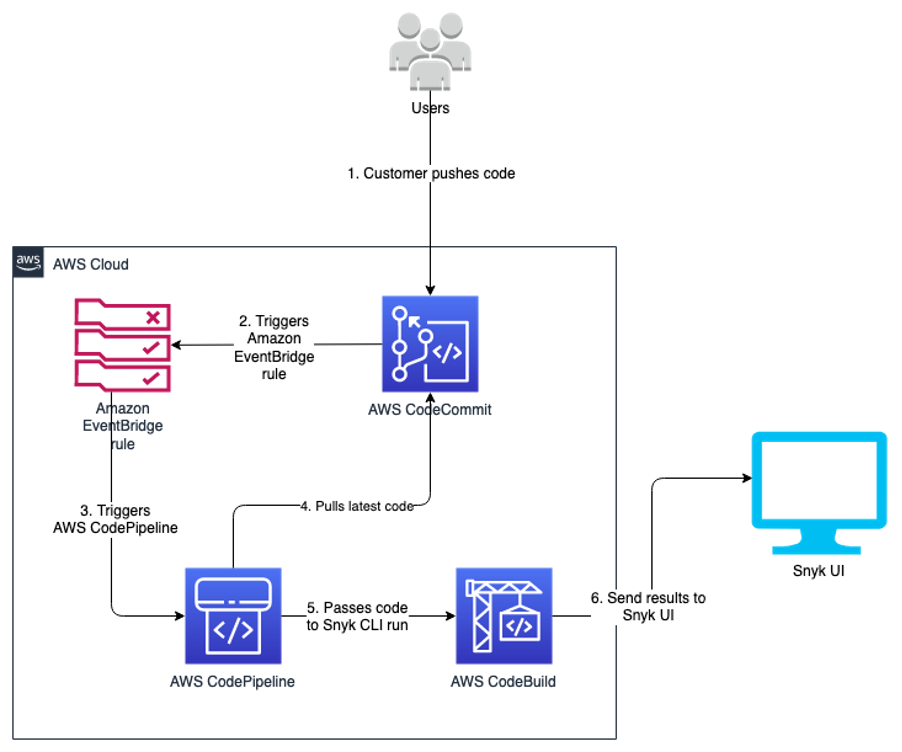
After you complete the steps in this post, you will have a working pipeline that scans your Python code for open-source vulnerabilities.
We use the Snyk CLI, which is available to customers on all plans, including the Free Tier, and provides the ability to programmatically scan repositories for vulnerabilities in open-source dependencies as well as base image recommendations for container images. The following reference architecture represents a general workflow of how Snyk performs the scan in an automated manner. The design uses DevSecOps principles of automation, event-driven triggers, and keeping humans out of the loop for its run.
As developers keep working on their code, they continue to commit their code to the CodeCommit repository. Upon each commit, a CodeCommit API call is generated, which is then captured using the EventBridge rule. You can customize this event rule for a specific event or feature branch you want to trigger the pipeline for.
When the developer commits code to the specified branch, that EventBridge event rule triggers a CodePipeline pipeline. This pipeline has a build stage using CodeBuild. This stage interacts with the Snyk CLI, and uses the token stored in Parameter Store. The Snyk CLI uses this token as authentication and starts scanning the latest code committed to the repository. When the scan is complete, you can review the results on the Snyk console.
This code is built for Python pip packages. You can edit the buildspec.yml to incorporate for any other language that Snyk supports.
The following diagram illustrates our architecture.
Code overview
The code in this post is written using the AWS CDK in Python. If you’re not familiar with the AWS CDK, we recommend reading Getting started with AWS CDK before you customize and deploy the code.
Repository URL: https://github.com/aws-samples/aws-cdk-codecommit-snyk
This AWS CDK construct uses the Snyk CLI within the CodeBuild job in the pipeline to scan the Python packages for open-source package vulnerabilities. The construct uses CodePipeline to create a two-stage pipeline: one source, and one build (the Snyk scan stage). The construct takes the input of the CodeCommit repository you want to scan, the Snyk organization ID, and Snyk auth token.
Resources deployed
This solution deploys the following resources:
An EventBridge rule
A CodeBuild project
Four AWS Identity and Access Management (IAM) roles with inline policies
A CodePipeline pipeline
An Amazon Simple Storage Service (Amazon S3) bucket
An AWS Key Management Service (AWS KMS) key and alias
For the deployment, we use the AWS CDK construct in the codebase cdk_snyk_construct/cdk_snyk_construct_stack.py in the AWS CDK stack cdk-snyk-stack. The construct requires the following parameters:
ARN of the CodeCommit repo you want to scan
Name of the repository branch you want to be monitored
Parameter Store name of the Snyk organization ID
Parameter Store name for the Snyk auth token
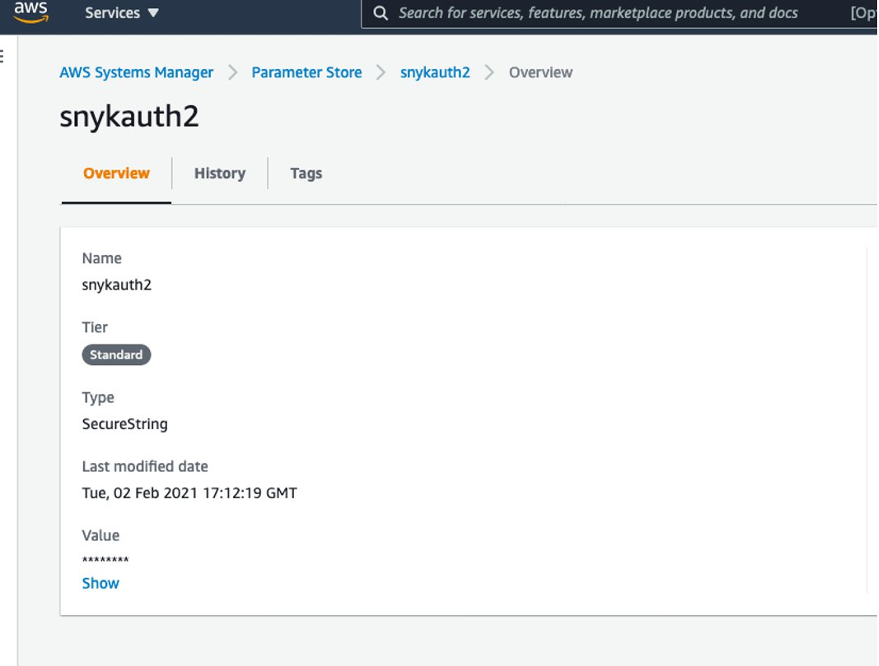
Set up the organization ID and auth token before deploying the stack. Because these are confidential and sensitive data, you should deploy them as a separate stack or manual process. In this solution, the parameters have been stored as a SecureString parameter type and encrypted using the AWS-managed KMS key.
You create the organization ID and auth token on the Snyk console. On the Settings page, choose General in the navigation page to add these parameters.
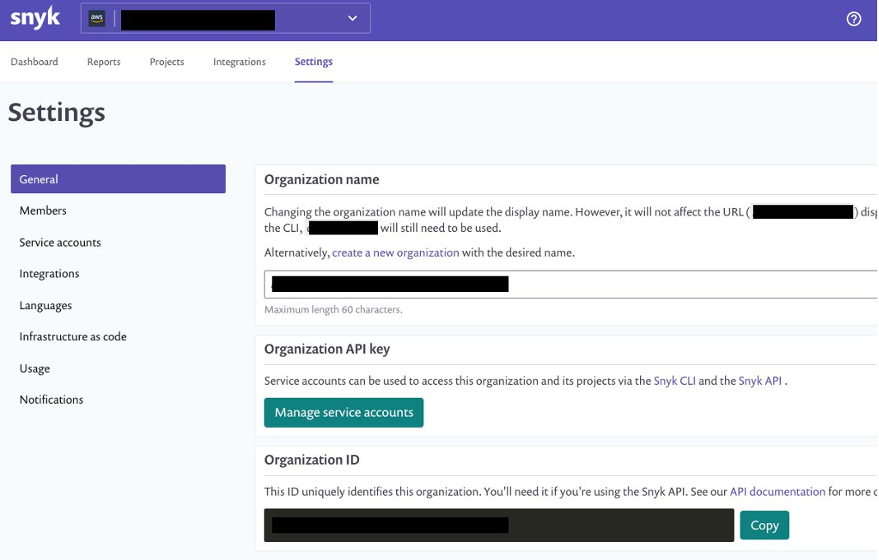
You can retrieve the names of the parameters on the Systems Manager console by navigating to Parameter Store and finding the name on the Overview tab.
Create a requirements.txt file in the CodeCommit repository
We now create a repository in CodeCommit to store the code. For simplicity, we primarily store the requirements.txt file in our repository. In Python, a requirements file stores the packages that are used. Having clearly defined packages and versions makes it easier for development, especially in virtual environments.
For more information on the requirements file in Python, see Requirement Specifiers.
To create a CodeCommit repository, run the following AWS Command Line Interface (AWS CLI) command in your AWS accounts:
aws codecommit create-repository --repository-name snyk-repo \
--repository-description "Repository for Snyk to scan Python packages"
Now let’s create a branch called main in the repository using the following command:
aws codecommit create-branch --repository-name snyk-repo \
--branch-name main
After you create the repository, commit a file named requirements.txt with the following content. The following packages are pinned to a particular version that they have a vulnerability with. This file is our hypothetical vulnerable set of packages that have been committed into your development code.
PyYAML==5.3.1
Pillow==7.1.2
pylint==2.5.3
urllib3==1.25.8
For instructions on committing files in CodeCommit, see Connect to an AWS CodeCommit repository.
When you store the Snyk auth token and organization ID in Parameter Store, note the parameter names—you need to pass them as parameters during the deployment step.
Now clone the CDK code from the GitHub repository with the command below:
git clone https://github.com/aws-samples/aws-cdk-codecommit-snyk.git
After the cloning is complete you should see a directory named aws-cdk-codecommit-snyk on your machine.
When you’re ready to deploy, enter the aws-cdk-codecommit-snyk directory, and run the following command with the appropriate values:
cdk deploy cdk-snyk-stack \
--parameters RepoName=<name-of-codecommit-repo> \
--parameters RepoBranch=<branch-to-be-scanned> \
--parameters SnykOrgId=<value> \
--parameters SnykAuthToken=<value>
After the stack deployment is complete, you can see a new pipeline in your AWS account, which is configured to be triggered every time a commit occurs on the main branch.
You can view the results of the scan on the Snyk console. After the pipeline runs, log in to snyk.io and you should see a project named as per your repository (see the following screenshot).
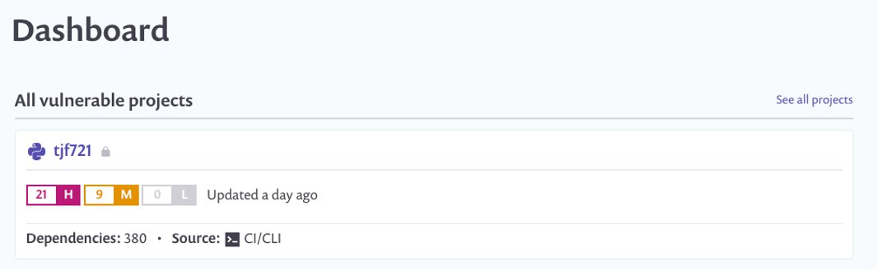
Choose the repo name to get a detailed view of the vulnerabilities found. Depending on what packages you put in your requirements.txt, your report will differ from the following screenshot.
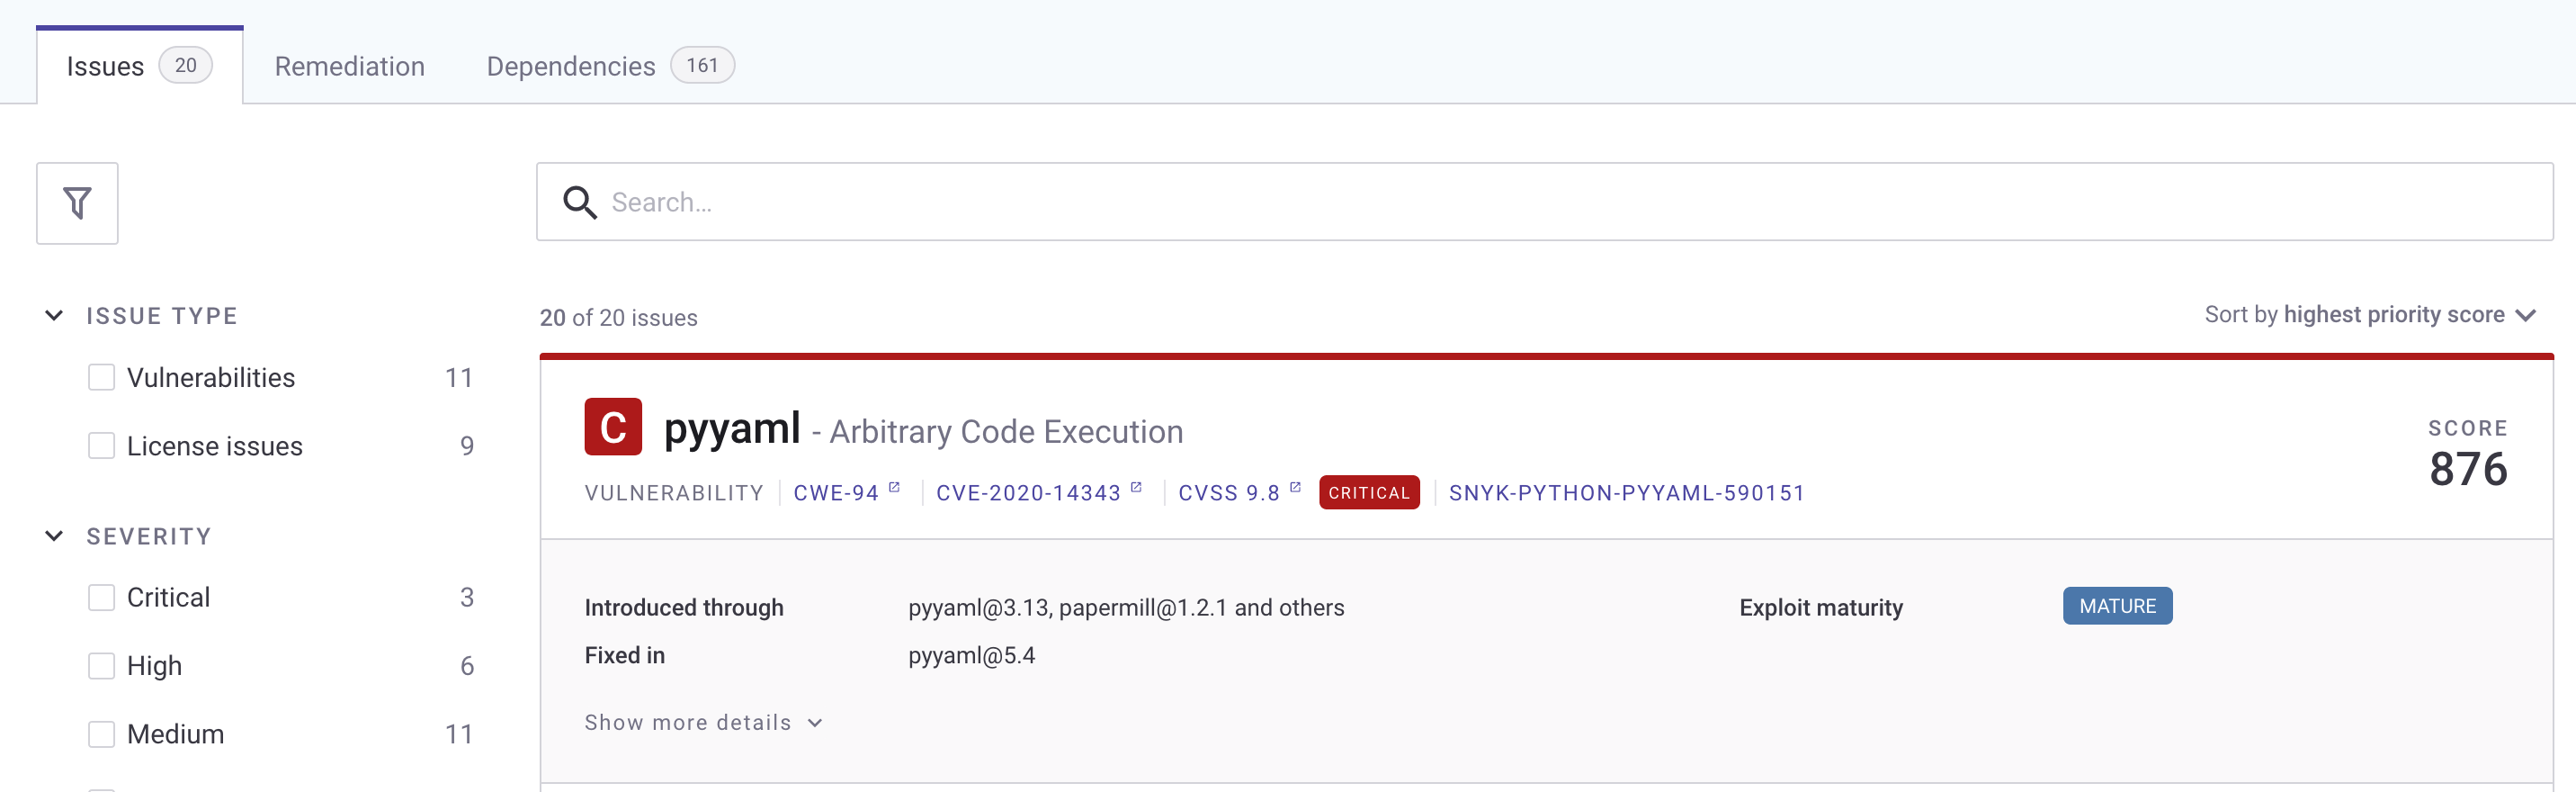
To fix the vulnerability identified, you can change the version of these packages in the requirements.txt file. The edited requirements file should look like the following:
PyYAML==5.4
Pillow==8.2.0
pylint==2.6.1
urllib3==1.25.9
After you update the requirements.txt file in your repository, push your changes back to the CodeCommit repository you created earlier on the main branch. The push starts the pipeline again.
After the commit is performed to the targeted branch, you don’t see the vulnerability reported on the Snyk dashboard because the pinned version 5.4 doesn’t contain that vulnerability.
Clean up
To avoid accruing further cost for the resources deployed in this solution, run cdk destroy to remove all the AWS resources you deployed through CDK.
As the CodeCommit repository was created using AWS CLI, the following command deletes the CodeCommit repository:
aws codecommit delete-repository --repository-name snyk-repo
Conclusion
In this post, we provided a solution so developers can self- remediate vulnerabilities in their code by monitoring it through Snyk. This solution provides observability, agility, and security for your Python application by following DevOps principles.
A similar architecture has been used at NFL to shift-left the security of their code. According to the shift-left design principle, security should be moved closer to the developers to identify and remediate security issues earlier in the development cycle. NFL has implemented a similar architecture which made the total process, from committing code on the branch to remediating 15 times faster than their previous code scanning setup.
Here’s what NFL has to say about their experience:
“NFL used Snyk to scan Python packages for a service launch. Traditionally it would have taken 10days to scan the packages through our existing process but with Snyk we were able to follow DevSecOps principles and get the scans completed, and reviewed within matter of days. This simplified our time to market while maintaining visibility into our security posture.” – Joe Steinke (Director, Data Solution Architect)
Building a centralized Amazon CodeGuru Profiler dashboard for multi-account scenarios
=======================
Amazon CodeGuru is a machine learning service for development teams who want to automate code reviews, identify the most expensive lines of code in their applications, and receive intelligent recommendations on how to fix or improve their code. CodeGuru has two components: CodeGuru Profiler and CodeGuru Reviewer.
CodeGuru Profiler searches for application performance optimizations and recommends ways to fix issues such as excessive recreation of expensive objects, expensive deserialization, usage of inefficient libraries, and excessive logging. CodeGuru Profiler runs continuously, consuming minimal CPU capacity so it doesn’t significantly impact application performance. You can run an agent or import libraries into your application and send the data collected to CodeGuru, and review the findings on the CodeGuru console.
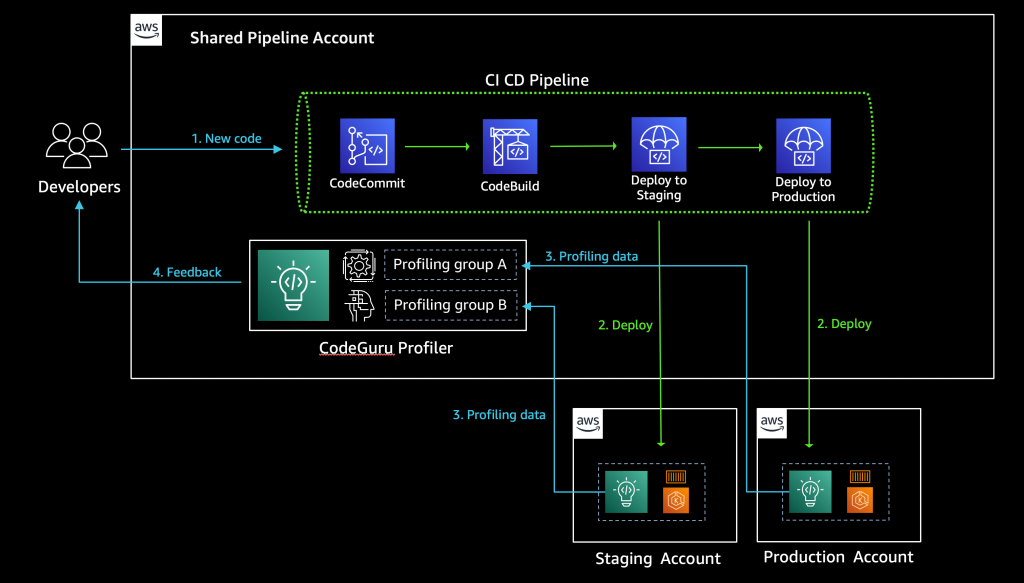
As a best practice, AWS recommends a multi-account strategy for your cloud environment. See Benefits of using multiple AWS accounts for additional details. In this scenario, your CI/CD pipeline deploys your application on the multiple software development lifecycle (SDLC) and production accounts. As a consequence, you’d have one CodeGuru Profiler dashboard per account, which makes it hard for developers to analyze the applications’ performance. This post shows you how to configure CodeGuru Profiler to collect multiple applications’ profiling data into a central account and review the applications’ performance data on one dashboard.
See the diagram below for a typical CI/CD pipeline on multi-account environment, and a central CodeGuru Profiler dashboard:
Solution overview
The benefits of sending CodeGuru profiling data to a central AWS account within the same region is that it gives you a single pane of glass to review all of CodeGuru Profiler’s findings and recommendations in one place. At the time of this writing, we don’t recommend sending CodeGuru profiling data across regions. Additionally, we show you how to configure the AWS Identity and Access Management (IAM) roles to assume a cross-account role when running pods on Amazon Elastic Kubernetes Service (Amazon EKS) with OpenID Connect (OIDC), as well as how to configure IAM roles to allow access when using other resources, such as Amazon Elastic Compute Cloud (EC2). On this solution we discuss how to enable the CodeGuru agent within your code, but it’s also possible enable the agent with no code changes. For more information, see Enable the agent from the command line.
The following diagram illustrates our architecture.
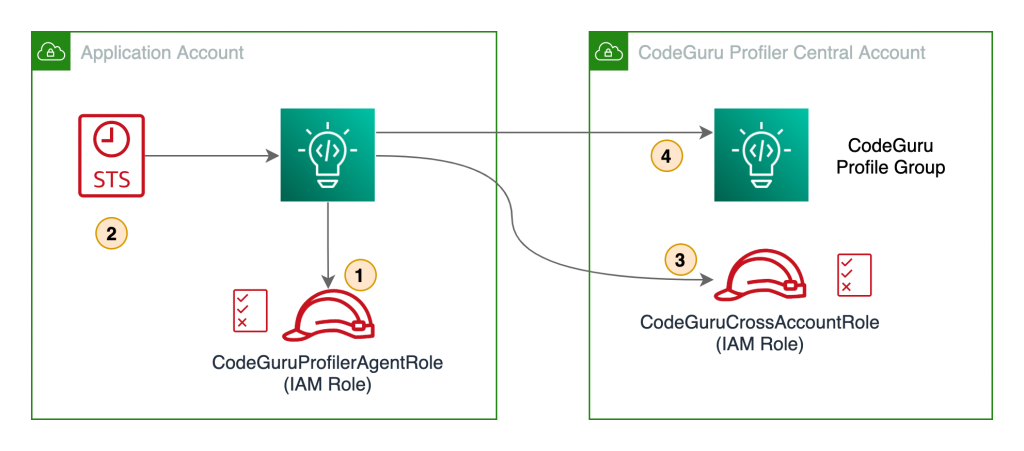
Our solution has the following components:
- The application in the application account assumes the
CodeGuruProfilerAgentRole IAM role. This IAM role has a policy that allows the application to assume the role in the CodeGuru Profiler central account.
- AWS Security Token Service (AWS STS) returns temporary credentials required to assume the IAM role in the central account.
- The application assumes the
CodeGuruCrossAccountRole IAM role in the central account.
- The application using the
CodeGuruCrossAccountRole role sends CodeGuru Profiler data to the central account.
Prerequisites
Before getting started, you must have the following requirements:
Two AWS accounts:
Central account – Where the single pane of glass to review all of CodeGuru Profiler’s findings and recommendations resides. The applications from all the other AWS accounts send profiling data to CodeGuru Profiler in the central account.
Application account – The dedicated account where the profiled application resides.
Install and authenticate the AWS Command Line Interface (AWS CLI). You can authenticate with an IAM user or AWS STS token.
If you’re using Amazon EKS, you need the following installed:
kubectl – The Kubernetes command line tool.
eksctl – The Amazon EKS command line tool.
Walkthrough overview
At the time of this writing, CodeGuru supports two programming languages: Python and Java. Each language has a different configuration for sending CodeGuru profiling data to a different AWS account.
Let’s consider a use case where we have two applications that we want to configure to send CodeGuru profiling data to a centralized account. The first application is running Python 3.x and the other application is running Java on JRE 1.8. We need to configure two IAM roles, one in the application account and one in the central account.
We complete the following steps:
- Configure the IAM roles and policies.
- Configure the CodeGuru profiling groups.
- Configure your Java application to send profiling data to the central account.
- Configure your Python application to send profiling data to the central account.
- Configure IAM with Amazon EKS.
- Review findings and recommendations on the CodeGuru Profiler dashboard.
Configuring IAM roles and policies
To allow a CodeGuru Profiler agent on the application account to send profiling information to CodeGuru Profiler on the central account, we need to create a cross-account IAM role in the central account that the CodeGuru Profiler agent can assume. We also need to attach a policy with the necessary privileges to the cross-account role, and configure a role in the application account to allow assuming the cross-account role in the central account.
First, we must configure a cross-account IAM role in the central account that the CodeGuru Profiler agent in the application account assumes. We can create a role called CodeGuruCrossAccountRole on the central account, and assign the IAM trusted entity to allow the CodeGuru Profiler agent to assume the role from the application account. For more information, see IAM tutorial: Delegate access across AWS accounts using IAM roles. The CodeGuruCrossAccountRole trust relationship should look like the following code:
{
  "Version": "2012-10-17",
  "Statement": [
    {
      "Effect": "Allow",
      "Principal": {
        "AWS": "arn:aws:iam::<APPLICATION_ACCOUNT_ID>:role/<CODEGURU_PROFILER_AGENT_ROLE_NAME>"
      },
      "Action": "sts:AssumeRole"
    }
  ]
}
After that, we need to attach an AWS managed policy called AmazonCodeGuruProfilerAgentAccess to the CodeGuruCrossAccountRole role. It allows the CodeGuru Profiler agent to send data to the two profiling groups we configure in the next step. For more fine-grained access control, you can create your own IAM policy to allow sending data only to the two specific profiling groups we create. The following code is an example IAM policy that allows a CodeGuru Profiler agent to send profiler data to two profiling groups:
{
  "Version": "2012-10-17",
  "Statement": [{
    "Effect": "Allow",
    "Action": [
      "codeguru-profiler:ConfigureAgent",
      "codeguru-profiler:PostAgentProfile"
    ],
    "Resource": [
        "arn:aws:codeguru-profiler:eu-west-1:<CODEGURU_CENTRAL_ACCOUNT_ID>:profilingGroup/
        JavaAppProfilingGroup",
        "arn:aws:codeguru-profiler:eu-west-1:<CODEGURU_CENTRAL_ACCOUNT_ID>:profilingGroup/
        PythonAppProfilingGroup"
    ]
  }]
}
Here are the IAM policy actions that CodeGuru Profiler requires:
codeguru-profiler:ConfigureAgent grants permission for an agent to register with the orchestration service and retrieve profiling configuration information.
codeguru-profiler:PostAgentProfile grants permission to submit a profile collected by an agent belonging to a specific profiling group for aggregation.
Last, we need to configure the CodeGuruProfilerAgentRole IAM role in the application account with an IAM policy that allows the application to assume the role in the central account:
{
  "Version": "2012-10-17",
  "Statement": [{
    "Effect": "Allow",
    "Action": "sts:AssumeRole",
    "Resource": "arn:aws:iam::<CODEGURU_CENTRAL_ACCOUNT_ID>:role/CodeGuruCrossAccountRole
  }]
}
To apply this IAM policy to the CodeGuruProfilerAgentRole IAM role, the IAM role needs to be created depending on the platform you are running, such as Amazon Elastic Compute Cloud (Amazon EC2), AWS Lambda, or Amazon EKS. In this post, we discuss how to configure IAM roles for Amazon EKS. For information about IAM roles for Amazon EC2 and Lambda, see IAM roles for Amazon EC2 and AWS Lambda execution role, respectively.
Configuring the CodeGuru profiling groups
Now we need to create two CodeGuru profiling groups on the central account: one for our Java application and one for our Python application. For this post, we just demonstrate the steps for configuring the Python application.
- On the CodeGuru console, under Profiler, choose Profiling groups.
- Choose Create profiling group.
- For Name, enter a name (for this post, we use PythonAppProfilingGroup).
- For Compute platform, select Other.
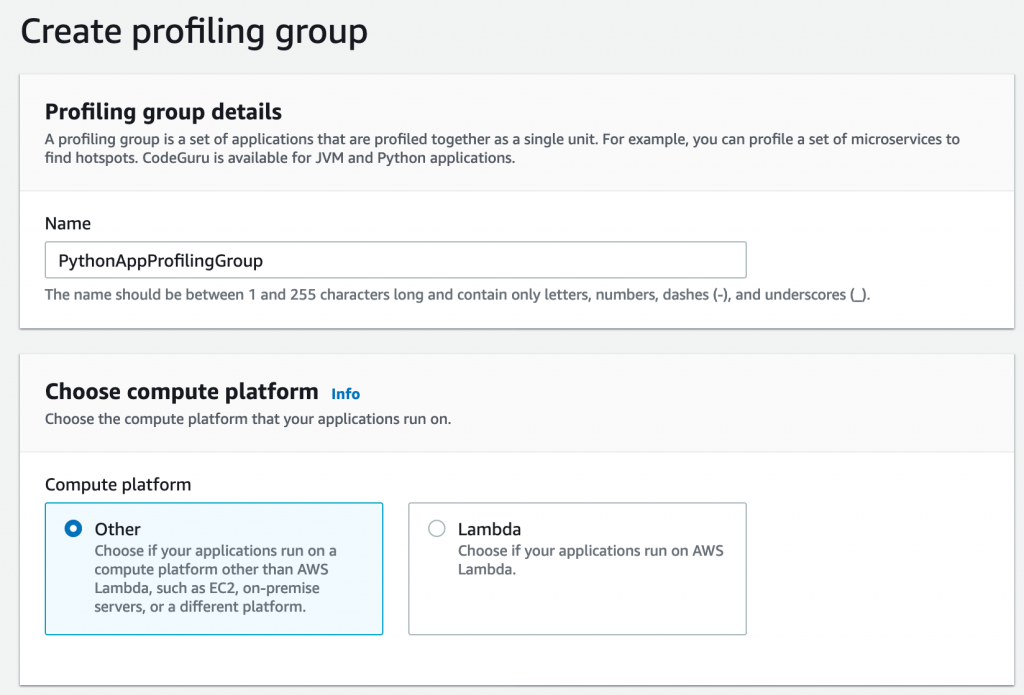
After you create your profiling group, you need to provide some additional settings.
- Select the profiling group you created.
- On the Actions menu, choose Manage permissions.
- Choose the IAM role
CodeGuruCrossAccountRole you created before.
- Choose Save.
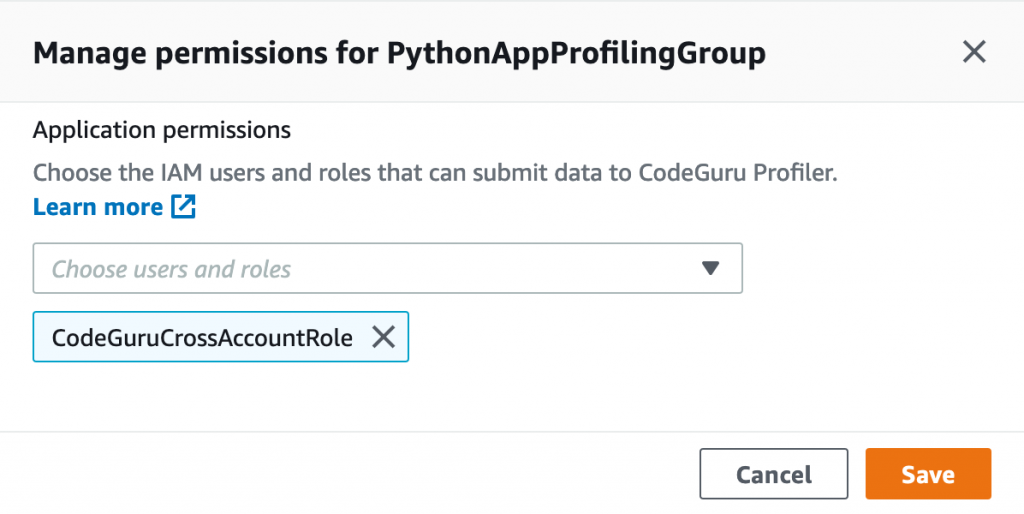
When you complete the configuration, the status of the profiling group shows as Setup required. This is because we need to configure the CodeGuru profiling agent to send data to the profiling group. We cover how to do this for both the Java and Python agent in the next section.
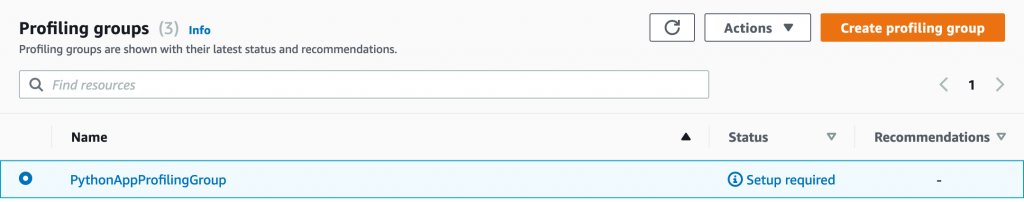
After we configure the agent, we see the status change from Pending to Profiling approximately 15 minutes after CodeGuru Profiler starts sending data.
Configuring your Java application to send profiling data to the central account
To send CodeGuru profiling data to a centralized account when running the agent within the application code, we need to import the CodeGuru agent JAR file into your Java application.
For more information on how to enable the agent, see Enabling the agent with code.
The following table shows the Java types and API calls for each type.
| Type |
API call |
| Profiling group name (required) |
.profilingGroupName(String) |
| AWS Credentials Provider |
.awsCredentialsProvider(AwsCredentialsProvider) |
| Region (optional) |
.awsRegionToReportTo(Region) |
| Heap summary data collection (optional) |
.withHeapSummary(Boolean) |
As part of the CodeGuru Profiler.Builder class, we have an option to provide an AWS credentials provider type, which also includes an AWS role ARN, as follows:
import software.amazon.codeguruprofilerjavaagent.Profiler;
...
class MyApplication{
    static String roleArn =
        "arn:aws:iam::<CODEGURU_CENTRAL_ACCOUNT_ID>:role/CodeGuruCrossAccountRole";
    static String sessionName = "codeguru-java-session";

    public static void main(String[] args) {
        ...
        Profiler.builder()
            .profilingGroupName("JavaAppProfilingGroup")
            .awsCredentialsProvider(AwsCredsProvider.getCredentials(
                                        roleArn,
                                        sessionName))
            .withHeapSummary(true)
            .build()
            .start();
        ...
    }
}
The awsCredentialsProvider API call allows you to provide an interface for loading AwsCredentials that are used for authentication. For this post, I create an AwsCredsProvider class with the getCredentials method.
The following code shows the AwsCredsProvider class in more detail:
import software.amazon.awssdk.auth.credentials.AwsCredentialsProvider;
import software.amazon.awssdk.auth.credentials.DefaultCredentialsProvider;
import software.amazon.awssdk.services.sts.StsClient;
import software.amazon.awssdk.services.sts.auth.StsAssumeRoleCredentialsProvider;
import software.amazon.awssdk.services.sts.model.AssumeRoleRequest;
public class AwsCredsProvider {
    public static AwsCredentialsProvider getCredentials(
                                            String roleArn,
                                            String sessionName){

        final AssumeRoleRequest assumeRoleRequest = AssumeRoleRequest.builder()
                .roleArn(roleArn)
                .roleSessionName(sessionName)
                .build();


        return StsAssumeRoleCredentialsProvider
                .builder()
                        .stsClient(StsClient.builder()
                        .credentialsProvider(DefaultCredentialsProvider.create())
                        .build())
                .refreshRequest(assumeRoleRequest)
                .build();
    }
}
Configuring your Python application to send profiling data to the central account
You can run the CodeGuru Profiler library in your Python codebase by installing the CodeGuru agent using pip install codeguru_profiler_agent.
You can configure the agent by passing different parameters to the Profiler object, as summarized in the following table.
| Option |
Constructor Argument |
| Profiling group name (required) |
profiling_group_name="MyProfilingGroup" |
| Region |
region_name="eu-west-2" |
| AWS session |
aws_session=boto3.session.Session() |
We use the same concepts as with the Java app to assume a role in the CodeGuru central account. The following Python snippet shows you how to instantiate the CodeGuru Profiler object:
import boto3
from codeguru_profiler_agent import Profiler
def assume_role(iam_role):
    sts_client = boto3.client('sts')
    assumed_role = sts_client.assume_role(RoleArn =  iam_role,
                                      RoleSessionName = "codeguru-python-session",
                                      DurationSeconds = 900)
    codeguru_session = boto3.Session(
        aws_access_key_id     = assumed_role['Credentials']['AccessKeyId'],
        aws_secret_access_key = assumed_role['Credentials']['SecretAccessKey'],
        aws_session_token     = assumed_role['Credentials']['SessionToken']
    )
    return codeguru_session
if __name__ == "__main__":
    iam_role = "arn:aws:iam::<CODEGURU_CENTRAL_ACCOUNT_ID>:role/CodeGuruCrossAccountRole"
    codeguru_session = assume_role(iam_role)
    Profiler(profiling_group_name="PythonAppProfilingGroup",
             region_name="<YOUR REGION>",
             aws_session=codeguru_session).start()
    ...
Configuring IAM with Amazon EKS
You can use two different methods to configure the IAM role to allow the CodeGuru Profiler agent to send data from the application account to the CodeGuru Profiler central account:
Associate an IAM role with a Kubernetes service account; this account can then provide AWS permissions to the containers in any pod that uses that service account
Provide an IAM instance profile to the EKS node so that all pods running on this node have access to this role
For more information about configuring either option, see Enabling cross-account access to Amazon EKS cluster resources.
You can use the same CodeGuru codebase to assume a role by either using an IAM role for service accounts or an adding IAM instance profile to an EKS node.
The following diagram shows our architecture for a cross-account profiler using IAM roles for service accounts.
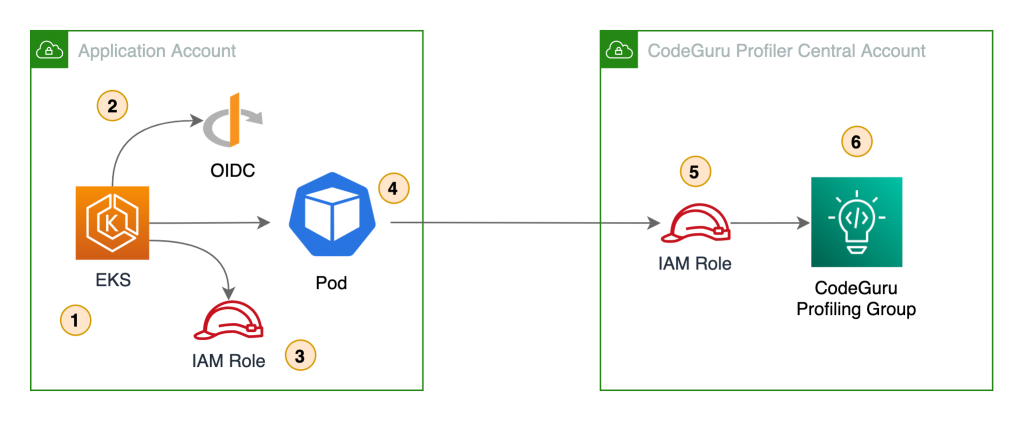
In this architecture, the pods use Amazon web identity to get credentials for the IAM role assigned to the pod via the Kubernetes service account. This role needs permission to assume the IAM role in the CodeGuru central account.
The following diagram shows the architecture of a cross-account profiler using an EKS node IAM instance profile.
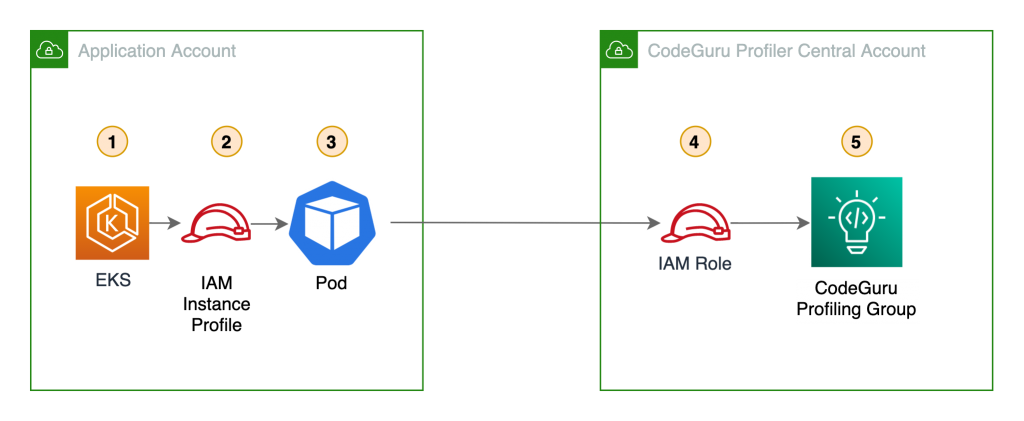
In this scenario, the pods use the IAM role assigned to the EKS node. This role needs permission to assume the IAM role in the central account.
In either case, the code doesn’t change and you can assume the IAM role in the central account.
Reviewing findings and recommendations on the CodeGuru Profiler dashboard
Approximately 15 minutes after the CodeGuru Profiler agent starts sending application data to the profiler on the central account, the profiling group changes its status to Profiling. You can visualize the application performance data on the central account’s CodeGuru Profiler dashboard.
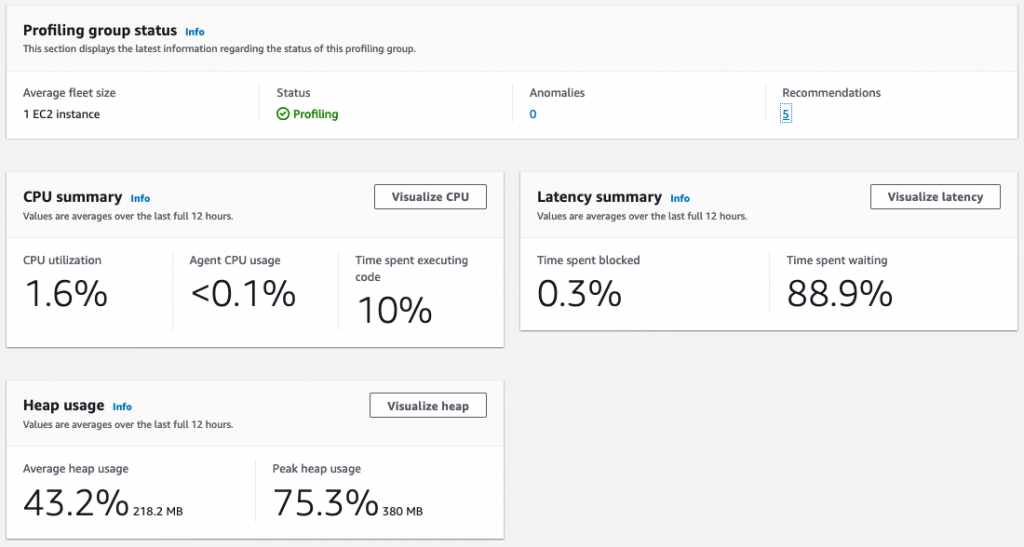
In addition, the dashboard provides recommendations on how to improve your application performance based on the data the agent is collecting.
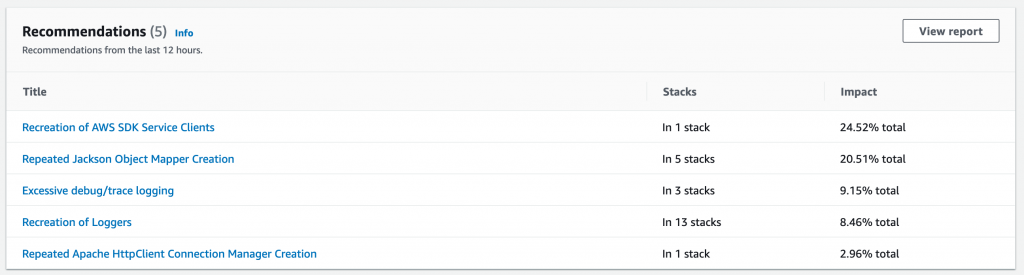
Conclusion
In this post, you learned how to configure CodeGuru Profiler to collect multiple applications’ profiling data into a central account. This approach makes profiling dashboards more accessible on multi-account setups, and facilitates how developers can analyze the behavior of their distributed workloads. Moreover, because developers only need access to the central account, you can follow the least privilege best practice and isolate the other accounts.
You also learned how to initiate the CodeGuru Profiler agent from both Python and Java applications using cross-account IAM roles, as well as how to use IAM roles for service accounts on Amazon EKS for fine-grained access control and enhanced security. Although CodeGuru Profiler supports Lambda functions profiling, at the time of this writing, it’s only possible to send profiling data to the same AWS account where the Lambda function runs.
For more details regarding how CodeGuru Profiler can help improve application performance, see Optimizing application performance with Amazon CodeGuru Profiler.

Oli Leach
Oli is a Global Solutions Architect at Amazon Web Services, and works with Financial Services customers to help them architect, build, and scale applications to achieve their business goals.

Rafael Ramos
Rafael is a Solutions Architect at AWS, where he helps ISVs on their journey to the cloud. He spent over 13 years working as a software developer, and is passionate about DevOps and serverless. Outside of work, he enjoys playing tabletop RPG, cooking and running marathons.
Chaos engineering on Amazon EKS using AWS Fault Injection Simulator
=======================
In this post, we discuss how you can use AWS Fault Injection Simulator (AWS FIS), a fully managed fault injection service used for practicing chaos engineering. AWS FIS supports a range of AWS services, including Amazon Elastic Kubernetes Service (Amazon EKS), a managed service that helps you run Kubernetes on AWS without needing to install and operate your own Kubernetes control plane or worker nodes. In this post, we aim to show how you can simplify the process of setting up and running controlled fault injection experiments on Amazon EKS using pre-built templates as well as custom faults to find hidden weaknesses in your Amazon EKS workloads.
What is chaos engineering?
Chaos engineering is the process of stressing an application in testing or production environments by creating disruptive events, such as server outages or API throttling, observing how the system responds, and implementing improvements. Chaos engineering helps you create the real-world conditions needed to uncover the hidden issues and performance bottlenecks that are difficult to find in distributed systems. It starts with analyzing the steady-state behavior, building an experiment hypothesis (for example, stopping x number of instances will lead to x% more retries), running the experiment by injecting fault actions, monitoring rollback conditions, and addressing the weaknesses.
AWS FIS lets you easily run fault injection experiments that are used in chaos engineering, making it easier to improve an application’s performance, observability, and resiliency.
Solution overview
Figure 1: Solution Overview
The following diagram illustrates our solution architecture.
In this post, we demonstrate two different fault experiments targeting an Amazon EKS cluster. This post doesn’t go into details about the creation process of an Amazon EKS cluster; for more information, see Getting started with Amazon EKS – eksctl and eksctl – The official CLI for Amazon EKS.
Prerequisites
Before getting started, make sure you have the following prerequisites:
Access to an AWS account
kubectl locally installed to interact with the Amazon EKS cluster
A running Amazon EKS cluster with Cluster Autoscaler and Container Insights
Correct AWS Identity and Access Management (IAM) permissions to work with AWS FIS (see Set up permissions for IAM users and roles) and permissions for AWS FIS to run experiments on your behalf (see Set up the IAM role for the AWS FIS service)
We used the following configuration to create our cluster:
---
apiVersion: eksctl.io/v1alpha5
kind: ClusterConfig
metadata:
name: aws-fis-eks
region: eu-west-1
version: "1.19"
iam:
withOIDC: true
managedNodeGroups:
- name: nodegroup
desiredCapacity: 3
instanceType: t3.small
ssh:
enableSsm: true
tags:
Environment: Dev
Our cluster was created with the following features:
Three Amazon Elastic Compute Cloud (Amazon EC2) t3.small instances spread across three different Availability Zones
Enabled OIDC provider
Enabled AWS Systems Manager Agent on the instances (which we use later)
Tagged instances
We have deployed a simple Nginx deployment with three replicas, each running on different instances for high availability.
In this post, we perform the following experiments:
Terminate node group instances – In the first experiment, we will use the aws:eks:terminate-nodegroup-instance AWS FIS action that runs the Amazon EC2 API action TerminateInstances on the target node group. When the experiment starts, AWS FIS begins to terminate nodes, and we should be able to verify that our cluster replaces the terminated nodes with new ones as per our desired capacity configuration for the cluster.
Delete application pods – In the second experiment, we show how you can use AWS FIS to run custom faults against the cluster. Although AWS FIS plans to expand on supported faults for Amazon EKS in the future, in this example we demonstrate how you can run a custom fault injection, running kubectl commands to delete a random pod for our Kubernetes deployment. Using a Kubernetes deployment is a good practice to define the desired state for the number of replicas you want to run for your application, and therefore ensures high availability in case one of the nodes or pods is stopped.
Experiment 1: Terminate node group instances
We start by creating an experiment to terminate Amazon EKS nodes.
- On the AWS FIS console, choose Create experiment template.
Figure 2: AWS FIS Console
2. For Description, enter a description.
3. For IAM role, choose the IAM role you created.
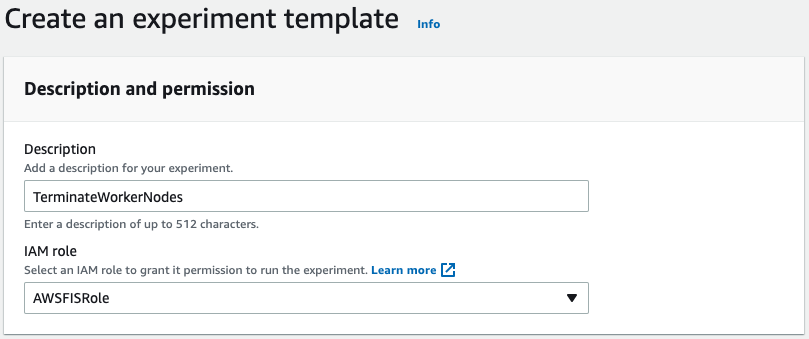
Figure 3: Create experiment template
4. Choose Add action.
For our action, we want aws:eks:terminate-nodegroup-instances to terminate worker nodes in our cluster.
5. For Name, enter TerminateWorkerNode.
6. For Description, enter Terminate worker node.
7. For Action type, choose aws:eks:terminate-nodegroup-instances.
8. For Target, choose Nodegroups-Target-1.
9. For instanceTerminationPercentage, enter 40 (the percentage of instances that are terminated per node group).
10. Choose Save.
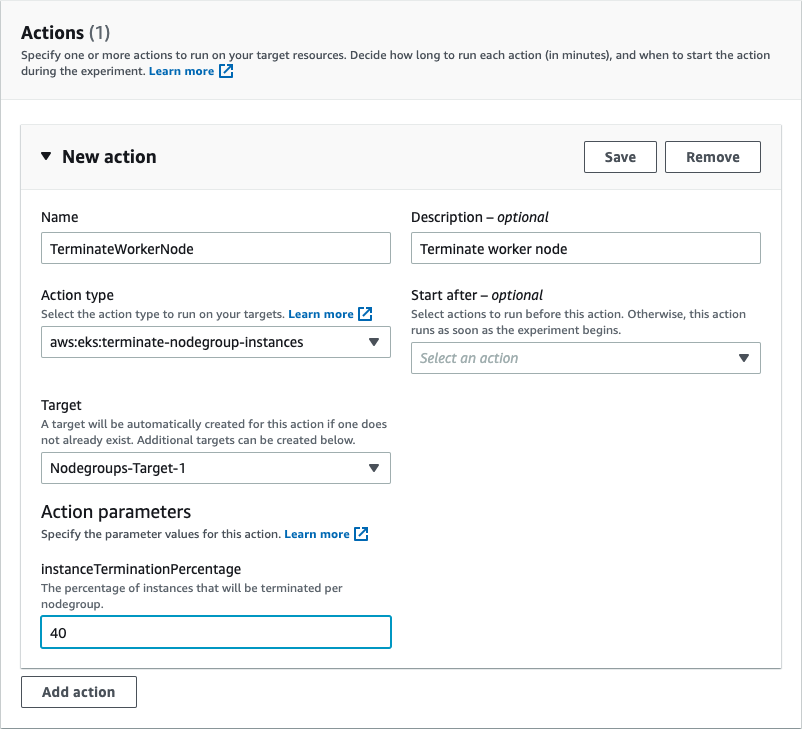
Figure 4: Select action type
After you add the correct action, you can modify your target, which in this case is Amazon EKS node group instances.
11. Choose Edit target.
12. For Resource type, choose aws:eks:nodegroup.
13. For Target method, select Resource IDs.
14. For Resource IDs, enter your resource ID.
15. Choose Save.
With selection mode in AWS FIS, you can select your Amazon EKS cluster node group.
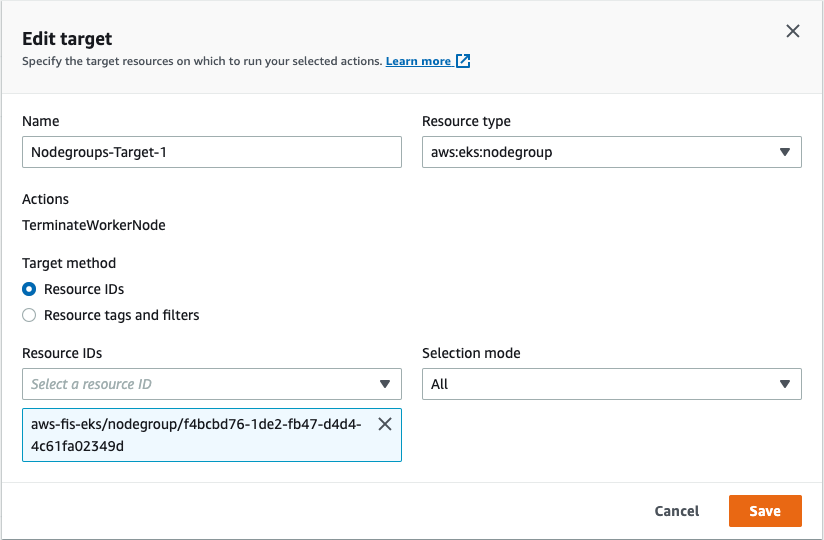
Figure 5: Specify target resource
Finally, we add a stop condition. Even though this is optional, it’s highly recommended, because it makes sure we run experiments with the appropriate guardrails in place. The stop condition is a mechanism to stop an experiment if an Amazon CloudWatch alarm reaches a threshold that you define. If a stop condition is triggered during an experiment, AWS FIS stops the experiment, and the experiment enters the stopping state.
Because we have Container Insights configured for the cluster, we can monitor the number of nodes running in the cluster.
16. Through Container Insights, create a CloudWatch alarm to stop our experiment if the number of nodes is less than two.
17. Add the alarm as a stop condition.
18. Choose Create experiment template.
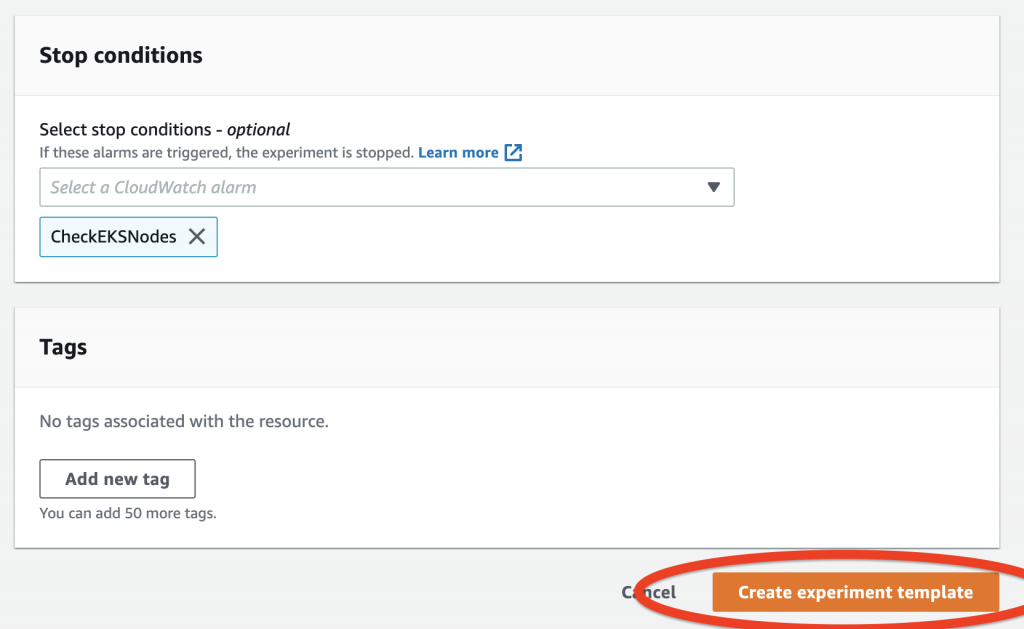
Figure 6: Create experiment template
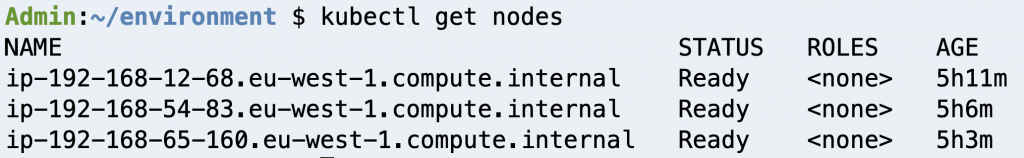
Figure 7: Check cluster nodes
Before we run our first experiment, let’s check our Amazon EKS cluster nodes. In our case, we have three nodes up and running.
19. On the AWS FIS console, navigate to the details page for the experiment we created.
20. On the Actions menu, choose Start.
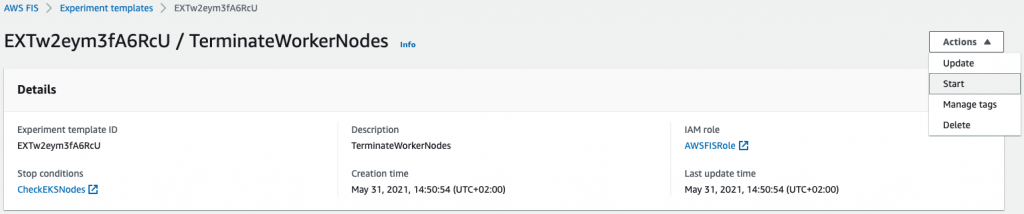
Figure 8: Start experiment
Before we run our experiment, AWS FIS will ask you to confirm if you want to start the experiment. This is another example of safeguards to make sure you’re ready to run an experiment against your resources.
21. Enter start in the field.
22. Choose Start experiment.
Figure 9: Confirm to start experiment
After you start the experiment, you can see the experiment ID with its current state. You can also see the action the experiment is running.
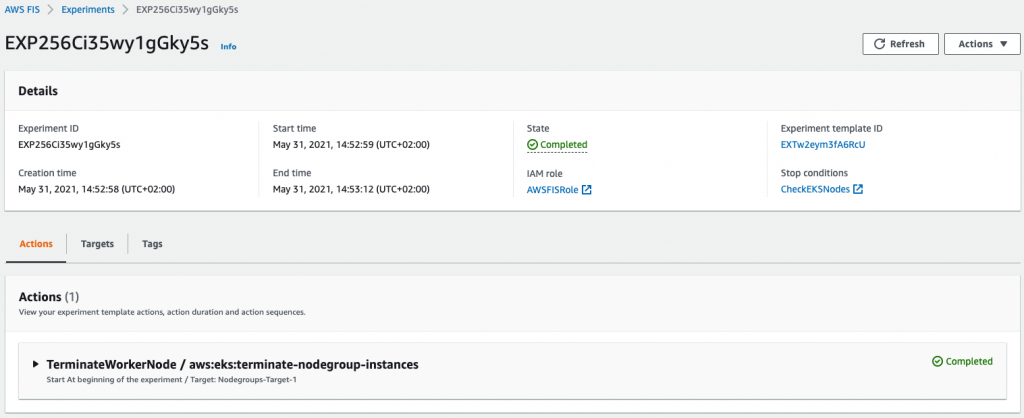
Figure 10: Check experiment state
Next, we can check the status of our cluster worker nodes. The process of adding a new node to the cluster takes a few minutes, but after a while we can see that Amazon EKS has launched new instances to replace the terminated ones.
The number of terminated instances should reflect the percentage that we provided as part of our action configuration. Because our experiment is complete, we can verify our hypothesis—our cluster eventually reached a steady state with a number of nodes equal to the desired capacity within a few minutes.
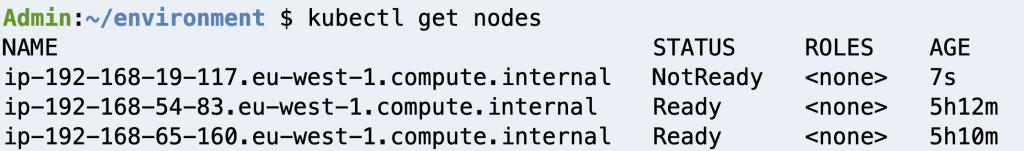
Figure 11: Check new worker node
Experiment 2: Delete application pods
Now, let’s create a custom fault injection, targeting a specific containerized application (pod) running on our Amazon EKS cluster.
As a prerequisite for this experiment, you need to update your Amazon EKS cluster configmap, adding the IAM role that is attached to your worker nodes. The reason for adding this role to the configmap is because the experiment uses kubectl, the Kubernetes command-line tool that allows us to run commands against our Kubernetes cluster. For instructions, see Managing users or IAM roles for your cluster.
- On the Systems Manager console, choose Documents.
- On the Create document menu, choose Command or Session.
-
Figure 12: Create AWS Systems Manager Document
3. For Name, enter a name (for example, Delete-Pods).
4. In the Content section, enter the following code:
---
description: |
### Document name - Delete Pod
## What does this document do?
Delete Pod in a specific namespace via kubectl
## Input Parameters
* Cluster: (Required)
* Namespace: (Required)
* InstallDependencies: If set to True, Systems Manager installs the required dependencies on the target instances. (default True)
## Output Parameters
None.
schemaVersion: '2.2'
parameters:
Cluster:
type: String
description: '(Required) Specify the cluster name'
Namespace:
type: String
description: '(Required) Specify the target Namespace'
InstallDependencies:
type: String
description: 'If set to True, Systems Manager installs the required dependencies on the target instances (default: True)'
default: 'True'
allowedValues:
- 'True'
- 'False'
mainSteps:
- action: aws:runShellScript
name: InstallDependencies
precondition:
StringEquals:
- platformType
- Linux
description: |
## Parameter: InstallDependencies
If set to True, this step installs the required dependecy via operating system's repository.
inputs:
runCommand:
- |
#!/bin/bash
if [[ "{{ InstallDependencies }}" == True ]] ; then
if [[ "$( which kubectl 2>/dev/null )" ]] ; then echo Dependency is already installed. ; exit ; fi
echo "Installing required dependencies"
sudo mkdir -p $HOME/bin && cd $HOME/bin
sudo curl -o kubectl https://amazon-eks.s3.us-west-2.amazonaws.com/1.20.4/2021-04-12/bin/linux/amd64/kubectl
sudo chmod +x ./kubectl
export PATH=$PATH:$HOME/bin
fi
- action: aws:runShellScript
name: ExecuteKubectlDeletePod
precondition:
StringEquals:
- platformType
- Linux
description: |
## Parameters: Namespace, Cluster, Namespace
This step will terminate the random first pod based on namespace provided
inputs:
maxAttempts: 1
runCommand:
- |
if [ -z "{{ Cluster }}" ] ; then echo Cluster not specified && exit; fi
if [ -z "{{ Namespace }}" ] ; then echo Namespace not specified && exit; fi
pgrep kubectl && echo Another kubectl command is already running, exiting... && exit
EC2_REGION=$(curl -s http://169.254.169.254/latest/dynamic/instance-identity/document|grep region | awk -F\" '{print $4}')
aws eks --region $EC2_REGION update-kubeconfig --name {{ Cluster }} --kubeconfig /home/ssm-user/.kube/config
echo Running kubectl command...
TARGET_POD=$(kubectl --kubeconfig /home/ssm-user/.kube/config get pods -n {{ Namespace }} -o jsonpath={.items[0].metadata.name})
echo "TARGET_POD: $TARGET_POD"
kubectl --kubeconfig /home/ssm-user/.kube/config delete pod $TARGET_POD -n {{ Namespace }} --grace-period=0 --force
echo Finished kubectl delete pod command.
Figure 13: Add Document details
For this post, we create a Systems Manager command document that does the following:
Installs kubectl on the target Amazon EKS cluster instances
Uses two required parameters—the Amazon EKS cluster name and namespace where your application pods are running
Runs kubectl delete, deleting one of our application pods from a specific namespace
5. Choose Create document.
6. Create a new experiment template on the AWS FIS console.
7. For Name, enter DeletePod.
8. For Action type, choose aws:ssm:send-command.
This runs the Systems Manager API action SendCommand to our target EC2 instances.
After choosing this action, we need to provide the ARN for the document we created earlier, and provide the appropriate values for the cluster and namespace. In our example, we named the document Delete-Pods, our cluster name is aws-fis-eks, and our namespace is nginx.
9. For documentARN, enter arn:aws:ssm:<region>:<accountId>:document/Delete-Pods.
10. For documentParameters, enter {"Cluster":"aws-fis-eks", "Namespace":"nginx", "InstallDependencies":"True"}.
11. Choose Save.
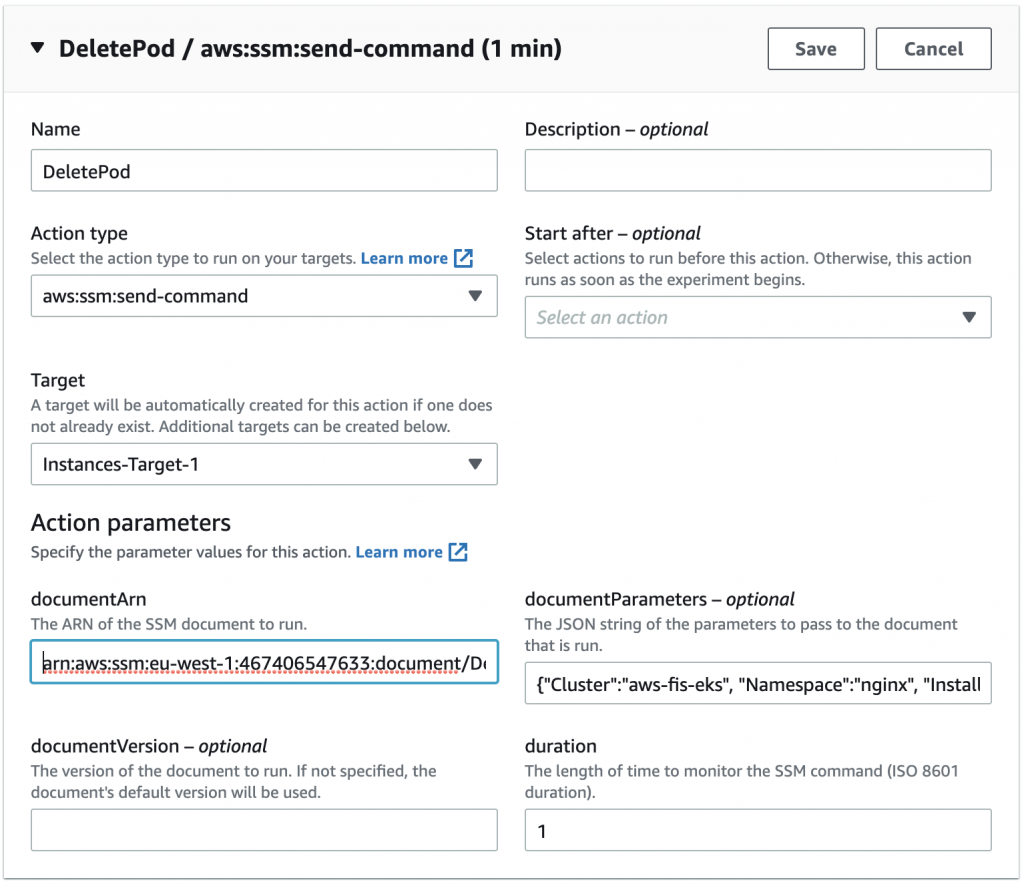
Figure 14: Select Action type
12. For our targets, we can either target our resources by resource IDs or resource tags. For this example we target one of our node instances by resource ID.
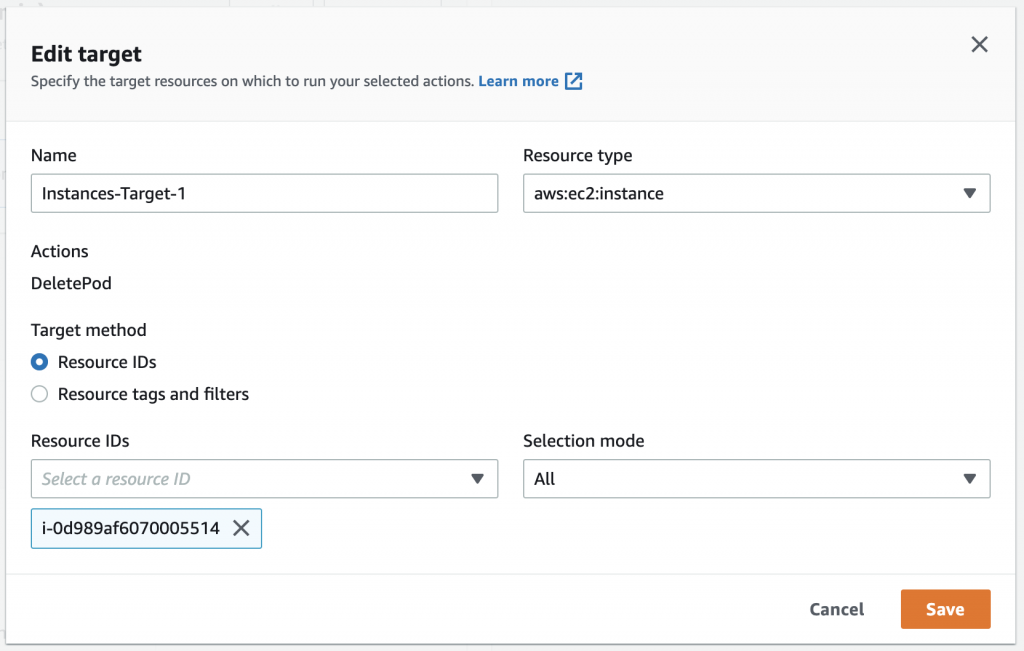
Figure 15: Specify target resource
13. After you create the template successfully, start the experiment.
When the experiment is complete, check your application pods. In our case, AWS FIS stopped one of our pod replicas and because we use a Kubernetes deployment, as we discussed before, a new pod replica was created.
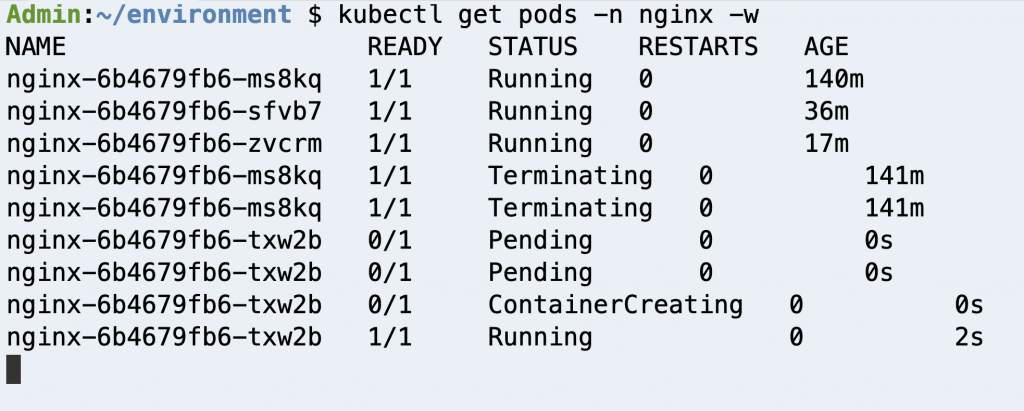
Figure 16: Check Deployment pods
Clean up
To avoid incurring future charges, follow the steps below to remove all resources that was created following along with this post.
- From the AWS FIS console, delete the following experiments, TerminateWorkerNodes & DeletePod.
- From the AWS EKS console, delete the test cluster created following this post, aws-fis-eks.
- From the AWS Identity and Access Management (IAM) console, delete the IAM role AWSFISRole.
- From the Amazon CloudWatch console, delete the CloudWatch alarm CheckEKSNodes.
- From the AWS Systems Manager console, delete the Owned by me document Delete-Pods.
Conclusion
In this post, we showed two ways you can run fault injection experiments on Amazon EKS using AWS FIS. First, we used a native action supported by AWS FIS to terminate instances from our Amazon EKS cluster. Then, we extended AWS FIS to inject custom faults on our containerized applications running on Amazon EKS.
For more information about AWS FIS, check out the AWS re:Invent 2020 session AWS Fault Injection Simulator: Fully managed chaos engineering service. If you want to know more about chaos engineering, check out the AWS re:Invent session Testing resiliency using chaos engineering and The Chaos Engineering Collection. Finally, check out the following GitHub repo for additional example experiments, and how you can work with AWS FIS using the AWS Cloud Development Kit (AWS CDK).
Extending an AWS CodeBuild environment for CPP applications
=======================
AWS CodeBuild is a fully managed build service that offers curated Docker images. These managed images provide build environments for programming languages and runtimes such as Android, Go, Java, Node.js, PHP, Python, Ruby, Docker, and .Net Core. However, there are a lot of existing CPP-based applications, and developers may have difficulties integrating these applications with the AWS CPP SDK. CodeBuild doesn’t provide Docker images to build CPP code. This requires building a custom Docker image to use with CodeBuild.
This post demonstrates how you can create a custom build environment to build CPP applications using aws-sdk-cpp. We provide an example Docker file to build a custom Docker image and demonstrate how CodeBuild can use it. We also provide a unit test that calls the data transfer manager API to transfer the data to an Amazon Simple Storage Service (Amazon S3) bucket using the custom Docker image. We hope this can help you extend any C++ applications with AWS functionalities by integrating the AWS CPP SDK in your applications.
Set up the Amazon ECR repository
Amazon Elastic Container Registry (Amazon ECR) manages public and private image repositories. You can push or pull images from it. In this section, we walk through setting up a repository.
- On the Amazon ECR console, create a private repository called
cpp-blog.
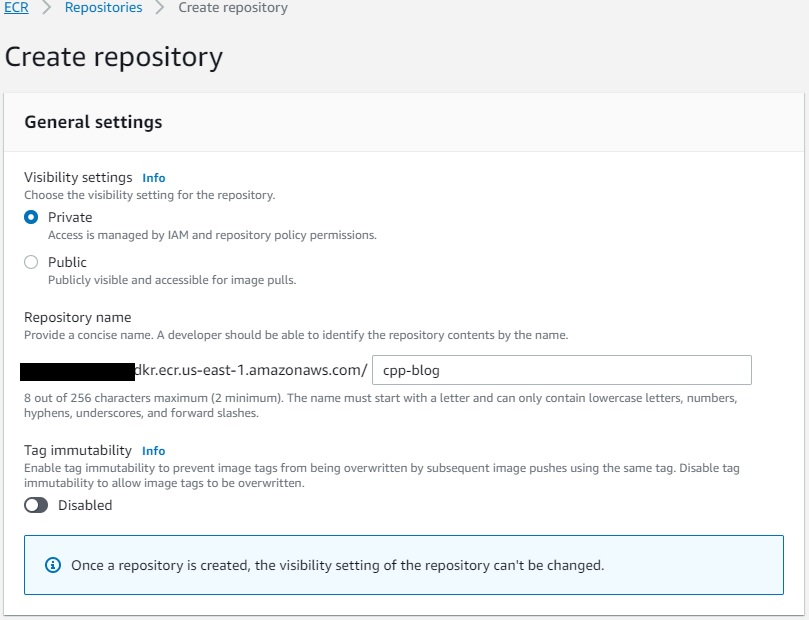
- On the repository details page, choose Permissions.
- Choose Edit policy JSON.
- Add the following code so CodeBuild can push and pull images from the repository:
{
"Version": "2012-10-17",
"Statement": [{
"Sid": "AllowPushPull",
"Effect": "Allow",
"Principal": {
"Service": "codebuild.amazonaws.com"
},
"Action": [
"ecr:BatchCheckLayerAvailability",
"ecr:BatchGetImage",
"ecr:CompleteLayerUpload",
"ecr:GetDownloadUrlForLayer",
"ecr:InitiateLayerUpload",
"ecr:PutImage",
"ecr:UploadLayerPart"
]
}]
}
After we create the repository, we can create the custom CodeBuild image.
- Set up a CodeCommit repository
cpp_custom_build_image.
- In the repository, create a file named
Dockerfile and enter the following code.
Note here that we’re not building the entire aws-sdk-cpp. The -DBUILD_ONLY="s3;transfer" flag determines which packages you want to build. You can customize this flag according to your application’s needs.
# base image
FROM public.ecr.aws/lts/ubuntu:18.04_stable
ENV DEBIAN_FRONTEND=noninteractive
# build as root
USER 0
# install required build tools via packet manager
RUN apt-get update -y && apt-get install -y ca-certificates curl build-essential git cmake libz-dev libssl-dev libcurl4-openssl-dev
# AWSCPPSDK we build s3 and transfer manager
RUN git clone --recurse-submodules https://github.com/aws/aws-sdk-cpp \
    && mkdir sdk_build && cd sdk_build \
    && cmake ../aws-sdk-cpp/ -DCMAKE_BUILD_TYPE=Release -DBUILD_ONLY="s3;transfer" -DENABLE_TESTING=OFF -DBUILD_SHARED_LIBS=OFF \
    && make -j $(nproc) && make install \
    && cd .. \
    && rm -rf sdk_build
# finalize the build
WORKDIR /
- Create a file named
buildspec.yaml and enter the following code to build the custom image and push it to the repository:
version: 0.2
phases:
  pre_build:
    commands:
      - echo "Logging in to Amazon ECR..."
      - aws ecr get-login-password --region $AWS_REGION | docker login --username AWS --password-stdin ${ECR_PATH}
  build:
    commands:
      - docker build -t cpp-blog:v1 .
      - docker tag cpp-blog:v1 ${ECR_REGISTRY}:v1
      - docker push ${ECR_REGISTRY}:v1
- Create a CodeBuild project named
cpp_custom_build.
- For Source provider, choose AWS CodeCommit.
- For Repository, choose the repository you created (
cpp_custom_build_image).
- For Reference type, select Branch.
- For Branch, choose main.
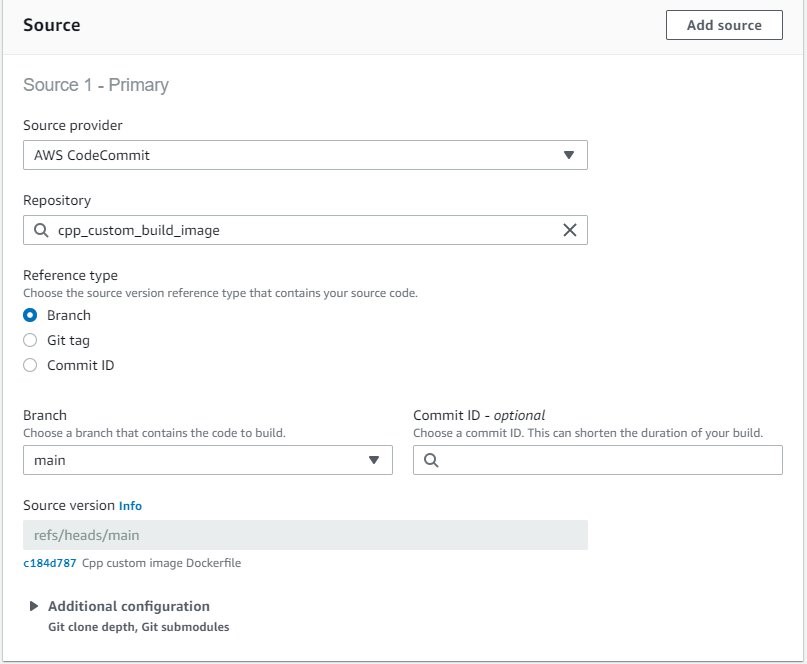
- For Environment image, select Managed image.
- Choose the latest standard available image to you.
- Select Privileged to allow CodeBuild to build the Docker image.
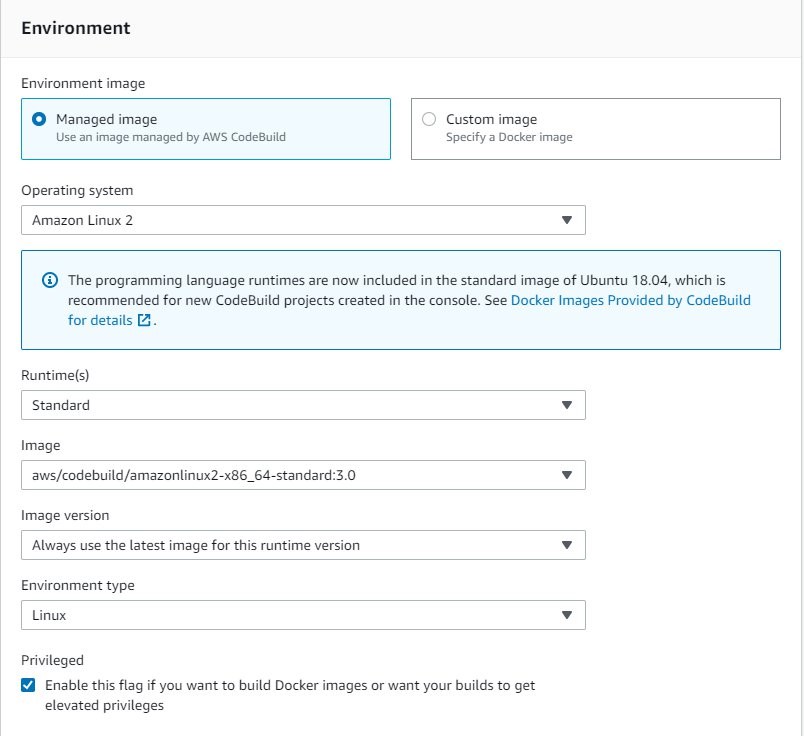
- For Service role, select New service role.
- For Role name, enter
cpp-custom-image-build-role.
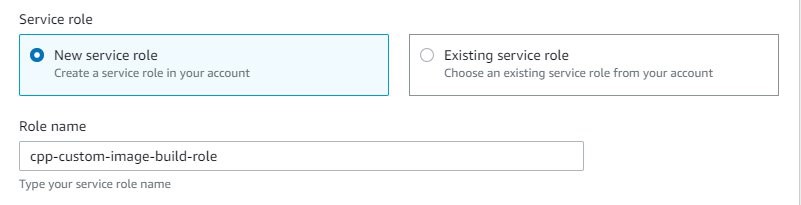
- Under Additional configuration, because we build Amazon S3 and transfer manager, select 7 GB memory (the AWS CPP SDK build requires at least 4 GB).
- Add the following environment variables:
a. ECR_REGISTRY = <ACCOUNT_NUMBER>.ecr.<AWS_REGION>.amazonaws.com/cpp-blog
b. ECR_PATH = <ACCOUNT_NUMBER>.ecr.<AWS_REGION>.amazonaws.com
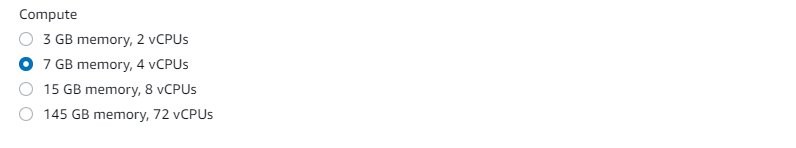
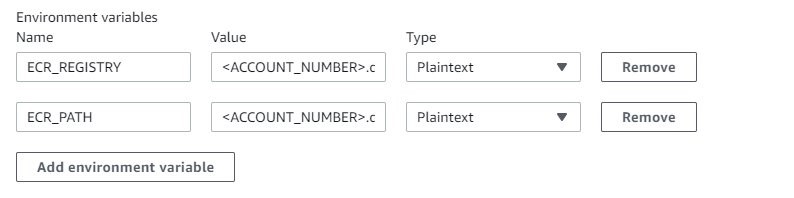
- For Build specifications, select Use a buildspec file.
- Leave Buildspec name empty.
By default, it uses buildspec.yaml from the CodeCommit repository.
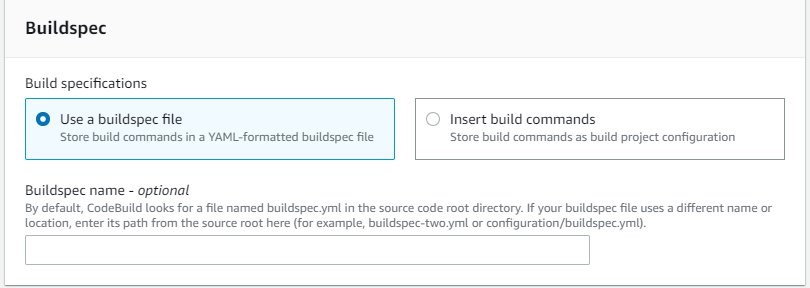
- Choose Create build project.
Next, you update the AWS Identity and Access Management (IAM) service role with permissions to push and pull images from Amazon ECR.
- On the IAM console, choose Roles.
- Search for and choose the role you created (
cpp-custom-image-build-role).
- Choose Edit policy.
- On the JSON tab, add the following code: Here replace the
<account_id> with your AWS account ID and us-east-1 with AWS region you are working in.
{
    "Version": "2012-10-17",
    "Statement": [
        {
            "Effect": "Allow",
            "Resource": [
                "arn:aws:logs:us-east-1:<account_id>:log-group:/aws/codebuild/cpp_custom_build",
                "arn:aws:logs:us-east-1:<account_id>:log-group:/aws/codebuild/cpp_custom_build:*"
            ],
            "Action": [
                "logs:CreateLogGroup",
                "logs:CreateLogStream",
                "logs:PutLogEvents"
            ]
        },
        {
            "Effect": "Allow",
            "Resource": [
                "arn:aws:codecommit:us-east-1:<account_id>:cpp_custom_build_image"
            ],
            "Action": [
                "codecommit:GitPull"
            ]
        },
        {
            "Effect": "Allow",
            "Action": [
                "codebuild:CreateReportGroup",
                "codebuild:CreateReport",
                "codebuild:UpdateReport",
                "codebuild:BatchPutTestCases",
                "codebuild:BatchPutCodeCoverages"
            ],
            "Resource": [
                "arn:aws:codebuild:us-east-1:<account_id>:report-group/cpp_custom_build-*"
            ]
        },
        {
            "Effect": "Allow",
            "Action": [
                "ecr:GetAuthorizationToken",
                "ecr:BatchCheckLayerAvailability",
                "ecr:GetDownloadUrlForLayer",
                "ecr:GetRepositoryPolicy",
                "ecr:DescribeRepositories",
                "ecr:ListImages",
                "ecr:DescribeImages",
                "ecr:BatchGetImage",
                "ecr:GetLifecyclePolicy",
                "ecr:GetLifecyclePolicyPreview",
                "ecr:ListTagsForResource",
                "ecr:DescribeImageScanFindings",
                "ecr:InitiateLayerUpload",
                "ecr:UploadLayerPart",
                "ecr:CompleteLayerUpload",
                "ecr:PutImage"
            ],
            "Resource": "*"
        }
    ]
}
- Choose Review policy and choose Save changes.
- Run the build project.
- Validate that the Amazon ECR repository has the newly created image.
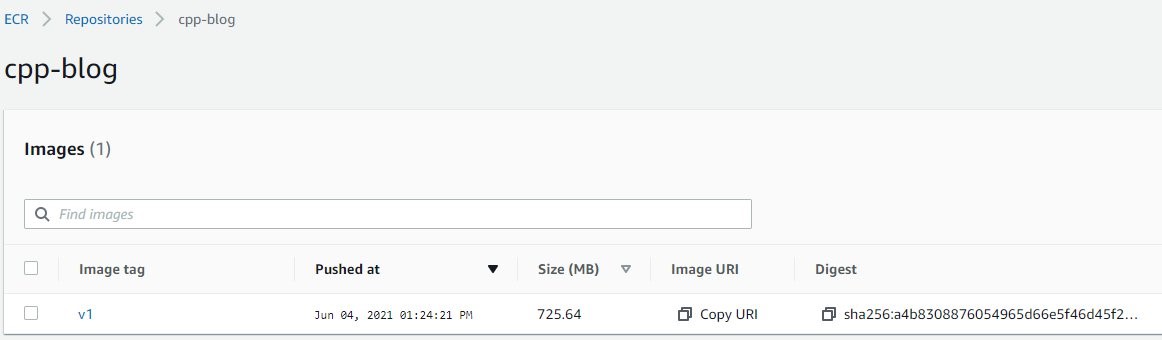
Test the custom CodeBuild image with a sample CPP application
Now we use a sample CPP application that calls transfer manager and Amazon S3 APIs from aws-sdk-cpp to test our custom image.
- Set up the CodeCommit repository
sample_cpp_app.
- Create a file named
s3_test.cpp and enter the following code into it.
We use transfer manager to test our image created in the previous step:
#include <aws/s3/S3Client.h>
#include <aws/core/Aws.h>
#include <aws/core/auth/AWSCredentialsProvider.h>
#include <aws/transfer/TransferManager.h>
#include <aws/transfer/TransferHandle.h>
#include <iostream>
#include <fstream>
/*
 *  usage: ./s3_test srcFile bucketName destFile region
 *  this function is using tranfer manager to copy a local file to the bucket
 */
int main(int argc, char *argv[])
{
    if(argc != 5){
        std::cout << "usage: ./s3_test srcFile bucketName destFile region\n";
        return 1;
    }
    std::string fileName = argv[1]; //local FileName to be uploaded to s3 bucket
    std::string bucketName = argv[2];  //bucketName, make sure that bucketName exists
    std::string objectName = argv[3];
    std::string region = argv[4];
    Aws::SDKOptions options;
    options.loggingOptions.logLevel = Aws::Utils::Logging::LogLevel::Info;
    Aws::InitAPI(options);
    Aws::Client::ClientConfiguration config;
    config.region = region;

    auto s3_client = std::make_shared<Aws::S3::S3Client>(config);
    auto thread_executor = Aws::MakeShared<Aws::Utils::Threading::DefaultExecutor>("s3_test");
    Aws::Transfer::TransferManagerConfiguration transferConfig(thread_executor.get());
    transferConfig.s3Client = s3_client;
    auto buffer = Aws::MakeShared<Aws::FStream>("PutObjectInputStream", fileName.c_str(), std::ios_base::in | std::ios_base::binary);
    auto transferManager = Aws::Transfer::TransferManager::Create(transferConfig);
    auto transferHandle = transferManager->UploadFile(buffer,
                            bucketName.c_str(), objectName.c_str(), "multipart/form-data",
                            Aws::Map<Aws::String, Aws::String>());

    transferHandle->WaitUntilFinished();
    thread_executor = nullptr;
    Aws::ShutdownAPI(options);
}
- Create a file named
CMakeLists.txt and add the below code to it.
Because we only use Amazon S3 and transfer components from aws-sdk-cpp in our example, we use find_package to locate these two components:
cmake_minimum_required(VERSION 3.3)
project(s3_test)
set(CMAKE_CXX_STANDARD 11)
find_package(CURL REQUIRED)
find_package( AWSSDK  REQUIRED COMPONENTS s3 transfer)
add_executable(s3_test s3_test.cpp)
target_link_libraries(s3_test ${AWSSDK_LINK_LIBRARIES})
- Create a file named
buildspec.yaml and enter the following code into it:
version: 0.2
phases:
  build:
    commands:
      # configure application executable, source files and linked libraries.
      - cmake .
      # build the application
      - make
      # unit test. we can test the s3_test executable by copying a local file, for example test_source.txt to an existing s3 bucket and name the file as test_dest.txt
      - ./s3_test $SOURCE_FILE $BUCKET_NAME $DEST_FILE $REGION
artifacts:
  files:
    - s3_test
- Create a file to be copied to Amazon S3 as part of testing the solution.
For example, we create test_source.txt in the sample_cpp_app CodeCommit repository.
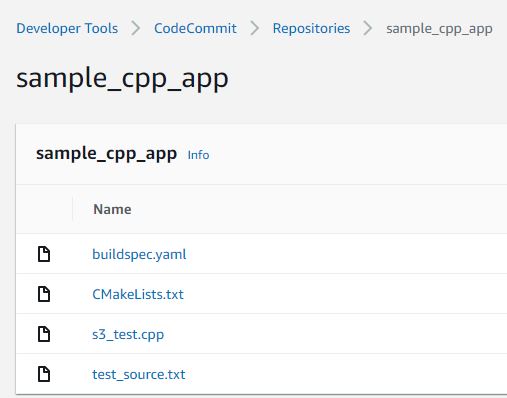
- After setting up the project, create an S3 bucket to use in the next step.
- Create another CodeBuild project called
cpp-test.
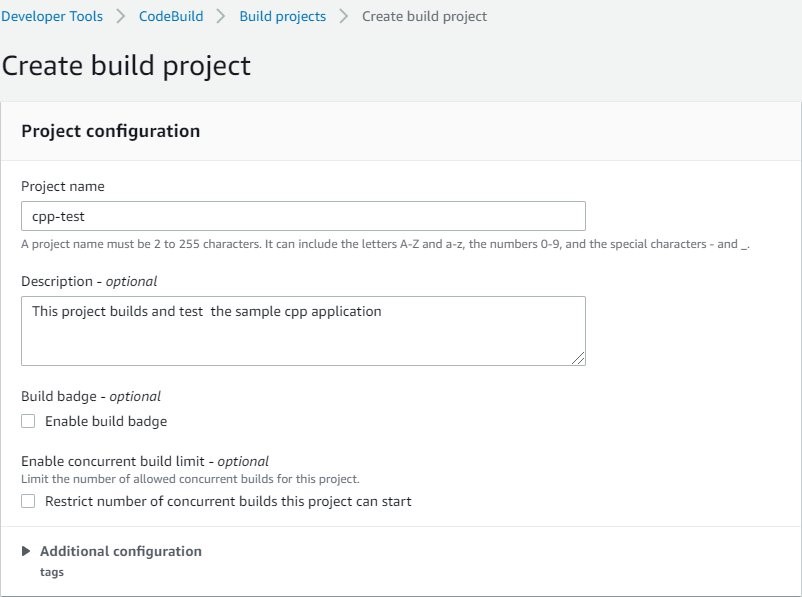
- For Source provider, choose AWS CodeCommit.
- For Repository, enter the repository you created (
sample_cpp_app).
- For Reference type, select Branch.
- For Branch, choose main.
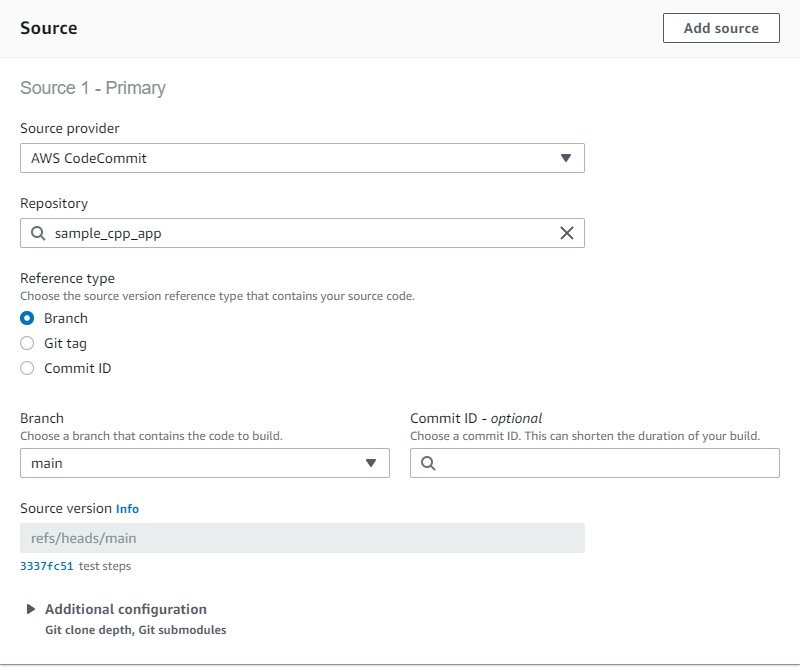
- In the Environment section, select Custom image.
- For Image registry, select Amazon ECR.
- For Amazon ECR repository, choose the
cpp-blog repository.
- For Amazon ECR image, choose v1.
- For Image pull credentials, select AWS CodeBuild credentials.
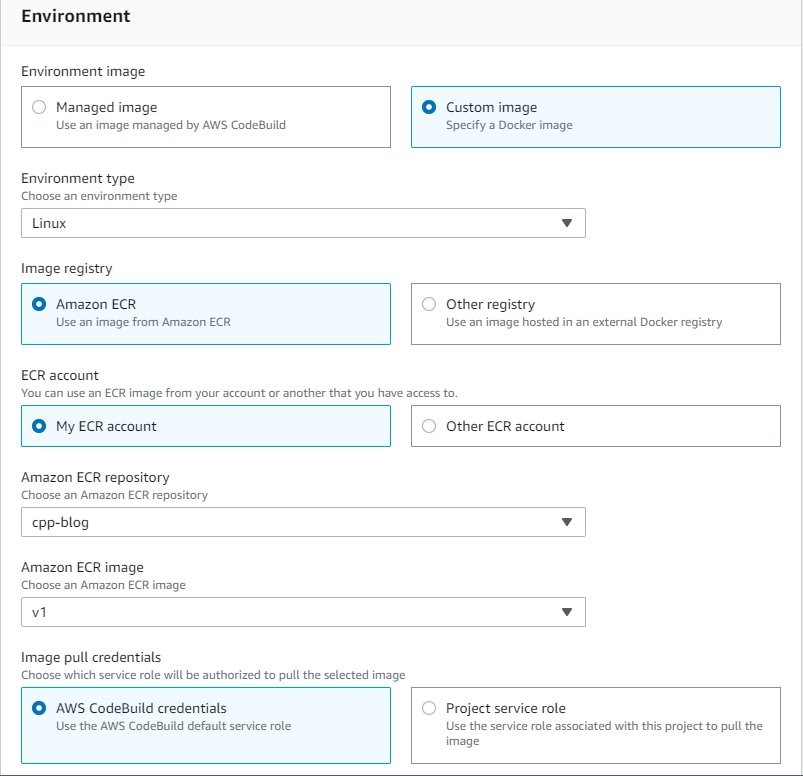
- For Service role, select New service role.
- For Role name, enter
cpp-test-role.
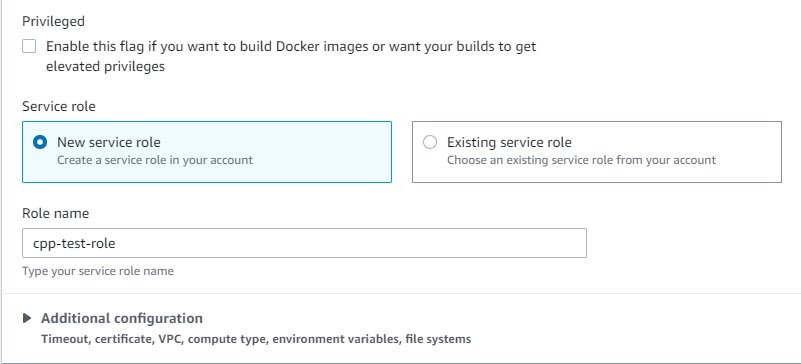
- For Compute, select 3 GB memory.
- For Environment variables, enter the variables used to test
sample_cpp_app.
- Add the value for
BUCKET_NAME that you created earlier.
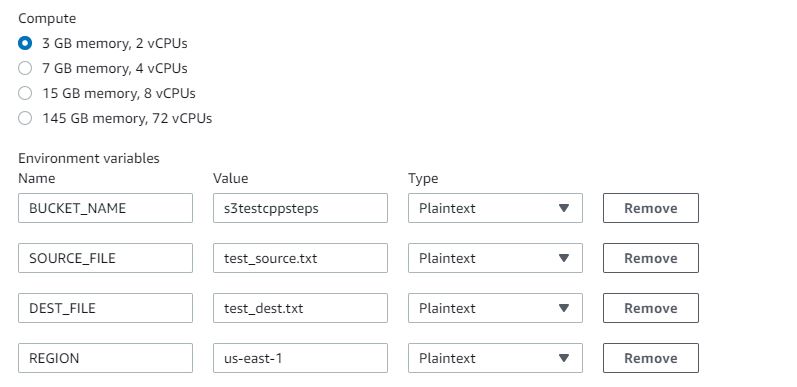
Now we update the IAM service role with permissions to push and pull images and to copy files to Amazon S3.
- On the IAM console, choose Policies.
- Choose Create policy.
- On the JSON tab, enter the following code:
{
"Version": "2012-10-17",
"Statement": [{
"Effect": "Allow",
"Action": "s3:PutObject",
"Resource": "*"
}]
}
- Review and create the policy, called
S3WritePolicy.On the Roles page, locate the role cpp-test-role.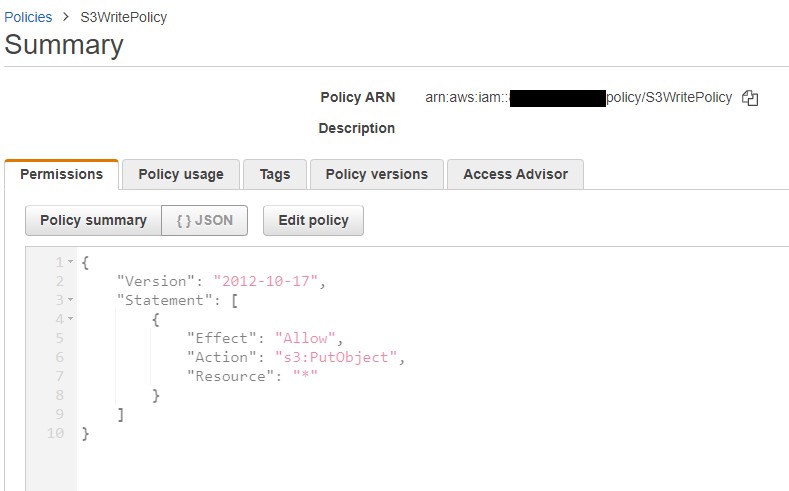
- Choose Attach policies.
- Add the following policies to the role.
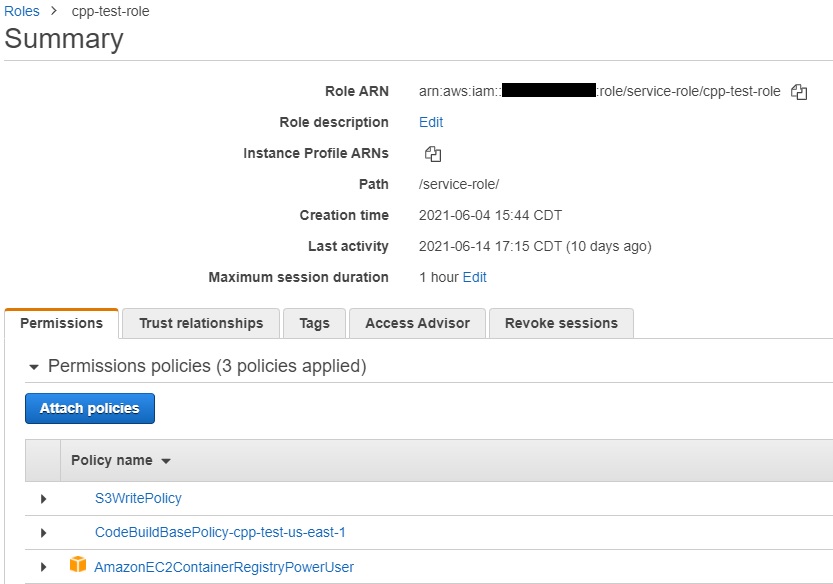
- Run the build project.
- Validate that the
test_source.txt file was copied to the S3 bucket with the new name test_dest.txt.
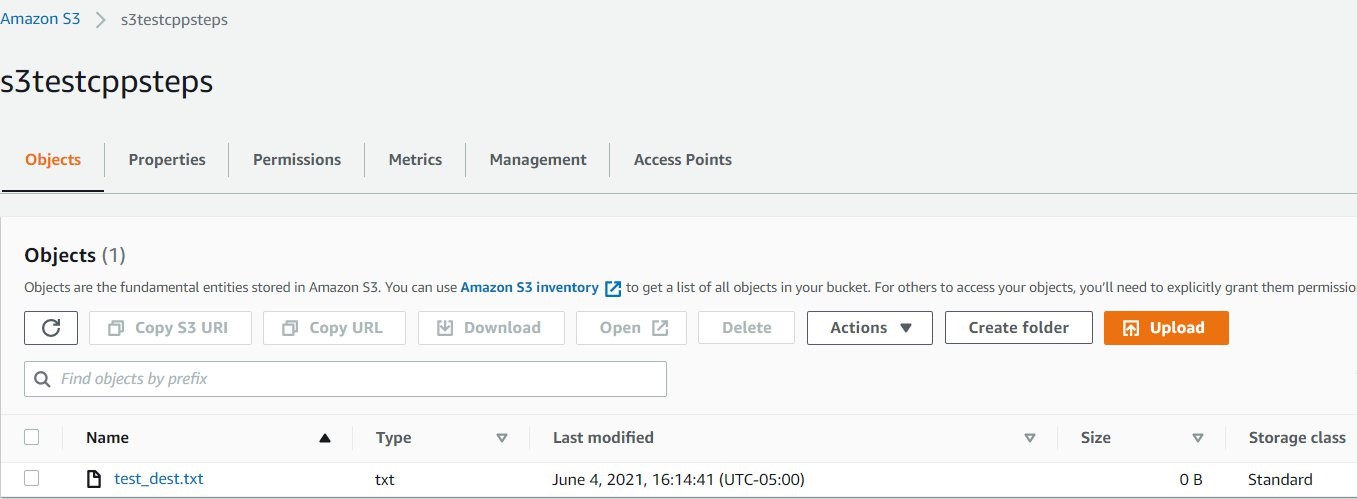
Clean up
When you’ve completed all steps and are finished testing, follow these steps to delete resources to avoid incurring costs:
- On the ECR console, from Repositories, choose
cpp-blog then Delete.
- On the CodeCommit console, choose Repositories.
- Choose
cpp_custom_build_image repository and choose Delete repository;
- Choose
sample_cpp_app repository and choose Delete repository.
- On the Amazon S3 console, choose the test bucket created, choose Empty. Confirm the deletion by typing ‘permanently delete’. Choose Empty.
- Choose the test bucket created and Delete.
- On the IAM console, choose Roles.
- Search for
cpp-custom-image-build-role and Delete; Search for cpp-test-role and Delete.
- On the Policies page, choose
S3WritePolicy and choose Policy Actions and Delete.
- Go to the CodeBuild console. From Build projects, choose
cpp_custom_build, Choose Delete build project; Choose cpp-test and choose Delete build project.
Conclusion
In this post, we demonstrated how you can create a custom Docker image using CodeBuild and use it to build CPP applications. We also successfully tested the build image using a sample CPP application.
You can extend the Docker file used to build the custom image to include any specific libraries your applications may require. Also, you can build the libraries included in this Docker file from source if your application requires a specific version of the library.
Enforcing AWS CloudFormation scanning in CI/CD Pipelines at scale using Trend Micro Cloud One Conformity
=======================
Integrating AWS CloudFormation template scanning into CI/CD pipelines is a great way to catch security infringements before application deployment. However, implementing and enforcing this in a multi team, multi account environment can present some challenges, especially when the scanning tools used require external API access.
This blog will discuss those challenges and offer a solution using Trend Micro Cloud One Conformity (formerly Cloud Conformity) as the worked example. Accompanying this blog is the end to end sample solution and detailed install steps which can be found on GitHub here.
We will explore explore the following topics in detail:
When to detect security vulnerabilities
Where can template scanning be enforced?
Managing API Keys for accessing third party APIs
How can keys be obtained and distributed between teams?
How easy is it to rotate keys with multiple teams relying upon them?
Viewing the results easily
How do teams easily view the results of any scan performed?
Solution maintainability
How can a fix or update be rolled out?
How easy is it to change scanner provider? (i.e. from Cloud Conformity to in house tool)
Enforcing the template validation
How to prevent teams from circumventing the checks?
Managing exceptions to the rules
How can the teams proceed with deployment if there is a valid reason for a check to fail?
When to detect security vulnerabilities
During the DevOps life-cycle, there are multiple opportunities to test cloud applications for best practice violations when it comes to security. The Shift-left approach is to move testing to as far left in the life-cycle, so as to catch bugs as early as possible. It is much easier and less costly to fix on a local developer machine than it is to patch in production.
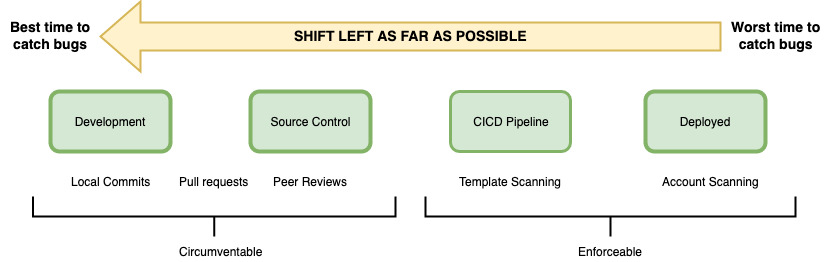
Figure 1 – depicting the stages that an app will pass through before being deployed into an AWS account
At the very left of the cycle is where developers perform the traditional software testing responsibilities (such as unit tests), With cloud applications, there is also a responsibility at this stage to ensure there are no AWS security, configuration, or compliance vulnerabilities. Developers and subsequent peer reviewers looking at the code can do this by eye, but in this way it is hard to catch every piece of bad code or misconfigured resource.
For example, you might define an AWS Lambda function that contains an access policy making it accessible from the world, but this can be hard to spot when coding or peer review. Once deployed, potential security risks are now live. Without proper monitoring, these misconfigurations can go undetected, with potentially dire consequences if exploited by a bad actor.
There are a number of tools and SaaS offerings on the market which can scan AWS CloudFormation templates and detect infringements against security best practices, such as Stelligent’s cfn_nag, AWS CloudFormation Guard, and Trend Micro Cloud One Conformity. These can all be run from the command line on a developer’s machine, inside the IDE or during a git commit hook. These options are discussed in detail in Using Shift-Left to Find Vulnerabilities Before Deployment with Trend Micro Template Scanner.
Whilst this is the most left the testing can be moved, it is hard to enforce it this early on in the development process. Mandating that scan commands be integrated into git commit hooks or IDE tools can significantly increase the commit time and quickly become frustrating for the developer. Because they are responsible for creating these hooks or installing IDE extensions, you cannot guarantee that a template scan is performed before deployment, because the developer could easily turn off the scans or not install the tools in the first place.
Another consideration for very-left testing of templates is that when applications are written using AWS CDK or AWS Serverless Application Model (SAM), the actual AWS CloudFormation template that is submitted to AWS isn’t available in source control; it’s created during the build or package stage. Therefore, moving template scanning as far to the left is just not possible in these situations. Developers have to run a command such as cdk synth or sam package to obtain the final AWS CloudFormation templates.
If we now look at the far right of Figure 1, when an application has been deployed, real time monitoring of the account can pick up security issues very quickly. Conformity performs excellently in this area by providing central visibility and real-time monitoring of your cloud infrastructure with a single dashboard. Accounts are checked against over 400 best practices, which allows you to find and remediate non-compliant resources. This real time alerting is fast – you can be assured of an email stating non-compliance in no time at all! However, remediation does takes time. Following the correct process, a fix to code will need to go through the CI/CD pipeline again before a patch is deployed. Relying on account scanning only at the far right is sub-optimal.
The best place to scan templates is at the most left of the enforceable part of the process – inside the CI/CD pipeline. Conformity provides their Template Scanner API for this exact purpose. Templates can be submitted to the API, and the same Conformity checks that are being performed in real time on the account are run against the submitted AWS CloudFormation template. When integrated programmatically into a build, failing checks can prevent a deployment from occurring.
Whilst it may seem a simple task to incorporate the Template Scanner API call into a CI/CD pipeline, there are many considerations for doing this successfully in an enterprise environment. The remainder of this blog will address each consideration in detail, and the accompanying GitHub repo provides a working sample solution to use as a base in your own organization.
View failing checks as AWS CodeBuild test reports
Treating failing Conformity checks the same as unit test failures within the build will make the process feel natural to the developers. A failing unit test will break the build, and so will a failing Conformity check.
AWS CodeBuild provides test reporting for common unit test frameworks, such as NUnit, JUnit, and Cucumber. This allows developers to easily and very visually see what failing tests have occurred within their builds, allowing for quicker remediation than having to trawl through test log files. This same principle can be applied to failing Conformity checks—this allows developers to quickly see what checks have failed, rather than looking into AWS CodeBuild logs. However, the AWS CodeBuild test reporting feature doesn’t natively support the JSON schema that the Conformity Template Scanner API returns. Instead, you need custom code to turn the Conformity response into a usable format. Later in this blog we will explore how the conversion occurs.
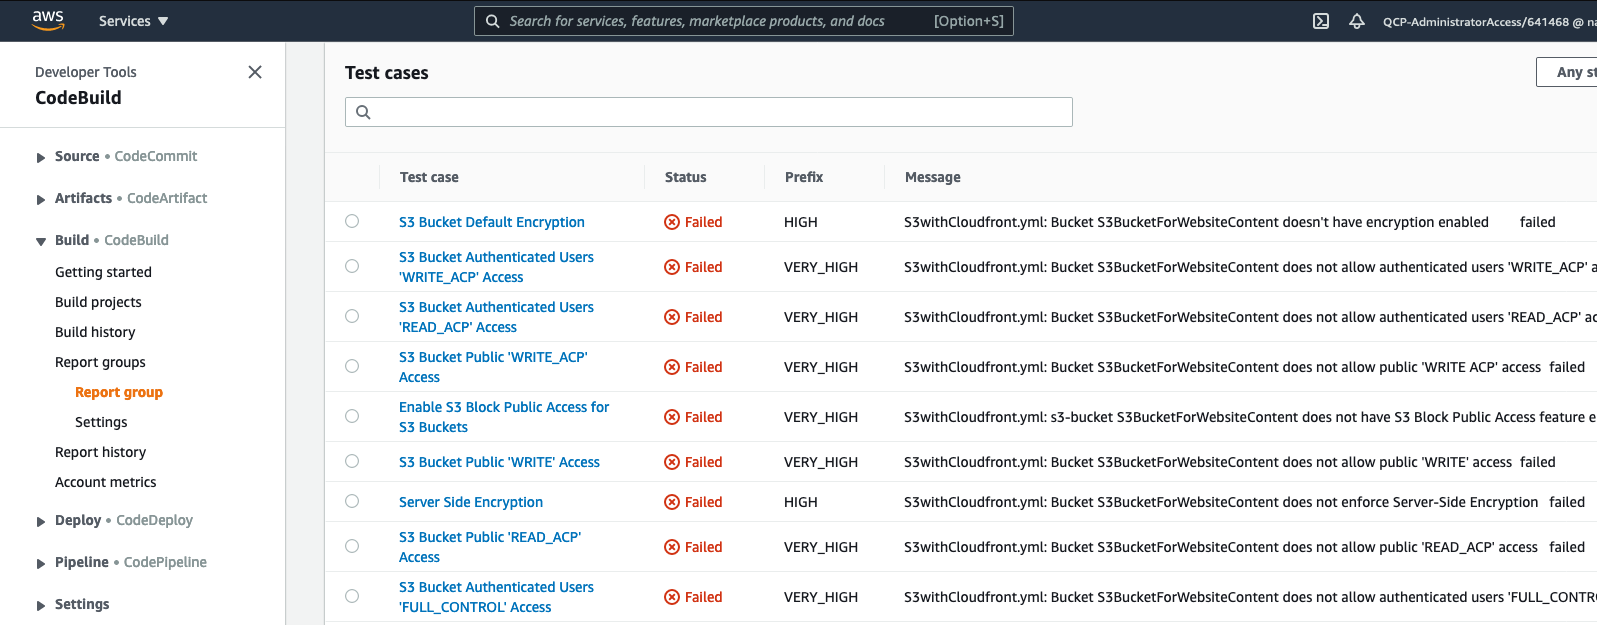
Figure 2 – Cloud Conformity failed checks appearing as failed test cases in AWS CodeBuild reports
Enterprise speed bumps
Teams wishing to use template scanning as part of their AWS CodePipeline currently need to create an AWS CodeBuild project that calls the external API, and then performs the custom translation code. If placed inside a buildspec file, it can easily become bloated with many lines of code, leading to maintainability issues arising as copies of the same buildspec file are distributed across teams and accounts. Additionally, third-party APIs such as Conformity are often authorized by an API key. In some enterprises, not all teams have access to the Conformity console, further compounding the problem for API key management.
Below are some factors to consider when implementing template scanning in the enterprise:
How can keys be obtained and distributed between teams?
How easy is it to rotate keys when multiple teams rely upon them?
How can a fix or update be rolled out?
How easy is it to change scanner provider? (i.e. From Cloud Conformity to in house tool)
Overcome scaling issues, use a centralized Validation API
An approach to overcoming these issues is to create a single AWS Lambda function fronted by Amazon API Gateway within your organization that runs the call to the Template Scanner API, and performs the transform of results into a format usable by AWS CodeBuild reports. A good place to host this API is within the Cloud Ops team account or similar shared services account. This way, you only need to issue one API key (stored in AWS Secrets Manager) and it’s not available for viewing by any developers. Maintainability for the code performing the Template Scanner API calls is also very easy, because it resides in one location only. Key rotation is now simple (due to only one key in one location requiring an update) and can be automated through AWS Secrets Manager
The following diagram illustrates a typical setup of a multi-account, multi-dev team scenario in which a team’s AWS CodePipeline uses a centralized Validation API to call Conformity’s Template Scanner.
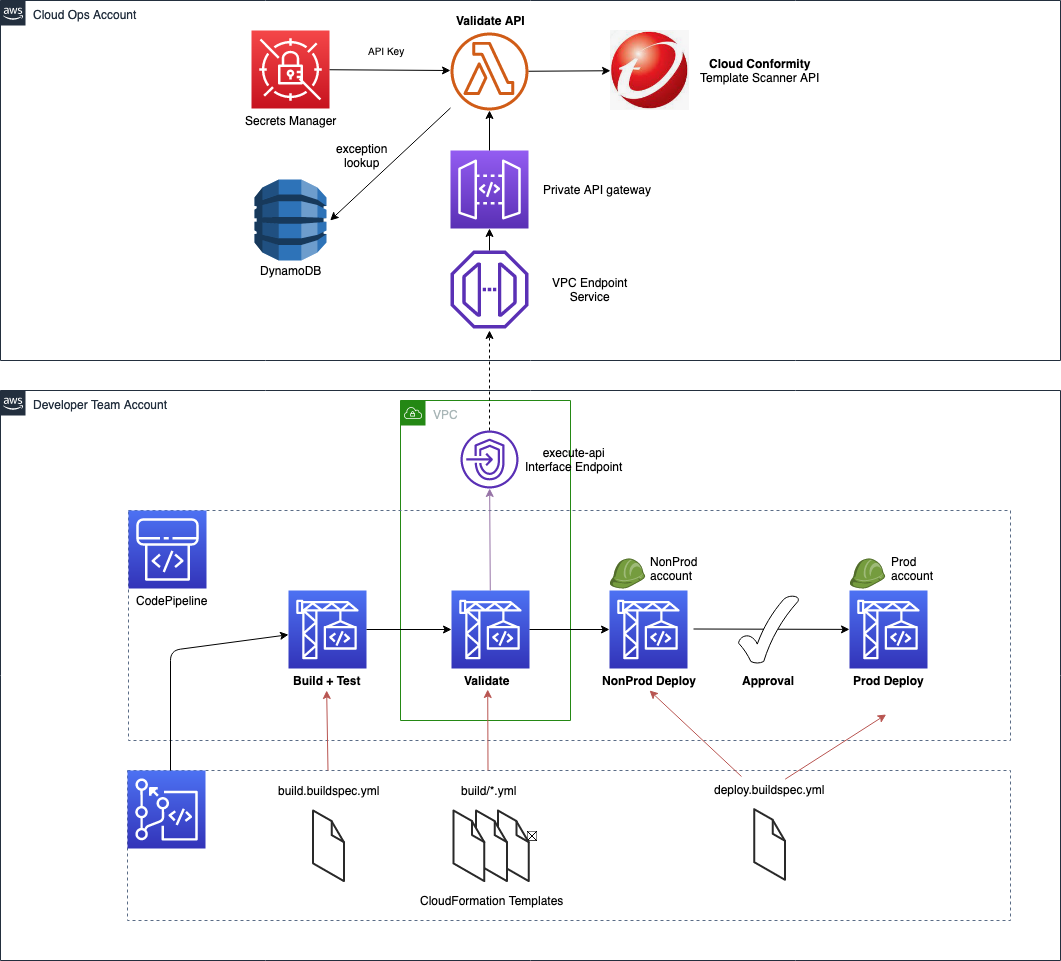
Figure 3 – Example of an AWS CodePipeline utilizing a centralized Validation API to call Conformity’s Template Scanner
Providing a wrapper API around the Conformity Template Scanner API encapsulates the code required to create the CodeBuild reports. Enabling template scanning within teams’ CI/CD pipelines now requires only a small piece of code within their CodeBuild buildspec file. It performs the following three actions:
- Post the AWS CloudFormation templates to the centralized Validation API
- Write the results to file (which are already in a format readable by CodeBuild test reports)
- Stop the build if it detects failed checks within the results
The centralized Validation API in the shared services account can be hosted with a private API in Amazon API Gateway, fronted by a VPC endpoint. Using a private API denies any public access but does allow access from any internal address allowed by the VPC endpoint security group and endpoint policy. The developer teams can run their AWS CodeBuild validation phase within a VPC, thereby giving it access to the VPC endpoint.
A working example of the code required, along with an AWS CodeBuild buildspec file, is provided in the GitHub repository
Converting 3rd party tool results to CodeBuild Report format
With a centralized API, there is now only one place where the conversion code needs to reside (as opposed to copies embedded in each teams’ CodePipeline). AWS CodeBuild Reports are primarily designed for test framework outputs and displaying test case results. In our case, we want to display Conformity checks – which are not unit test case results. The accompanying GitHub repository to convert from Conformity Template Scanner API results, but we will discuss mappings between the formats so that bespoke conversions for other 3rd party tools, such as cfn_nag can be created if required.
AWS CodeBuild provides out of the box compatibility for common unit test frameworks, such as NUnit, JUnit and Cucumber. Out of the supported formats, Cucumber JSON is the most readable format to read and manipulate due to native support in languages such as Python (all other formats being in XML).
Figure 4 depicts where the Cucumber JSON fields will appear in the AWS CodeBuild reports page and Figure 5 below shows a valid Cucumber snippet, with relevant fields highlighted in yellow.
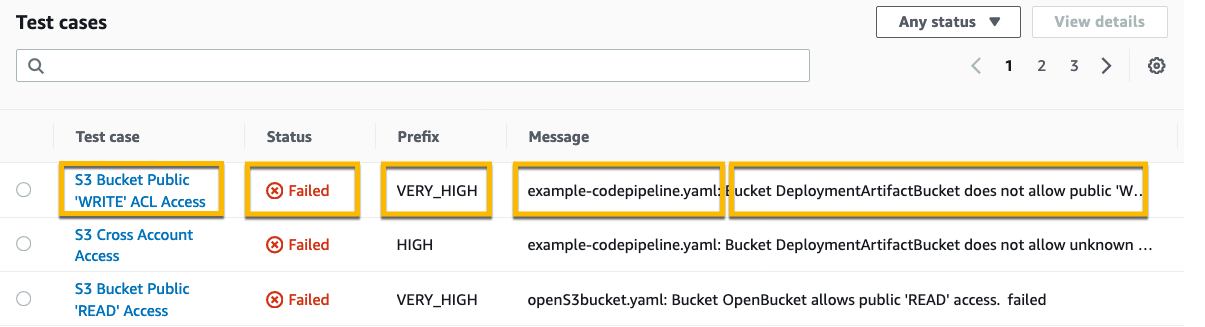
Figure 4 – AWS CodeBuild report test case field mappings utilized by Cucumber JSON
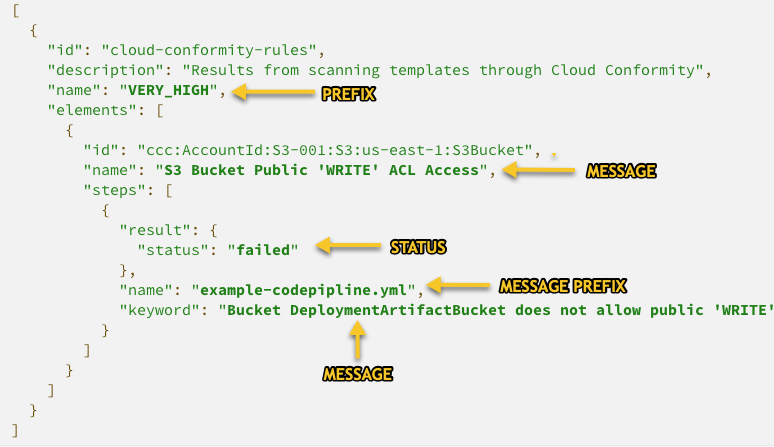
Figure 5 – Cucumber JSON with mappings to AWS CodeBuild report table
Note that in Figure 5, there are additional fields (eg. id, description etc) that are required to make the file valid Cucumber JSON – even though this data is not displayed in CodeBuild Reports page. However, raw reports are still available as AWS CodeBuild artifacts, and therefore it is useful to still populate these fields with data that could be useful to aid deeper troubleshooting.
Conversion code for Conformity results is provided in the accompanying GitHub repo, within file app.py, line 376 onwards
Making the validation phase mandatory in AWS CodePipeline
The Shift-Left philosophy states that we should shift testing as much as possible to the left. The furthest left would be before any CI/CD pipeline is triggered. Developers could and should have the ability to perform template validation from their own machines. However, as discussed earlier this is rarely enforceable – a scan during a pipeline deployment is the only true way to know that templates have been validated. But how can we mandate this and truly secure the validation phase against circumvention?
Preventing updates to deployed CI/CD pipelines
Using a centralized API approach to make the call to the validation API means that this code is now only accessible by the Cloud Ops team, and not the developer teams. However, the code that calls this API has to reside within the developer teams’ CI/CD pipelines, so that it can stop the build if failures are found. With CI/CD pipelines defined as AWS CloudFormation, and without any preventative measures in place, a team could move to disable the phase and deploy code without any checks performed.
Fortunately, there are a number of approaches to prevent this from happening, and to enforce the validation phase. We shall now look at one of them from the AWS CloudFormation Best Practices.
IAM to control access
Use AWS IAM to control access to the stacks that define the pipeline, and then also to the AWS CodePipeline/AWS CodeBuild resources within them.
IAM policies can generically restrict a team from updating a CI/CD pipeline provided to them if a naming convention is used in the stacks that create them. By using a naming convention, coupled with the wildcard “*”, these policies can be applied to a role even before any pipelines have been deployed..
For example, lets assume the pipeline depicted in Figure 6 is defined and deployed in AWS CloudFormation as follows:
Stack name is “cicd-pipeline-team-X”
AWS CodePipeline resource within the stack has logical name with prefix “CodePipelineCICD”
AWS CodeBuild Project for validation phase is prefixed with “CodeBuildValidateProject”
Creating an IAM policy with the statements below and attaching to the developer teams’ IAM role will prevent them from modifying the resources mentioned above. The AWS CloudFormation stack and resource names will match the wildcards in the statements and Deny the user to any update actions.
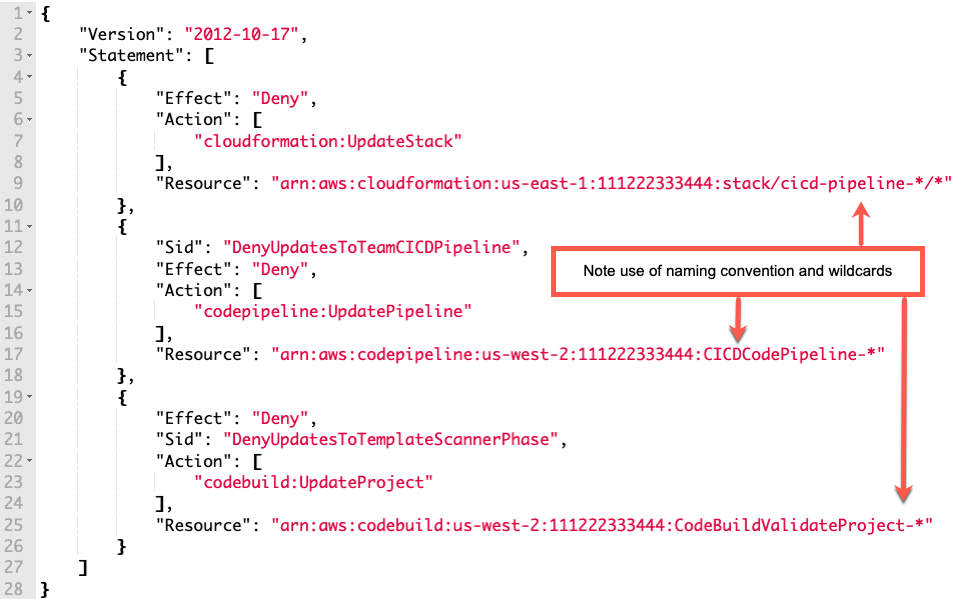
Figure 6 – Example of how an IAM policy can restrict updates to AWS CloudFormation stacks and deployed resources
Preventing valid failing checks from being a bottleneck
When centralizing anything, and forcing developers to use tooling or features such as template scanners, it is imperative that it (or the team owning it) does not become a bottleneck and slow the developers down. This is just as true for our centralized API solution.
It is sometimes the case that a developer team has a valid reason for a template to yield a failing check. For instance, Conformity will report a HIGH severity alert if a load balancer does not have an HTTPS listener. If a team is migrating an older application which will only work on port 80 and not 443, the team may be able to obtain an exception from their cyber security team. It would not desirable to turn off the rule completely in the real time scanning of the account, because for other deployments this HIGH severity alert could be perfectly valid. The team faces an issue now because the validation phase of their pipeline will fail, preventing them from deploying their application – even though they have cyber approval to fail this one check.
It is imperative that when enforcing template scanning on a team that it must not become a bottleneck. Functionality and workflows must accompany such a pipeline feature to allow for quick resolution.
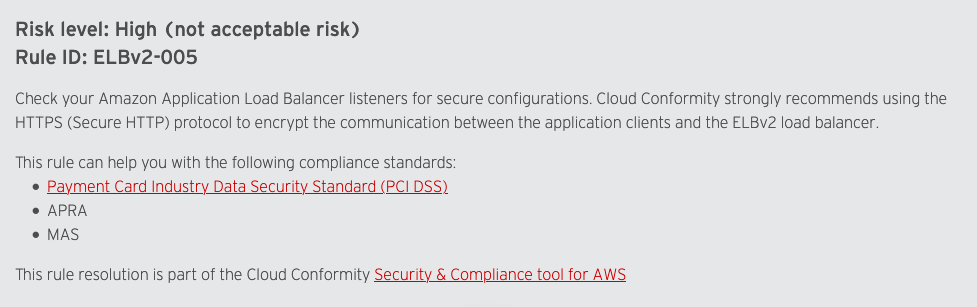
Figure 7 – Screenshot of a Conformity rule from their website
Therefore the centralized validation API must provide a way to allow for exceptions on a case by case basis. Any exception should be tied to a unique combination of AWS account number + filename + rule ID, which ensures that exceptions are only valid for the specific instance of violation, and not for any other. This can be achieved by extending the centralized API with a set of endpoints to allow for exception request and approvals. These can then be integrated into existing or new tooling and workflows to be able to provide a self service method for teams to be able to request exceptions. Cyber security teams should be able to quickly approve/deny the requests.
The exception request/approve functionality can be implemented by extending the centralized private API to provide an /exceptions endpoint, and using DynamoDB as a data store. During a build and template validation, failed checks returned from Conformity are then looked up in the Dynamo table to see if an approved exception is available – if it is, then the check is not returned as a actual failing check, but rather an exempted check. The build can then continue and deploy to the AWS account.
Figure 8 and figure 9 depict the /exceptions endpoints that are provided as part of the sample solution in the accompanying GitHub repository.
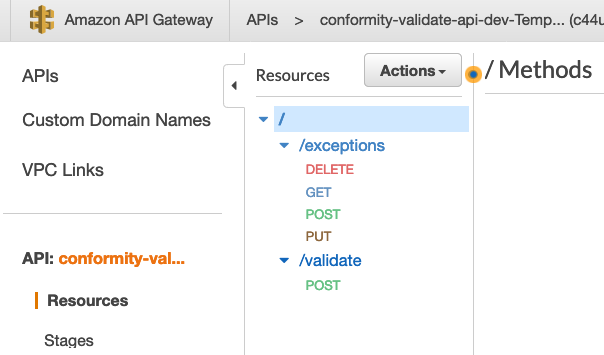
Figure 8 – Screenshot of API Gateway depicting the endpoints available as part of the accompanying solution
The /exceptions endpoint methods provides the following functionality:
Figure 9 – HTTP verbs implementing exception functionality
Important note regarding endpoint authorization: Whilst the “validate” private endpoint may be left with no auth so that any call from within a VPC is accepted, the same is not true for the “exception” approval endpoint. It would be prudent to use AWS IAM authentication available in API Gateway to restrict approvals to this endpoint for certain users only (i.e. the cyber and cloud ops team only)
With the ability to raise and approve exception requests, the mandatory scanning phase of the developer teams’ pipelines is no longer a bottleneck.
Conclusion
Enforcing template validation into multi developer team, multi account environments can present challenges with using 3rd party APIs, such as Conformity Template Scanner, at scale. We have talked through each hurdle that can be presented, and described how creating a centralized Validation API and exception approval process can overcome those obstacles and keep the teams deploying without unwarranted speed bumps.
By shifting left and integrating scanning as part of the pipeline process, this can leave the cyber team and developers sure that no offending code is deployed into an account – whether they were written in AWS CDK, AWS SAM or AWS CloudFormation.
Additionally, we talked in depth on how to use CodeBuild reports to display the vulnerabilities found, aiding developers to quickly identify where attention is required to remediate.
Getting started
The blog has described real life challenges and the theory in detail. A complete sample for the described centralized validation API is available in the accompanying GitHub repo, along with a sample CodePipeline for easy testing. Step by step instructions are provided for you to deploy, and enhance for use in your own organization. Figure 10 depicts the sample solution available in GitHub.
https://github.com/aws-samples/aws-cloudformation-template-scanning-with-cloud-conformity
NOTE: Remember to tear down any stacks after experimenting with the provided solution, to ensure ongoing costs are not charged to your AWS account. Notes on how to do this are included inside the repo Readme.
Figure 10 depicts the solution available for use in the accompanying GitHub repository
Find out more
Other blog posts are available that cover aspects when dealing with template scanning in AWS:
Using Shift-Left to find vulnerabilities before deployment with Trend Micro Template Scanner
Integrating AWS CloudFormation security tests with AWS Security Hub and AWS CodeBuild reports
For more information on Trend Micro Cloud One Conformity, use the links below.
Trend Micro Cloud One Conformity product
Template Scanner Documentation
Template Scanner API reference


Chris Dorrington
Chris Dorrington is a Senior Cloud Architect with AWS Professional Services in Perth, Western Australia. Chris loves working closely with AWS customers to help them achieve amazing outcomes. He has over 25 years software development experience and has a passion for Serverless technologies and all things DevOps
Page 1|Page 2|Page 3|Page 4